Strategie zur Umkehrung des doppelten gleitenden Durchschnitts-Crossovers

1
Follow
1779
Followers
Überblick
Die Hauptidee der Strategie ist es, die Kreuzung von schnellen und langsamen Durchschnittslinien zu nutzen, um Markttrends zu beurteilen und bei einer Umkehrung der kurzen und langen Durchschnittslinien einzutreten, um die Trends zu verfolgen.
Strategieprinzip
- Setzen Sie schnelle bewegliche Durchschnittsphase (shortma) und langsame bewegliche Durchschnittsphase (longma) (standardmäßig 7 Tage)
- Wenn die kurze Linie die lange Linie überschreitet, wird dies als Kaufsignal beurteilt und als barssince (mabuy) aufgezeichnet, wobei die lange Linie den Eintritt in den Trend bedeutet. Wenn die kurze Linie die lange Linie unterhalb der mittleren Linie überschreitet, wird dies als Verkaufssignal beurteilt und als barssince (masell) aufgezeichnet, wobei die lange Linie den Trend beendet bedeutet.
- Vergleichen Sie die Größe der Barssince: Die Anzahl der Bars, die die kurze Durchschnittslinie von oben nach unten überschreitet, bedeutet, dass die Tendenz länger andauert; umgekehrt bedeutet die Anzahl der Bars, die die kurze Durchschnittslinie von unten nach oben überschreitet, die Stärke des Umkehrsignals
- Ein Kaufsignal wird gesendet, wenn die Anzahl der Verkaufsbars größer ist als die Anzahl der Kaufbars; ein Verkaufssignal wird gesendet, wenn die Anzahl der Kaufbars größer ist als die Anzahl der Verkaufsbars.
- Such-Strategie ist im Wesentlichen eine Binär-Gleichgewichtsumkehr-Strategie, bei der ein Trendwendepunkt durch eine Umkehrung der schnellen Mittellinie und der langsamen Mittellinie beurteilt wird
Strategische Vorteile
- Mit der doppelten Gleichheitsbeurteilung wurde ein Teil des Noise-Trading-Signals gefiltert.
- Barssince-Vergleiche hinzugefügt, um Fehlsignale durch False-Fraktions- und Close-Price-Umkehrungen zu vermeiden
- Einfach zu verstehen und umzusetzen
- Anpassbare Moving Average-Parameter für verschiedene Perioden und Märkte
Strategisches Risiko
- Eine Binäre-Strategie erzeugt leicht mehr Signale und häufigere Transaktionen
- Die falsche Einstellung der Moving Average-Parameter kann eine längere Trendchance verpassen
- Wenn die langfristige Durchschnittslinie überschritten wird, kann der Stopppunkt weit entfernt sein und es gibt einen größeren Rückzug.
- Das Problem ist, dass es keine wirksame Filterung der Spirale und des Schwingungsmarktes gibt.
Richtung der Strategieoptimierung
- Filter für weitere Indikatoren, um nicht in den Schock gefangen zu sein
- Erhöhung der Stop-Loss-Mechanismen
- Optimierung der Parameterkombination für die bewegliche Durchschnittslinie
- Moving Average-Parameter, angepasst an die Dynamik der Marktzyklen
Zusammenfassen
Die Strategie als Ganzes ist logisch klar und verständlich. Die Trendwendepunkte der Markttrends werden anhand von schnellen Durchschnittslinien und langsamer Durchschnittslinie-Umkehrung beurteilt. Theoretisch ist es möglich, Trends effektiv zu verfolgen. In der Praxis müssen jedoch die Strategie-Algorithmen und die Parameter-Einstellungen optimiert werden, um sie stabiler und praktischer zu machen.
Source
Pine
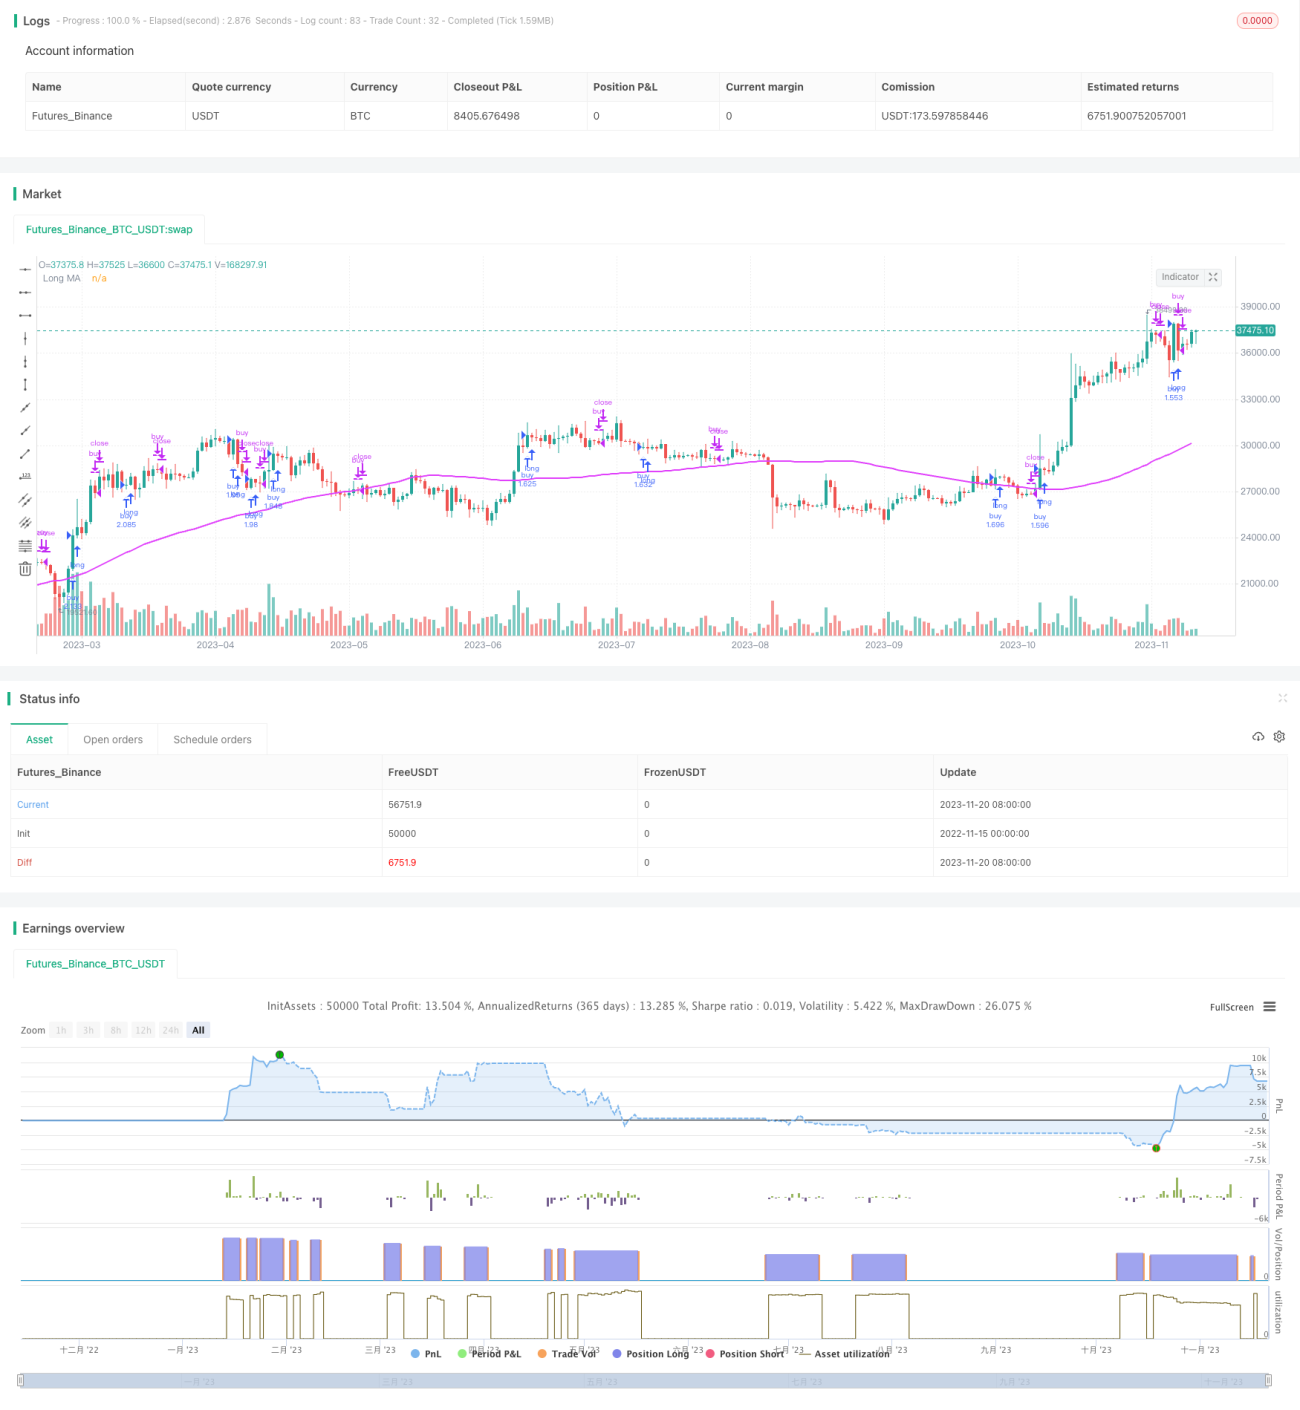
/*backtest
start: 2022-11-15 00:00:00
end: 2023-11-21 00:00:00
period: 1d
basePeriod: 1h
exchanges: [{"eid":"Futures_Binance","currency":"BTC_USDT"}]
*/

//@version=3
strategy("Up Down", "Up Down", precision = 6, pyramiding = 1, default_qty_type = strategy.percent_of_equity, default_qty_value = 99, commission_type = strategy.commission.percent, commission_value = 0.0, initial_capital = 1000, overlay = true)

buy = close > open and open > close[1]Strategy parameters
Related strategies
Comment
All comments (0)
No data
- 1