
Die Strategie ist eine quantitative Trading-Strategie, bei der die RSI- und T3-Indikatoren Trends beurteilen, die Stop-Lines in Verbindung mit den ATR-Indikatoren festlegen und PMax anpassen, um den Durchbruch zu erzielen. Die Hauptidee ist die Optimierung von Trends und Stop-Loss-Einstellungen, um Risiken zu kontrollieren und gleichzeitig die Profitabilität zu verbessern.
Berechnung von RSI und T3-Indikatoren zur Trendbestimmung
PMax-Adaptionsstop-Linie nach ATR-Indikatoren eingestellt
Breakout-Buy und Stop-Loss-Exit
Diese Strategie hat folgende Vorteile:
Diese Strategie birgt folgende Risiken:
Wenn ein kurzfristiger Kurswechsel eintritt, kann dies dazu führen, dass ein Stop-Loss ausgelöst wird. Die Stop-Loss-Linie kann entsprechend gelockert werden, um den Effekt des Kurswechsels zu verringern.
Der RSI und der T3-Indikator sind nicht zu 100% zuverlässig, wenn sie Trends beurteilen, was zu Verlusten führt. Sie können die Parameter entsprechend anpassen oder andere Indikatoren hinzufügen, um sie zu optimieren.
Die Strategie kann in folgenden Bereichen weiter optimiert werden:
Die Strategie integriert die Vorteile der drei Indikatoren RSI, T3 und ATR und ermöglicht eine organische Kombination von Trendbeurteilung und Risikokontrolle. Im Vergleich zu einem einzelnen Indikator ist die Kombination von hoher Beurteilungsgenauigkeit und gutem Rückzugskontrolle eine zuverlässige Trendverfolgungsstrategie. Es gibt noch Optimierungsmöglichkeiten in Bezug auf Parameter und Risikokontrolle und ist insgesamt eine empfehlenswerte quantitative Handelsstrategie.
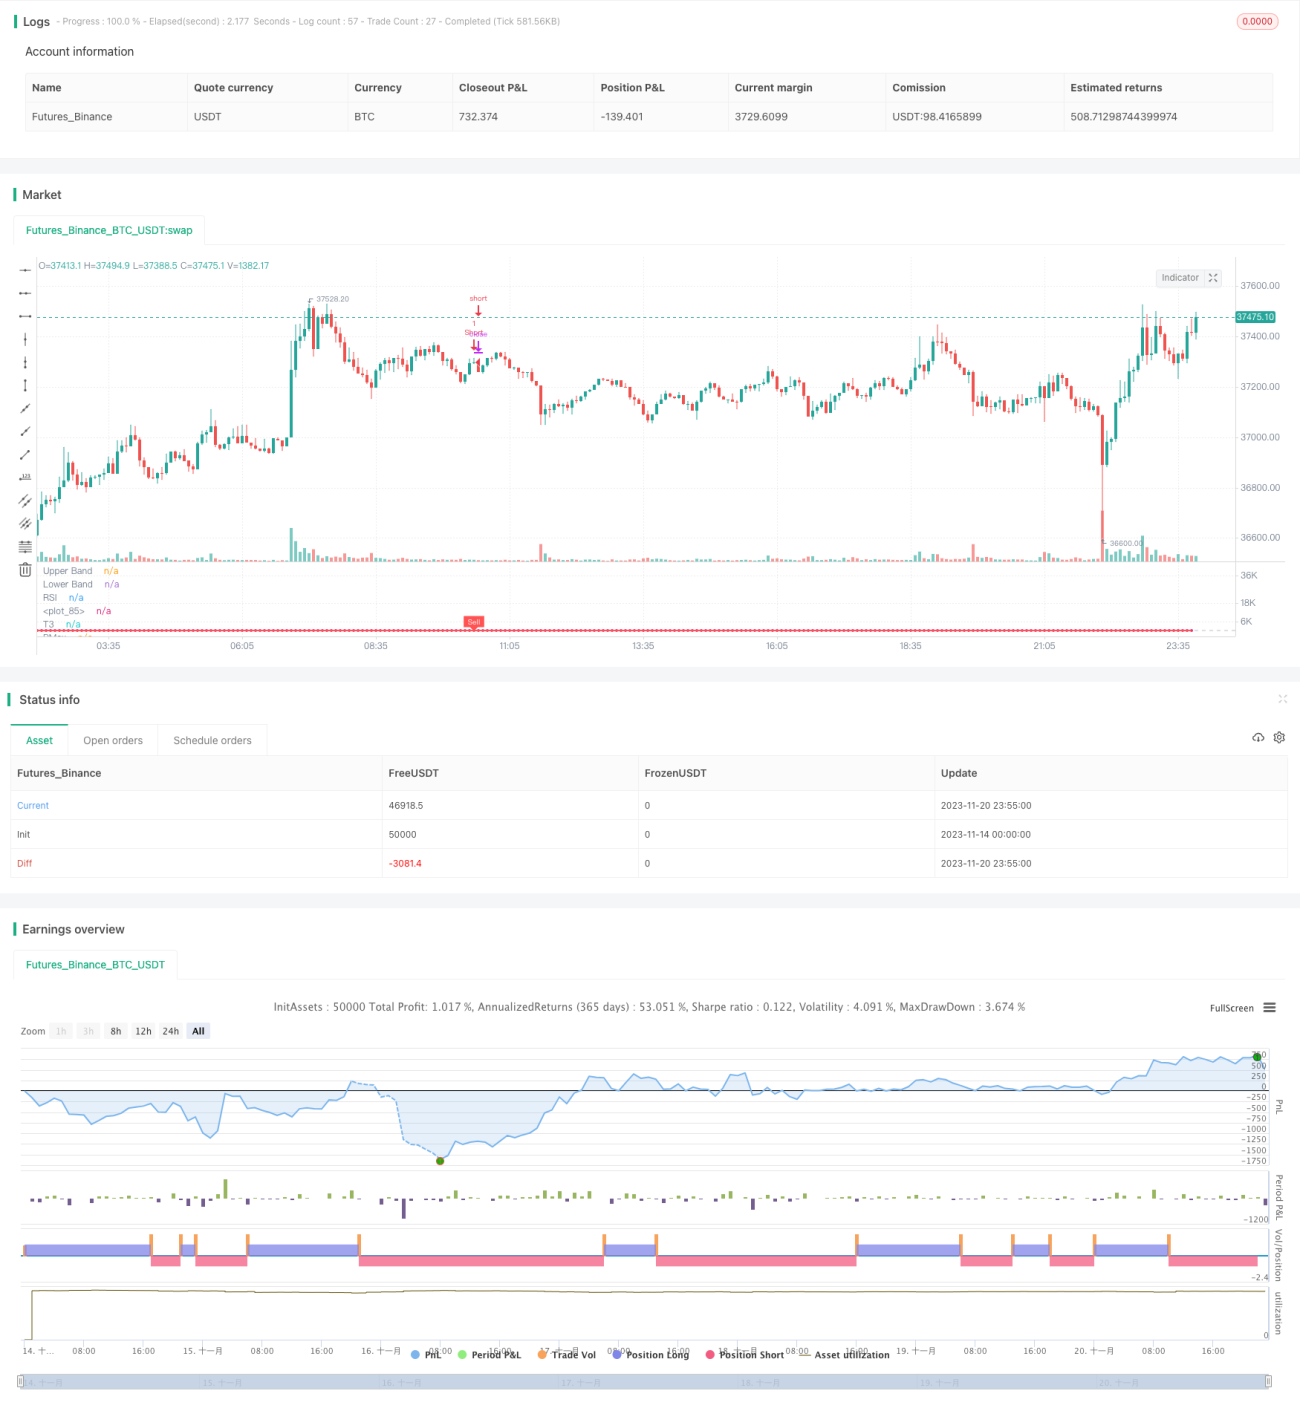
/*backtest
start: 2023-11-14 00:00:00
end: 2023-11-21 00:00:00
period: 5m
basePeriod: 1m
exchanges: [{"eid":"Futures_Binance","currency":"BTC_USDT"}]
*/
//@version=4
// This source code is subject to the terms of the Mozilla Public License 2.0 at https://mozilla.org/MPL/2.0/
// © KivancOzbilgic
//developer: @KivancOzbilgic
//author: @KivancOzbilgic
strategy("PMax on Rsi w T3 Strategy","PmR3St.", overlay=false, precision=2)
src = input(hl2, title="Source")
Multiplier = input(title="ATR Multiplier", type=input.float, step=0.1, defval=3)
length =input(8, "Tillson T3 Length", minval=1)
T3a1 = input(0.7, "TILLSON T3 Volume Factor", step=0.1)
Periods = input(10,title="ATR Length", type=input.integer)
rsilength = input(14, minval=1, title="RSI Length")
showrsi = input(title="Show RSI?", type=input.bool, defval=true)
showsupport = input(title="Show Moving Average?", type=input.bool, defval=true)
showsignalsk = input(title="Show Crossing Signals?", type=input.bool, defval=true)
highlighting = input(title="Highlighter On/Off ?", type=input.bool, defval=true)
i = close>=close[1] ? close-close[1] : 0
i2 = close<close[1] ? close[1]-close : 0
Wwma_Func(src,rsilength)=>
wwalpha = 1/ rsilength
WWMA = 0.0
WWMA := wwalpha*src + (1-wwalpha)*nz(WWMA[1])
WWMA=Wwma_Func(src,rsilength)
AvUp = Wwma_Func(i,rsilength)
AvDown = Wwma_Func(i2,rsilength)
AvgUp = sma(i,rsilength)
AvgDown =sma(i2,rsilength)
k1 = high>close[1] ? high-close[1] : 0
k2 = high<close[1] ? close[1]-high : 0
k3 = low>close[1] ? low-close[1] : 0
k4 = low<close[1] ? close[1]-low : 0
AvgUpH=(AvgUp*(rsilength-1)+ k1)/rsilength
AvgDownH=(AvgDown*(rsilength-1)+ k2)/rsilength
AvgUpL=(AvgUp*(rsilength-1)+ k3)/rsilength
AvgDownL=(AvgDown*(rsilength-1)+ k4)/rsilength
rs = AvUp/AvDown
rsi= rs==-1 ? 0 : (100-(100/(1+rs)))
rsh=AvgUpH/AvgDownH
rsih= rsh==-1 ? 0 : (100-(100/(1+rsh)))
rsl=AvgUpL/AvgDownL
rsil= rsl==-1 ? 0 : (100-(100/(1+rsl)))
TR=max(rsih-rsil,abs(rsih-rsi[1]),abs(rsil-rsi[1]))
atr=sma(TR,Periods)
plot(showrsi ? rsi : na, "RSI", color=#8E1599)
band1 = hline(70, "Upper Band", color=#C0C0C0)
band0 = hline(30, "Lower Band", color=#C0C0C0)
fill(band1, band0, color=#9915FF, transp=90, title="Background")
T3e1=ema(rsi, length)
T3e2=ema(T3e1,length)
T3e3=ema(T3e2,length)
T3e4=ema(T3e3,length)
T3e5=ema(T3e4,length)
T3e6=ema(T3e5,length)
T3c1=-T3a1*T3a1*T3a1
T3c2=3*T3a1*T3a1+3*T3a1*T3a1*T3a1
T3c3=-6*T3a1*T3a1-3*T3a1-3*T3a1*T3a1*T3a1
T3c4=1+3*T3a1+T3a1*T3a1*T3a1+3*T3a1*T3a1
T3=T3c1*T3e6+T3c2*T3e5+T3c3*T3e4+T3c4*T3e3
MAvg=T3
Pmax_Func(rsi,length)=>
longStop = MAvg - Multiplier*atr
longStopPrev = nz(longStop[1], longStop)
longStop := MAvg > longStopPrev ? max(longStop, longStopPrev) : longStop
shortStop = MAvg + Multiplier*atr
shortStopPrev = nz(shortStop[1], shortStop)
shortStop := MAvg < shortStopPrev ? min(shortStop, shortStopPrev) : shortStop
dir = 1
dir := nz(dir[1], dir)
dir := dir == -1 and MAvg > shortStopPrev ? 1 : dir == 1 and MAvg < longStopPrev ? -1 : dir
PMax = dir==1 ? longStop: shortStop
PMax=Pmax_Func(rsi,length)
plot(showsupport ? MAvg : na, color=color.black, linewidth=2, title="T3")
pALL=plot(PMax, color=color.red, linewidth=2, title="PMax", transp=0)
alertcondition(cross(MAvg, PMax), title="Cross Alert", message="PMax - Moving Avg Crossing!")
alertcondition(crossover(MAvg, PMax), title="Crossover Alarm", message="Moving Avg BUY SIGNAL!")
alertcondition(crossunder(MAvg, PMax), title="Crossunder Alarm", message="Moving Avg SELL SIGNAL!")
alertcondition(cross(src, PMax), title="Price Cross Alert", message="PMax - Price Crossing!")
alertcondition(crossover(src, PMax), title="Price Crossover Alarm", message="PRICE OVER PMax - BUY SIGNAL!")
alertcondition(crossunder(src, PMax), title="Price Crossunder Alarm", message="PRICE UNDER PMax - SELL SIGNAL!")
buySignalk = crossover(MAvg, PMax)
plotshape(buySignalk and showsignalsk ? PMax*0.995 : na, title="Buy", text="Buy", location=location.absolute, style=shape.labelup, size=size.tiny, color=color.green, textcolor=color.white, transp=0)
sellSignallk = crossunder(MAvg, PMax)
plotshape(sellSignallk and showsignalsk ? PMax*1.005 : na, title="Sell", text="Sell", location=location.absolute, style=shape.labeldown, size=size.tiny, color=color.red, textcolor=color.white, transp=0)
mPlot = plot(rsi, title="", style=plot.style_circles, linewidth=0,display=display.none)
longFillColor = highlighting ? (MAvg>PMax ? color.green : na) : na
shortFillColor = highlighting ? (MAvg<PMax ? color.red : na) : na
fill(mPlot, pALL, title="UpTrend Highligter", color=longFillColor)
fill(mPlot, pALL, title="DownTrend Highligter", color=shortFillColor)
dummy0 = input(true, title = "=Backtest Inputs=")
FromDay = input(defval = 1, title = "From Day", minval = 1, maxval = 31)
FromMonth = input(defval = 1, title = "From Month", minval = 1, maxval = 12)
FromYear = input(defval = 2005, title = "From Year", minval = 2005)
ToDay = input(defval = 1, title = "To Day", minval = 1, maxval = 31)
ToMonth = input(defval = 1, title = "To Month", minval = 1, maxval = 12)
ToYear = input(defval = 9999, title = "To Year", minval = 2006)
Start = timestamp(FromYear, FromMonth, FromDay, 00, 00)
Finish = timestamp(ToYear, ToMonth, ToDay, 23, 59)
Timerange() =>
time >= Start and time <= Finish ? true : false
if buySignalk
strategy.entry("Long", strategy.long,when=Timerange())
if sellSignallk
strategy.entry("Short", strategy.short,when=Timerange())