Zeitrahmenübergreifende Super-Trend-Shock-Breakout-Strategie
Überblick
Die Strategie kombiniert die Supertrend-Indikatoren mit den Bollinger Bands in mehreren Zeitrahmen, identifiziert die Trendrichtung und die wichtigen Unterstützungswiderstände, führt bei einem Schwingungsbruch Entries durch und basiert auf Cross-Exit-Positionen. Die Strategie gilt hauptsächlich für hochflüchtige Warenfutures wie Gold, Silber, Rohöl usw.
Strategieprinzip
Eine benutzerdefinierte Multi-Time-Frame-Supertrend-Funktion basierend auf Pine Script.pine_supertrend(), Supertrends in Kombination mit unterschiedlichen Perioden (z. B. 1 Minute und 5 Minuten), um die Richtung der Großzyklustrends zu bestimmen.
Gleichzeitig wird der Bolling-Band-Abstieg berechnet, um einen Kanalbruch zu beurteilen. Wenn der Preis den Bolling-Band-Abstieg überschreitet, gilt er als Bolling-Bruch; wenn der Preis den Bolling-Band-Abstieg überschreitet, gilt er als Beobachtungsbruch.
Strategische Signale:
Mehrköpfige Signale: Kurzschluss > Brin-Band auf Kurs und Kurzschluss > Mehrzeitrahmen-Supertrend-Indikator Leerlaufsignal: Abschlusspreis < Brin-Band-Abtrieb und Abschlusspreis < Multiple-Zeitrahmen-Supertrend-Indikator
Verlustbegrenzung:
Mehrköpfige Stop-Loss: Schlusskurs < 5 Minuten Supertrend-Indikator Leerstand: Schlusskurs > 5 Minuten Supertrendindikator
Die Strategie erfasst daher Resonanzbrüche zwischen dem Supertrend-Indikator und dem Brin-Band-Indikator, um die Transaktionen in einem hochschwankenden Umfeld zu verarbeiten.
Analyse der Stärken
- Die Verwendung von Multi-Time-Frame-Supertrend-Indikatoren zur Bestimmung der Richtung der Großzyklus-Trends zur Verbesserung der Signalqualität
- Brin-Band auf und ab als wichtige Stützungswiderstandsposition, um falsche Durchbrüche zu reduzieren
- Supertrend-Indikatoren als Stop-Loss, Verlustreduzierung und Risikokontrolle
Risikoanalyse
- Der Supertrend-Indikator ist nachlässig und könnte einen Trendwendepunkt verpassen.
- Fehlende Einstellungen der Brin-Band-Parameter können zu häufigen oder zu leeren Trades führen
- Bei Commodity-Futures, bei denen die Preise nachts oder bei einem großen Ereignis stark schwanken und leicht verlieren
Die Risiken können auf folgende Weise gelöst werden:
- Mit Hilfe von mehreren Hilfssignal-Bestätigungssignalen verhindert man falsche Durchbrüche.
- Optimierung der Brin-Band-Parameter und Suche nach dem optimalen Gleichgewicht
- Anpassung der Stop-Position, Erweiterung der Stop-Distanz
Optimierungsrichtung
- Versuchen Sie, andere Trendindikatoren wie KDJ, MACD und andere als Hilfsmittel zu verwenden
- Erhöhung der Wahrscheinlichkeit von Urteilen durch Machine-Learning-Modelle
- Parameteroptimierung, um die optimale Kombination von Hyperparametern zu finden
Zusammenfassen
Die Strategie integriert Supertrends mit zwei hocheffizienten Indikatoren der Brin-Band und ermöglicht ein hohes Probabilitätsspiel durch Analyse über Zeiträume und Durchbruch von Kanälen. Die Strategie steuert das Kapitalrisiko effektiv und bestätigt, dass bei hochflüchtigen Sorten bessere Erträge erzielt werden können. Die Wirksamkeit der Strategie kann durch weitere Optimierung und Kombination von INDICATORS verbessert werden.
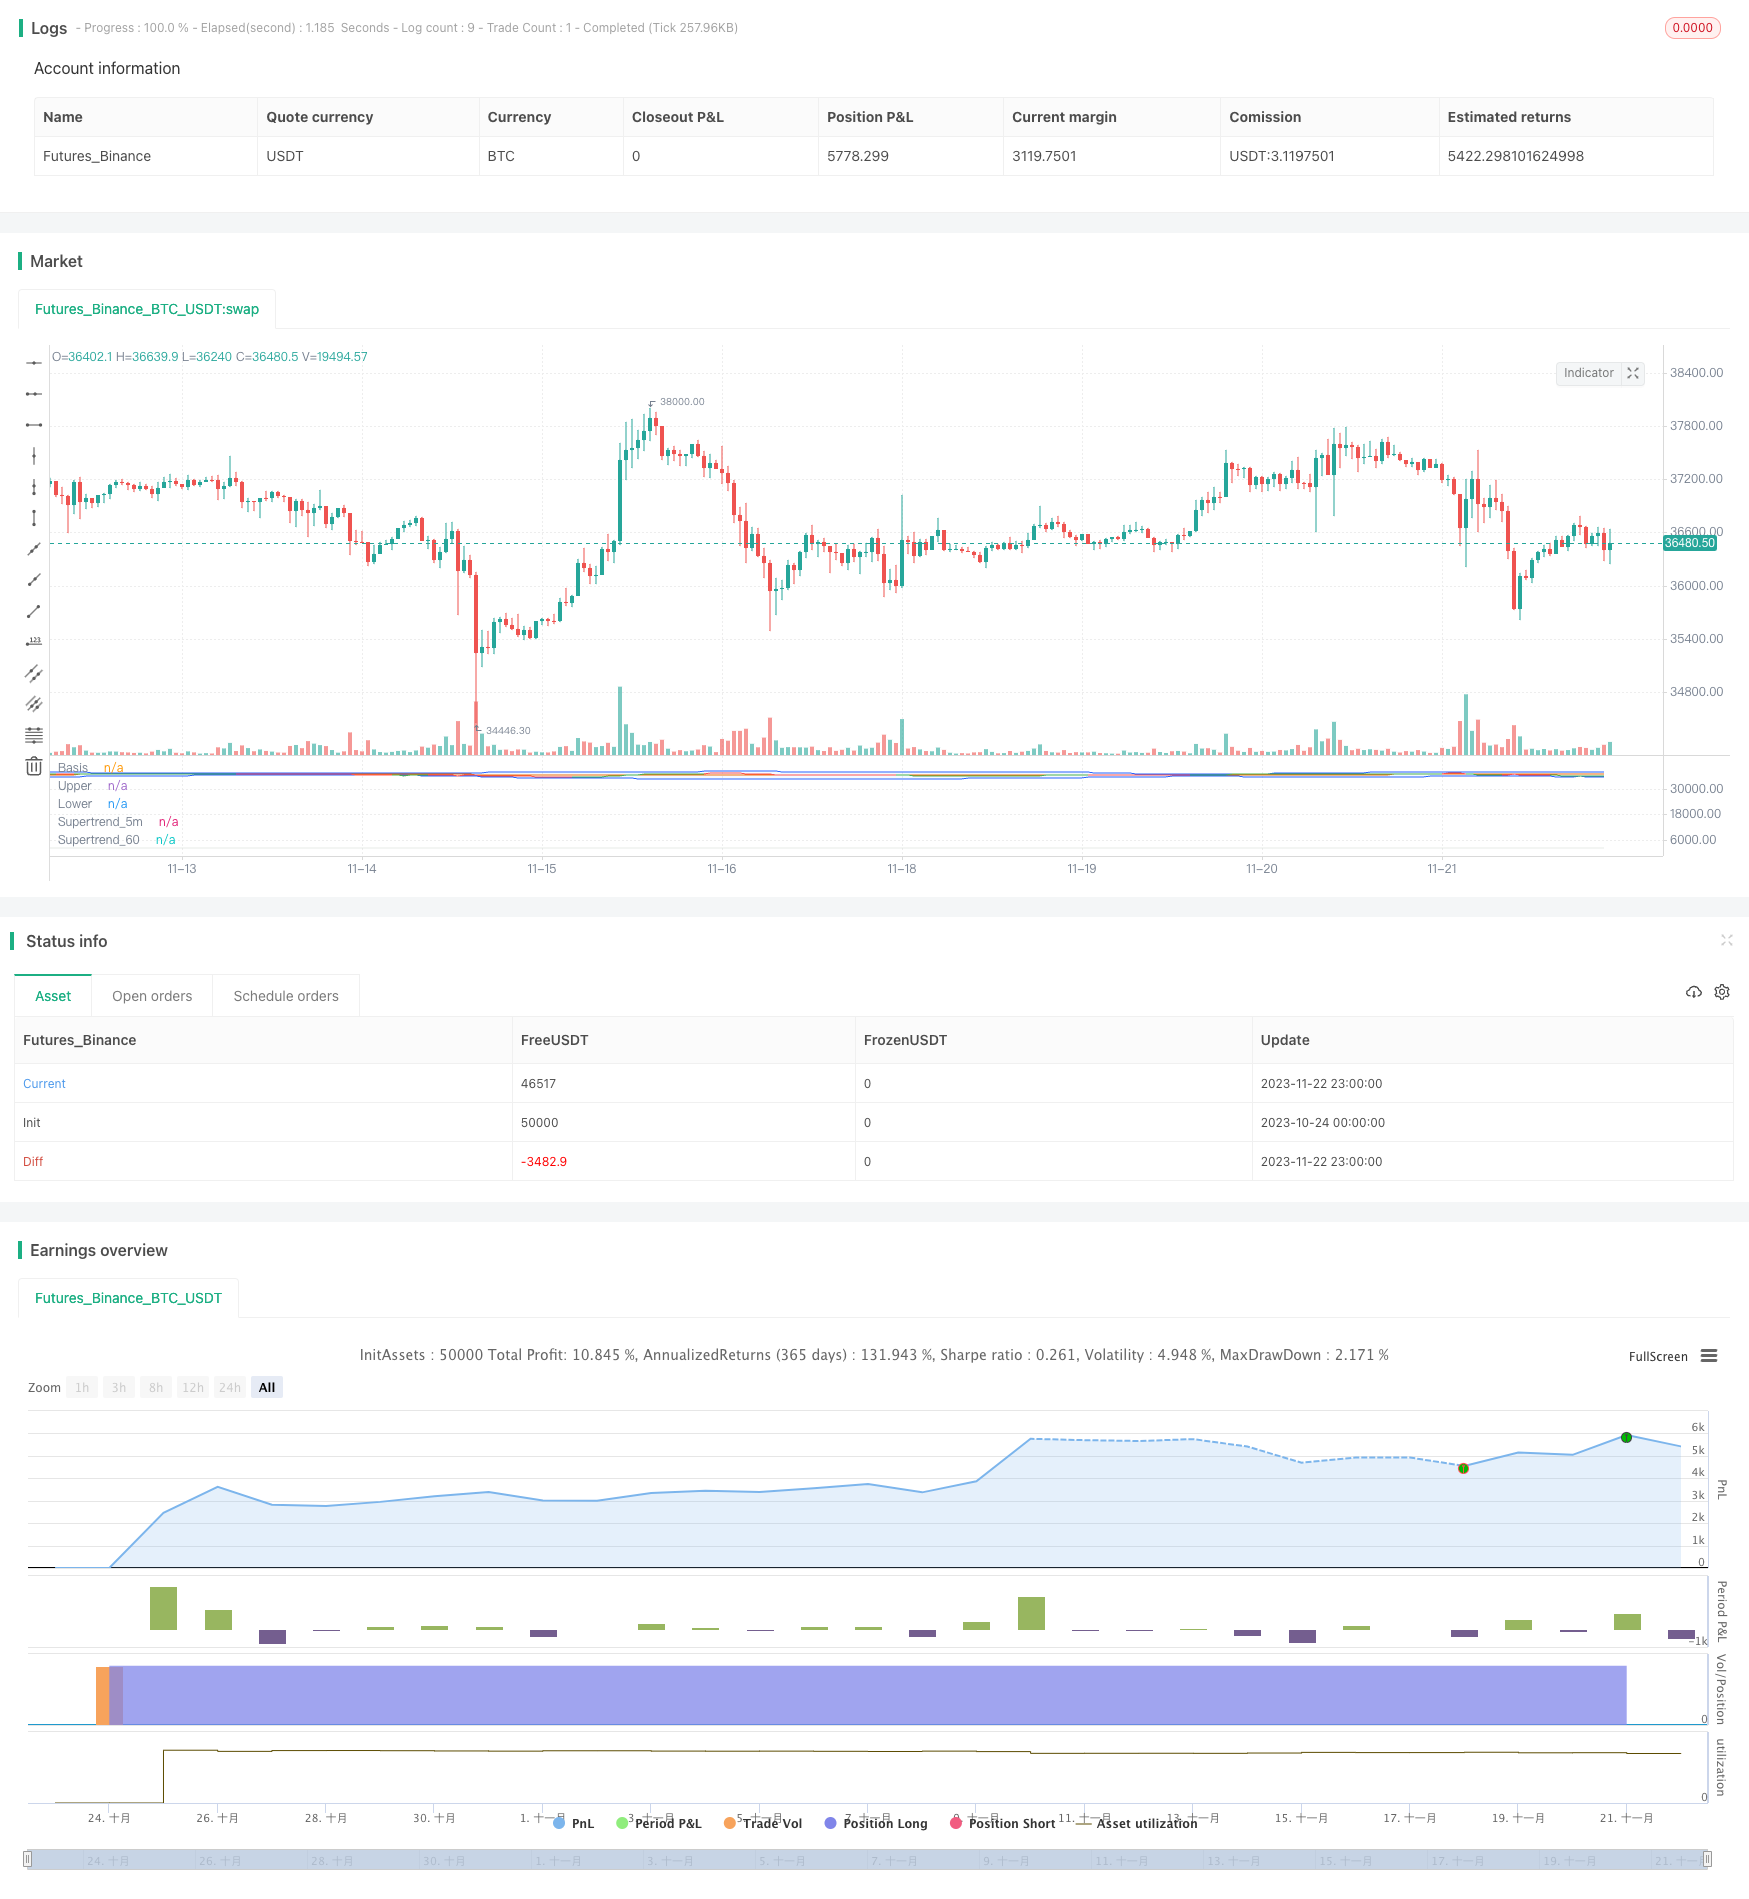
/*backtest
start: 2023-10-24 00:00:00
end: 2023-11-23 00:00:00
period: 1h
basePeriod: 15m
exchanges: [{"eid":"Futures_Binance","currency":"BTC_USDT"}]
*/

// This source code is subject to the terms of the Mozilla Public License 2.0 at https://mozilla.org/MPL/2.0/
// © ambreshc95

//@version=5
strategy("Comodity_SPL_Strategy_01", overlay=false)

// function of st
// [supertrend, direction] = ta.supertrend(3, 10)
// plot(direction < 0 ? supertrend : na, "Up direction", color = color.green, style=plot.style_linebr)
// plot(direction > 0 ? supertrend : na, "Down direction", color = color.red, style=plot.style_linebr)

// VWAP
// src_vwap = input(title = "Source", defval = hlc3, group="VWAP Settings")
// [_Vwap,stdv,_] = ta.vwap(src_vwap,false,1)
// plot(_Vwap, title="VWAP", color = color.rgb(0, 0, 0))


// The same on Pine Script®
pine_supertrend(factor, atrPeriod,len_ma) =>

    h= ta.sma(high,len_ma)
    l= ta.sma(low,len_ma)
    hlc_3 = (h+l)/2
    src = hlc_3
    atr = ta.atr(atrPeriod)
    upperBand = src + factor * atr
    lowerBand = src - factor * atr
    prevLowerBand = nz(lowerBand[1])
    prevUpperBand = nz(upperBand[1])

    lowerBand := lowerBand > prevLowerBand or close[1] < prevLowerBand ? lowerBand : prevLowerBand
    upperBand := upperBand < prevUpperBand or close[1] > prevUpperBand ? upperBand : prevUpperBand
    int direction = na
    float superTrend = na
    prevSuperTrend = superTrend[1]
    if na(atr[1])
        direction := 1
    else if prevSuperTrend == prevUpperBand
        direction := close > upperBand ? -1 : 1
    else
        direction := close < lowerBand ? 1 : -1
    superTrend := direction == -1 ? lowerBand : upperBand
    [superTrend, direction]
len_ma_given = input(75, title="MA_SMA_ST")
[Pine_Supertrend, pineDirection] = pine_supertrend(3, 10,len_ma_given)
// plot(pineDirection < 0 ? Pine_Supertrend : na, "Up direction", color = color.green, style=plot.style_linebr)
// plot(pineDirection > 0 ? Pine_Supertrend : na, "Down direction", color = color.red, style=plot.style_linebr)
//
// Define Supertrend parameters
atrLength = input(10, title="ATR Length")
factor = input(3.0, title="Factor")

// // Calculate Supertrend
[supertrend, direction] = ta.supertrend(factor, atrLength)

st_color = supertrend > close ? color.red : color.green
// // Plot Supertrend
// plot(supertrend, "Supertrend", st_color)
//

// BB Ploting
length = input.int(75, minval=1)
maType = input.string("SMA", "Basis MA Type", options = ["SMA", "EMA", "SMMA (RMA)", "WMA", "VWMA"])
src = input(close, title="Source")
mult = input.float(2.5, minval=0.001, maxval=50, title="StdDev")

ma(source, length, _type) =>
    switch _type
        "SMA" => ta.sma(source, length)
        "EMA" => ta.ema(source, length)
        "SMMA (RMA)" => ta.rma(source, length)
        "WMA" => ta.wma(source, length)
        "VWMA" => ta.vwma(source, length)

basis = ma(src, length, maType)
dev = mult * ta.stdev(src, length)
upper = basis + dev
lower = basis - dev
offset = input.int(0, "Offset", minval = -500, maxval = 500)
plot(basis, "Basis", color=#FF6D00, offset = offset)
p1 = plot(upper, "Upper", color=#2962FF, offset = offset)
p2 = plot(lower, "Lower", color=#2962FF, offset = offset)
fill(p1, p2, title = "Background", color=color.rgb(33, 150, 243, 95))


// h= ta.sma(high,60)
// l= ta.sma(low,60)
// c= sma(close,60)
// hlc_3 = (h+l)/2
// supertrend60 = request.security(syminfo.tickerid,  supertrend)

// // Define timeframes for signals
tf1 = input(title="Timeframe 1", defval="1")
tf2 = input(title="Timeframe 2",defval="5")
// tf3 = input(title="Timeframe 3",defval="30")


// // // Calculate Supertrend on multiple timeframes
supertrend_60 = request.security(syminfo.tickerid, tf1, Pine_Supertrend)
supertrend_5m = request.security(syminfo.tickerid, tf2, supertrend)
// supertrend3 = request.security(syminfo.tickerid, tf3, supertrend)

// // Plot Supertrend_60
st_color_60 = supertrend_60 > close ? color.rgb(210, 202, 202, 69) : color.rgb(203, 211, 203, 52)
plot(supertrend_60, "Supertrend_60", st_color_60)

// // Plot Supertrend_5m
st_color_5m = supertrend_5m > close ? color.red : color.green
plot(supertrend_5m, "Supertrend_5m", st_color_5m)


ma21 = ta.sma(close,21)
// rsi = ta.rsi(close,14)
// rsima = ta.sma(rsi,14)

// Define the Indian Standard Time (IST) offset from GMT
ist_offset = 5.5 // IST is GMT+5:30

// Define the start and end times of the trading session in IST
// start_time = timestamp("GMT", year, month, dayofmonth, 10, 0) + ist_offset * 60 * 60
// end_time = timestamp("GMT", year, month, dayofmonth, 14, 0) + ist_offset * 60 * 60
// Check if the current time is within the trading session
// in_trading_session = timenow >= start_time and timenow <= end_time

in_trading_session = not na(time(timeframe.period, "0945-1430"))
// bgcolor(inSession ? color.silver : na)
out_trading_session = not na(time(timeframe.period, "1515-1530"))
// // // Define buy and sell signals
buySignal = close>upper and close > supertrend_5m and close > supertrend_60 and close > ma21  and in_trading_session //close > supertrend and
sellSignal = close<lower and close < supertrend_5m and close < supertrend_60 and close < ma21  and in_trading_session //close < supertrend and

var bool long_position = false
var bool long_exit = false
var float long_entry_price = 0
var float short_entry_price = 0

if buySignal and not long_position
    // label.new(bar_index, na, yloc = yloc.belowbar, style = label.style_label_up, color = color.green, size = size.small)
    long_position := true
    strategy.entry("Buy",strategy.long)

long_exit := (close < supertrend_5m)
if long_position and long_exit
    // label.new(bar_index, na, yloc = yloc.belowbar, style = label.style_xcross, color = color.green, size = size.tiny)
    long_position := false
    strategy.exit("Exit","Buy",stop = close)

var bool short_position = false
var bool short_exit = false
if sellSignal and not short_position
    // label.new(bar_index, na, yloc = yloc.abovebar, style = label.style_label_down, color = color.red, size = size.small)
    short_position := true
    strategy.entry("Sell",strategy.short)

short_exit := (close > supertrend_5m)
if short_position and short_exit
    // label.new(bar_index, na, yloc = yloc.belowbar, style = label.style_xcross, color = color.red, size = size.tiny)
    short_position := false
    strategy.exit("Exit","Sell", stop = close)

if out_trading_session
    long_position := false
    strategy.exit("Exit","Buy",stop = close)
    short_position := false
    strategy.exit("Exit","Sell", stop = close)

// if long_position
//     long_entry_price := close[1] + 50//bar_index

// if short_position
//     short_entry_price := close[1] - 50//bar_index

// if (long_position and high[1] > long_entry_price)
//     label.new(bar_index, na, yloc = yloc.abovebar, style = label.style_triangledown, color = color.yellow, size = size.tiny)

// if (short_position and low[1] < short_entry_price)
//     label.new(bar_index, na, yloc = yloc.belowbar, style = label.style_triangleup, color = color.yellow, size = size.tiny)