
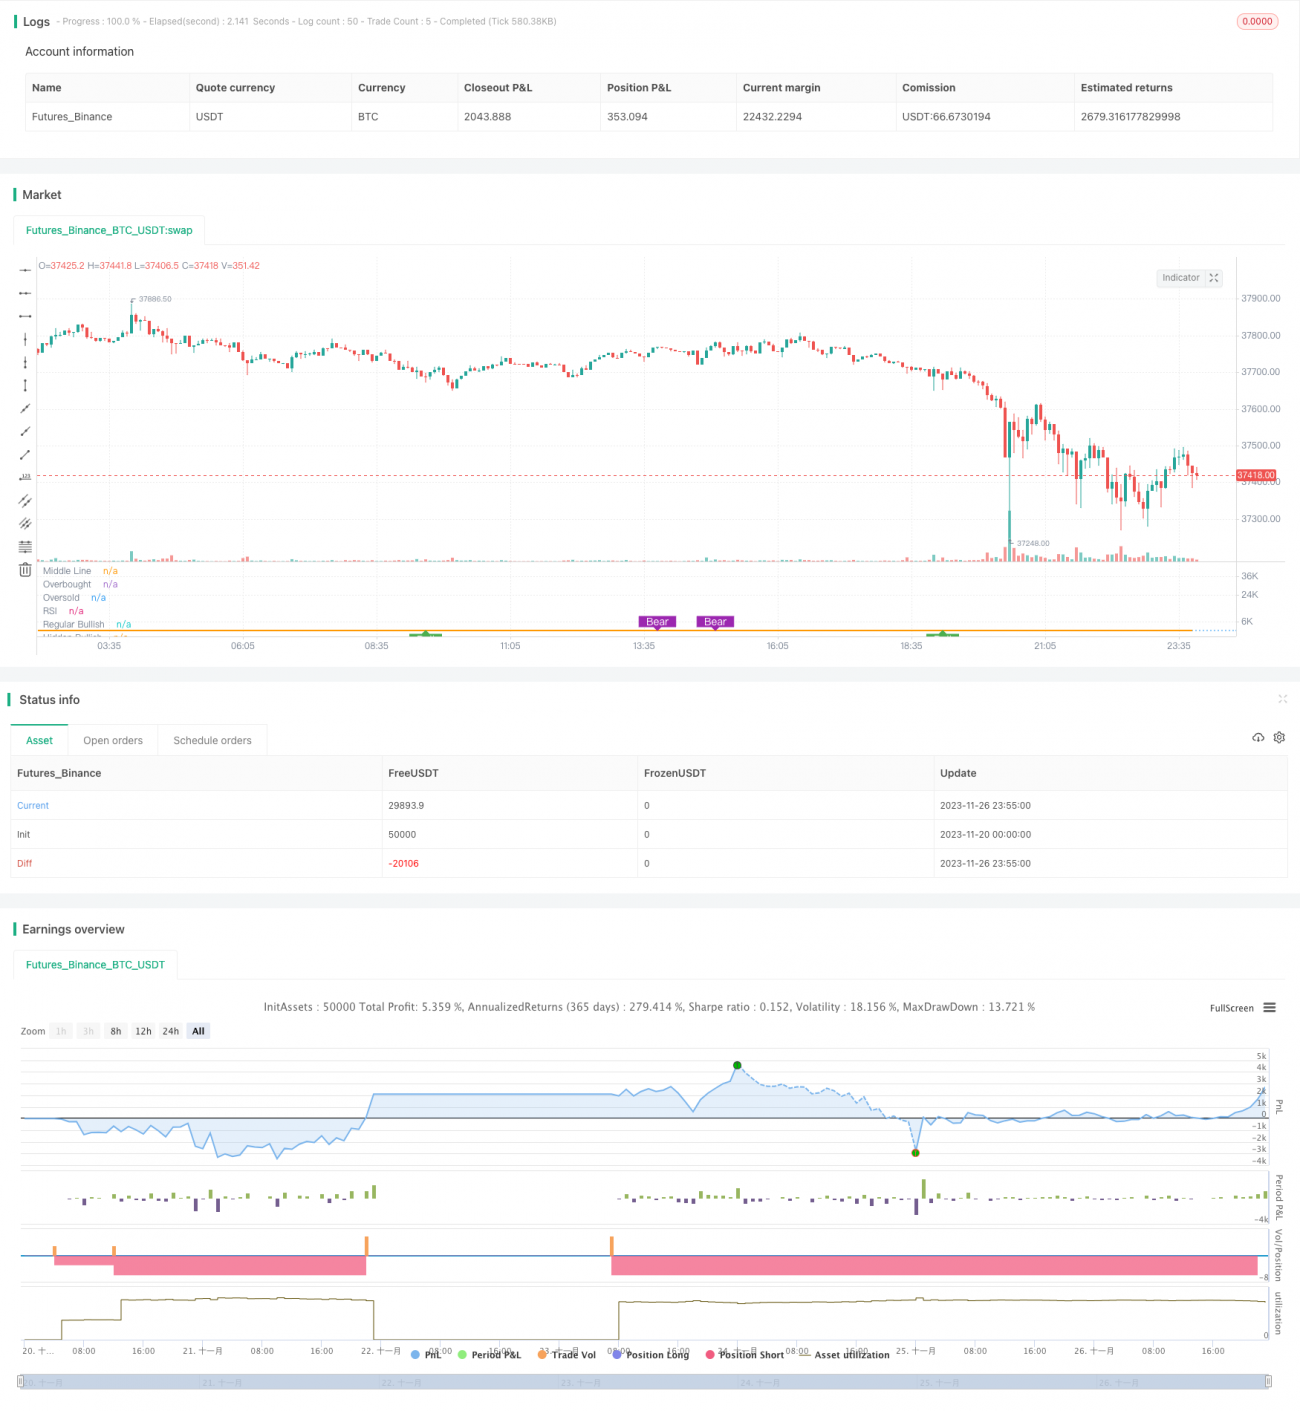
Die Pivot-Based RSI Divergence Strategy verwendet die RSI-Indikatoren, um die Kauf- und Verkaufspunkte in verschiedenen Perioden zu bestimmen. Auf dieser Grundlage wird der langfristige RSI als Filterbedingungen hinzugefügt, um die Stabilität der Strategie zu verbessern.
Die Strategie beurteilt hauptsächlich den kurzen RSI (z. B. der 5-Tage-RSI) und die Gelegenheit zum Kauf, wenn der Preis mit einem versteckten Multi-Head-Back-off-Rumpf oder einem normalen Multi-Head-Back-off-Rumpf konfrontiert ist. Die Gelegenheit zum Verkauf, wenn ein versteckter Multi-Head-Back-off-Rumpf oder ein normaler Multi-Head-Back-off-Rumpf konfrontiert ist.
Der sogenannte “regelmäßige” Mehrkopf-Abweichungs-Abweichungs-Abweichungs-Abweichungs-Abweichungs-Abweichungs-Abweichungs-Abweichungs-Abweichungs-Abweichungs-Abweichungs-Abweichungs-Abweichungs-Abweichungs-Abweichungs-Abweichungs-Abweichungs-Abweichungs-Abweichungs-Abweichungs-Abweichungs-Abweichungs-Abweichungs-Abweichungs-Abweichungs-Abweichungs-Abweichungs-Abweichungs-Abweichungs-Abweichungs-Abweichungs-Abweichungs-Abweichungs-Abweichungs-Abweichungs-Abweichungs-Abweichungs-Abweichungs-Abweichungs-Abweichungs-Abweichungs-Abweichungs-Abweichungs-Abweichungs-Abweichungs-Abweichungs-Abweichungs-Abweichungs-A
Darüber hinaus führt die Strategie einen langen RSI (z. B. der 50-Tage-RSI) als Filterbedingungen ein. Ein Kaufsignal wird nur dann berücksichtigt, wenn der langen RSI größer als 50 ist. Ein Stop-Loss oder ein Stop-Out wird berücksichtigt, wenn der langen RSI kleiner als 30 ist.
Der größte Vorteil dieser Strategie besteht darin, dass die Abweichsignale des kurzen RSI und die Filterung des langen RSI gleichzeitig genutzt werden können, um zu einem gewissen Grad zu vermeiden, dass sie ausgesetzt und verpasst werden. Insbesondere haben sie folgende Vorteile:
Die Strategie birgt auch einige Risiken, die beachtet werden müssen:
Die entsprechenden Risikomanagement-Maßnahmen umfassen: vernünftige Einstellung von Stop-Loss-Beschränkungen, Kontrolle der Größe der einzelnen Positionen, schrittweise Verringerung der Position, um die Verlustkurve zu glätten.
Die Strategie kann noch weiter optimiert werden:
Die Strategie verwendet die kombinierte Verwendung von Short- und Long-RSI-Multiple-Signal-Abweichungen, um Risiken zu kontrollieren und gleichzeitig die Gewinn-Effizienz zu verbessern. Sie enthält mehrere Prinzipien für die Konzeption von Quantitative Trading-Strategien, einschließlich der Zeit des Eintritts und des Ausstiegs, der Bündelung von Positionen und der Einstellung von Stop-Loss-Sperren.
/*backtest
start: 2023-11-20 00:00:00
end: 2023-11-27 00:00:00
period: 5m
basePeriod: 1m
exchanges: [{"eid":"Futures_Binance","currency":"BTC_USDT"}]
*/
// This source code is subject to the terms of the Mozilla Public License 2.0 at https://mozilla.org/MPL/2.0/
// © mohanee
//@version=4
//GOOGL setting 5 ,50 close, 3 , 1 profitLevel at 75 and No stop Loss shows win rate 99.03 % profit factor 5830.152
strategy(title="RSI5_50 with Divergence", overlay=false,pyramiding=2, default_qty_type=strategy.fixed, default_qty_value=3, initial_capital=10000, currency=currency.USD)
len = input(title="RSI Period", minval=1, defval=5)
longRSILen = input(title="Long RSI Period", minval=10, defval=50)
src = input(title="RSI Source", defval=close)
lbR = input(title="Pivot Lookback Right", defval=3)
lbL = input(title="Pivot Lookback Left", defval=1)
takeProfitRSILevel = input(title="Take Profit at RSI Level", minval=50, defval=75)
stopLoss = input(title="Stop Loss%(if checked 8% rule applied)", defval=false)
shortTermRSI = rsi(close,len)
longTermRSI = rsi(close,longRSILen)
rangeUpper = input(title="Max of Lookback Range", defval=60)
rangeLower = input(title="Min of Lookback Range", defval=5)
plotBull = input(title="Plot Bullish", defval=true)
plotHiddenBull = input(title="Plot Hidden Bullish", defval=true)
plotBear = input(title="Plot Bearish", defval=true)
plotHiddenBear = input(title="Plot Hidden Bearish", defval=false)
bearColor = color.purple
bullColor = color.green
hiddenBullColor = color.new(color.green, 80)
hiddenBearColor = color.new(color.red, 80)
textColor = color.white
noneColor = color.new(color.white, 100)
plot(shortTermRSI, title="RSI", linewidth=2, color=#8D1699)
plot(longTermRSI, title="longTermRSI", linewidth=2, color=color.orange)
hline(50, title="Middle Line", linestyle=hline.style_dotted)
obLevel = hline(70, title="Overbought", linestyle=hline.style_dotted)
osLevel = hline(30, title="Oversold", linestyle=hline.style_dotted)
fill(obLevel, osLevel, title="Background", color=longTermRSI >=50 ? color.green:color.purple, transp=65) // longTermRSI >=50
plFound = na(pivotlow(shortTermRSI, lbL, lbR)) ? false : true
phFound = na(pivothigh(shortTermRSI, lbL, lbR)) ? false : true
_inRange(cond) =>
bars = barssince(cond == true)
rangeLower <= bars and bars <= rangeUpper
//------------------------------------------------------------------------------
// Regular Bullish
// shortTermRSI: Higher Low
oscHL = shortTermRSI[lbR] > valuewhen(plFound, shortTermRSI[lbR], 1) and _inRange(plFound[1])
// Price: Lower Low
priceLL = low[lbR] < valuewhen(plFound, low[lbR], 1)
bullCond = plotBull and priceLL and oscHL and plFound
plot(
plFound ? shortTermRSI[lbR] : na,
offset=-lbR,
title="Regular Bullish",
linewidth=2,
color=(bullCond ? bullColor : noneColor),
transp=0
)
plotshape(
bullCond ? shortTermRSI[lbR] : na,
offset=-lbR,
title="Regular Bullish Label",
text=" Bull ",
style=shape.labelup,
location=location.absolute,
color=bullColor,
textcolor=textColor,
transp=0
)
//------------------------------------------------------------------------------
// Hidden Bullish
// shortTermRSI: Lower Low
oscLL = shortTermRSI[lbR] < valuewhen(plFound, shortTermRSI[lbR], 1) and _inRange(plFound[1])
// Price: Higher Low
priceHL = low[lbR] > valuewhen(plFound, low[lbR], 1)
hiddenBullCond = plotHiddenBull and priceHL and oscLL and plFound
plot(
plFound ? shortTermRSI[lbR] : na,
offset=-lbR,
title="Hidden Bullish",
linewidth=2,
color=(hiddenBullCond ? hiddenBullColor : noneColor),
transp=0
)
plotshape(
hiddenBullCond ? shortTermRSI[lbR] : na,
offset=-lbR,
title="Hidden Bullish Label",
text=" H Bull ",
style=shape.labelup,
location=location.absolute,
color=bullColor,
textcolor=textColor,
transp=0
)
longCondition= longTermRSI >=50 and ( (bullCond or hiddenBullCond ) ) or (strategy.position_size>0 and crossover(shortTermRSI,20) )
//last condition above is to leg in if you are already in the Long trade,
strategy.entry(id="RSIDivLE", long=true, when=longCondition)
//------------------------------------------------------------------------------
// Regular Bearish
// shortTermRSI: Lower High
oscLH = shortTermRSI[lbR] < valuewhen(phFound, shortTermRSI[lbR], 1) and _inRange(phFound[1])
// Price: Higher High
priceHH = high[lbR] > valuewhen(phFound, high[lbR], 1)
bearCond = plotBear and priceHH and oscLH and phFound
plot(
phFound ? shortTermRSI[lbR] : na,
offset=-lbR,
title="Regular Bearish",
linewidth=2,
color=(bearCond ? bearColor : noneColor),
transp=0
)
plotshape(
bearCond ? shortTermRSI[lbR] : na,
offset=-lbR,
title="Regular Bearish Label",
text=" Bear ",
style=shape.labeldown,
location=location.absolute,
color=bearColor,
textcolor=textColor,
transp=0
)
//------------------------------------------------------------------------------
// Hidden Bearish
// shortTermRSI: Higher High
oscHH = shortTermRSI[lbR] > valuewhen(phFound, shortTermRSI[lbR], 1) and _inRange(phFound[1])
// Price: Lower High
priceLH = high[lbR] < valuewhen(phFound, high[lbR], 1)
hiddenBearCond = plotHiddenBear and priceLH and oscHH and phFound
plot(
phFound ? shortTermRSI[lbR] : na,
offset=-lbR,
title="Hidden Bearish",
linewidth=2,
color=(hiddenBearCond ? hiddenBearColor : noneColor),
transp=0
)
plotshape(
hiddenBearCond ? shortTermRSI[lbR] : na,
offset=-lbR,
title="Hidden Bearish Label",
text=" H Bear ",
style=shape.labeldown,
location=location.absolute,
color=bearColor,
textcolor=textColor,
transp=0
)
//calculate stop Loss
stopLossVal = stopLoss==true ? ( strategy.position_avg_price - (strategy.position_avg_price*0.08) ) : 0
//partial profit
strategy.close(id="RSIDivLE", comment="TP1", qty=strategy.position_size*3/4, when=strategy.position_size>0 and (longTermRSI>=takeProfitRSILevel or crossover(longTermRSI,90)))
strategy.close(id="RSIDivLE",comment="TP2", qty=strategy.position_size*3/4 , when=crossover(longTermRSI,70))
strategy.close(id="RSIDivLE",comment="TP3", qty=strategy.position_size/2, when=crossover(longTermRSI,65))
strategy.close(id="RSIDivLE",comment="TP4", qty=strategy.position_size/2 , when=crossover(longTermRSI,60))
//close the whole position when stoploss hits or longTermRSI goes below 30
strategy.close(id="RSIDivLE",comment="Exit", when=crossunder(longTermRSI,30) or close<stopLossVal)