Trendfolgestrategie basierend auf EMA und ATR Stop-Loss

Überblick
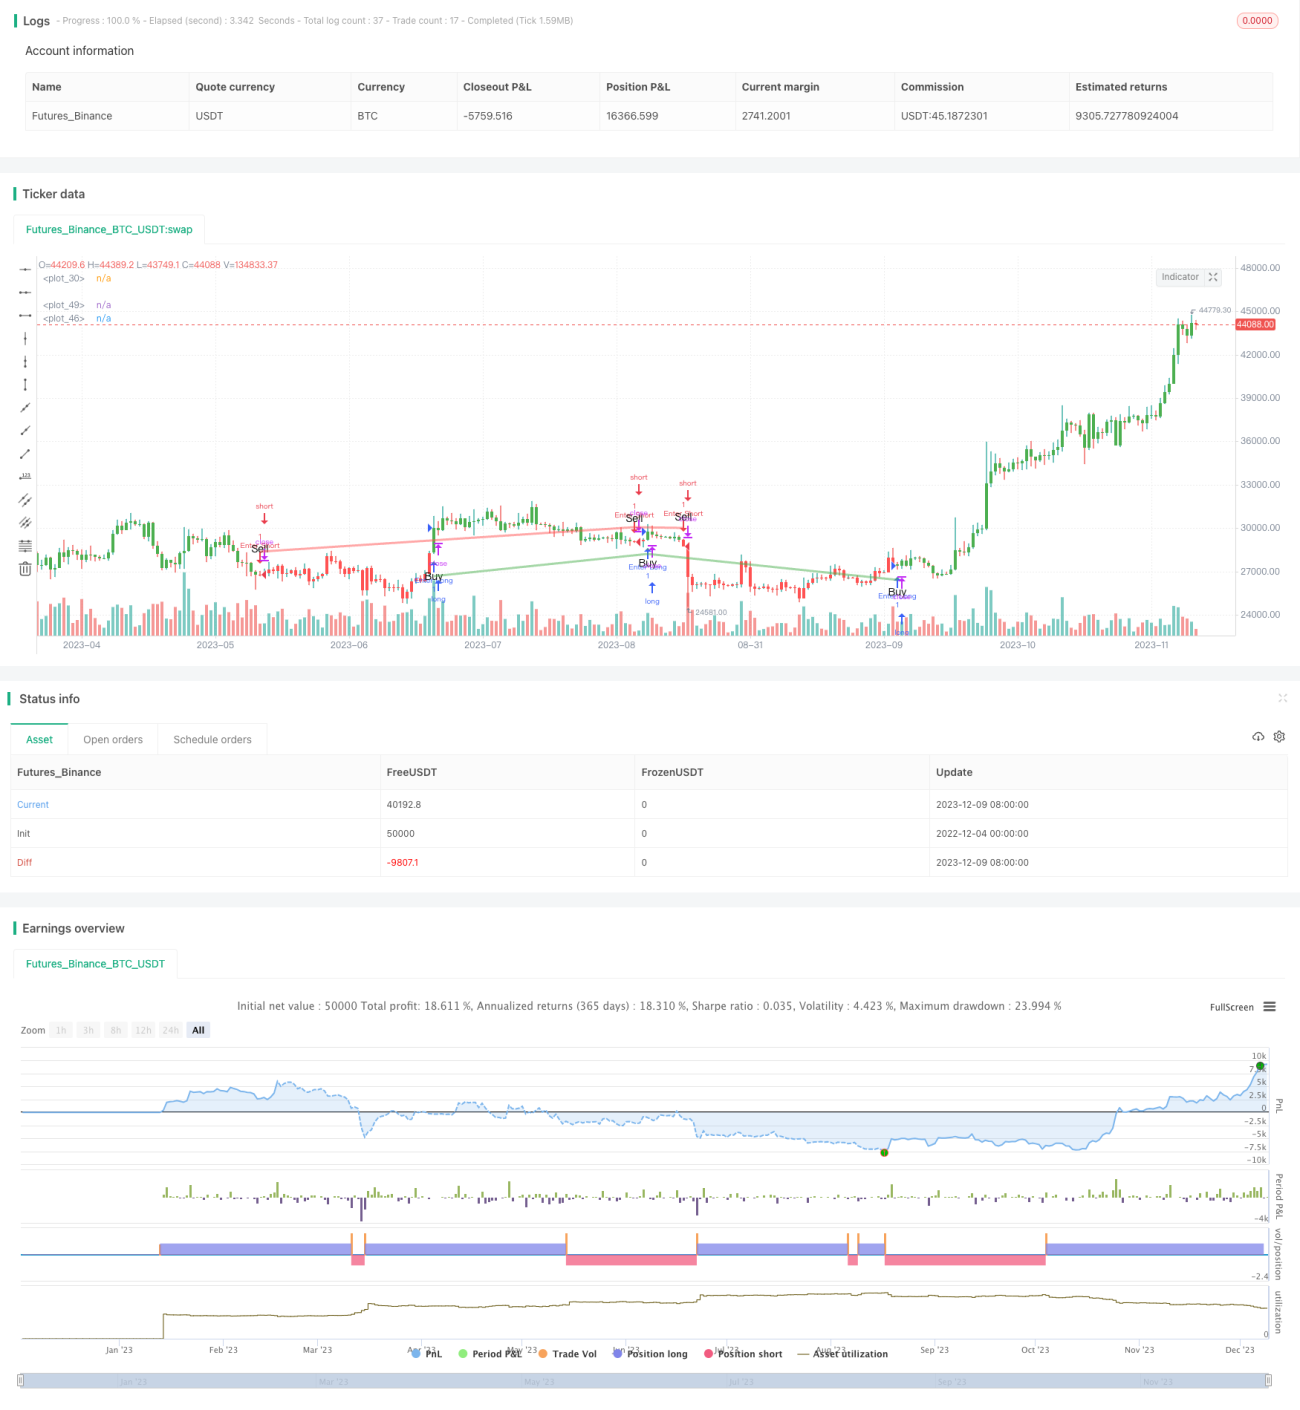
Die Strategie verwendet die EMA-Evenline golden cross, um ein Handelssignal zu erzeugen, das ein Kaufsignal erzeugt, wenn die schnelle EMA-Linie die langsame EMA-Linie durchquert, und ein Verkaufssignal erzeugt, wenn die schnelle EMA-Linie die langsame EMA-Linie durchquert. Die Strategie gehört zu einer typischen Trendverfolgungsstrategie. Die Strategie nutzt gleichzeitig die ATR-Anzeige, um einen dynamischen Stop-Loss-Bereich einzurichten und gleichzeitig das Risiko zu kontrollieren, um einen Gewinn zu garantieren.
Strategieprinzip
- Die definierte schnelle EMA-Durchschnittsphase beträgt 13, die langsame EMA-Durchschnittsphase beträgt 48.
- Wenn eine schnelle EMA-Linie eine langsame EMA-Linie durchbricht, erzeugt sie ein Kaufsignal; wenn eine schnelle EMA-Linie unter einer langsamen EMA-Linie durchbricht, erzeugt sie ein Verkaufsignal.
- Durch die Funktionen ta.crossover und ta.crossunder wird die Gleichgewichtsforke beurteilt.
- Der dynamische Stop-Loss wird mit dem ATR-Wert berechnet.
- Die Handelssignale und die Stop-Loss-Position werden durch Farbänderungen, Kauf- und Verkaufsmarkierungen und Stop-Lines visuell angezeigt.
Strategische Stärkenanalyse
- Goldfork-Deadforks basierend auf EMA-Grenzen erzeugen Signale, um wichtige Markttrends nicht zu verpassen, und erzielen erhebliche Gewinne.
- ATR Dynamic Tracking Stops, die sowohl eine ausreichende Ertragslage als auch ein kontrolliertes Rücknahmerisiko gewährleisten und ein ausgewogenes Risiko-Gewinn-Gesamtverhältnis erzielen.
- Die intuitive Anzeige von Signalen und Verlustdämpfungen ist einfach zu bedienen und für die meisten Menschen geeignet.
- Weniger anpassbare Parameter, leicht zu beherrschen und zu optimieren.
Strategische Risikoanalyse
- Ein plötzlicher Sturz kann zu einem Stillstand führen.
- Bei Erschütterungen können häufige, unwirksame Signale erzeugt werden.
- Die falsche Einstellung der Parameter kann zu einem zu starken Einstieg in das Feld oder zu einer zu lockeren Stop-Loss führen.
- Die EMA- und ATR-Parameter müssen entsprechend optimiert werden.
Die Lösung:
- Der ATR-Prozent kann entsprechend gelockert werden, um sicherzustellen, dass der Stop-Loss gegenüber dem jüngsten Hoch auf eine gewisse Dämpfung eingestellt wird.
- Ein Bestätigungsmechanismus nach dem Auftreten des Signals kann in Betracht gezogen werden, wie z. B. ein Höchststand vor dem Preisbruch.
- Es wird empfohlen, die Optimierung der Parameter unter Berücksichtigung verschiedener Marktsituationen durchzuführen.
Richtung der Strategieoptimierung
- Verschiedene Parameterkombinationen können getestet werden, um die besten Parameter zu finden.
- Es kann in Erwägung gezogen werden, andere Kennzahlen, wie z. B. die Verkehrsmenge, die Schwankungsrate usw., zu verwenden, um die Signalqualität zu verbessern.
- Die EMA-Parameter können an Trends auf der großen Ebene angepasst werden, um die wichtigsten Trends besser zu erfassen.
- Eine dynamische Anpassung des ATR-Stopp-Multiplikators kann in Betracht gezogen werden, um den Stopp-Bereich im Trend zu erweitern.
- Optimierungsparameter, die sich selbst an die Optimierung anpassen, können mit einem Algorithmus des maschinellen Lernens kombiniert werden.
Zusammenfassen
Die Strategie ist insgesamt relativ einfach zu bedienen, basierend auf der EMA-Gleichgewicht-Signal erzeugt, die Folge, ergänzt mit ATR-Indikator zu verfolgen Stop-Loss, kann die Risiken effektiv zu kontrollieren. Obwohl es eine gewisse Falschsignale, aber die Fähigkeit, die wichtigsten Trends zu erfassen ist stark, die Erträge sind stabil, geeignet als eine der grundlegenden Strategien für quantitative Handel. Durch Parameter-Optimierung und Funktionserweiterung hat auch viel Raum für Verbesserung, ist es wert, in die Tiefe der Studie.
/*backtest
start: 2022-12-04 00:00:00
end: 2023-12-10 00:00:00
period: 1d
basePeriod: 1h
exchanges: [{"eid":"Futures_Binance","currency":"BTC_USDT"}]
*/

// This source code is subject to the terms of the Mozilla Public License 2.0 at https://mozilla.org/MPL/2.0/
// © byee322

/// This strategy uses the EMA to generate buy and sell signals with a 1.5x ATR stop loss- 1