Doppelbandgesteuerte starke Index-Handelsstrategie
Erstellungsdatum:
2023-12-12 17:12:35
zuletzt geändert:
2023-12-12 17:47:33
Kopie:
1
Klicks:
1068
1
konzentrieren Sie sich auf
1750
Anhänger
Überblick
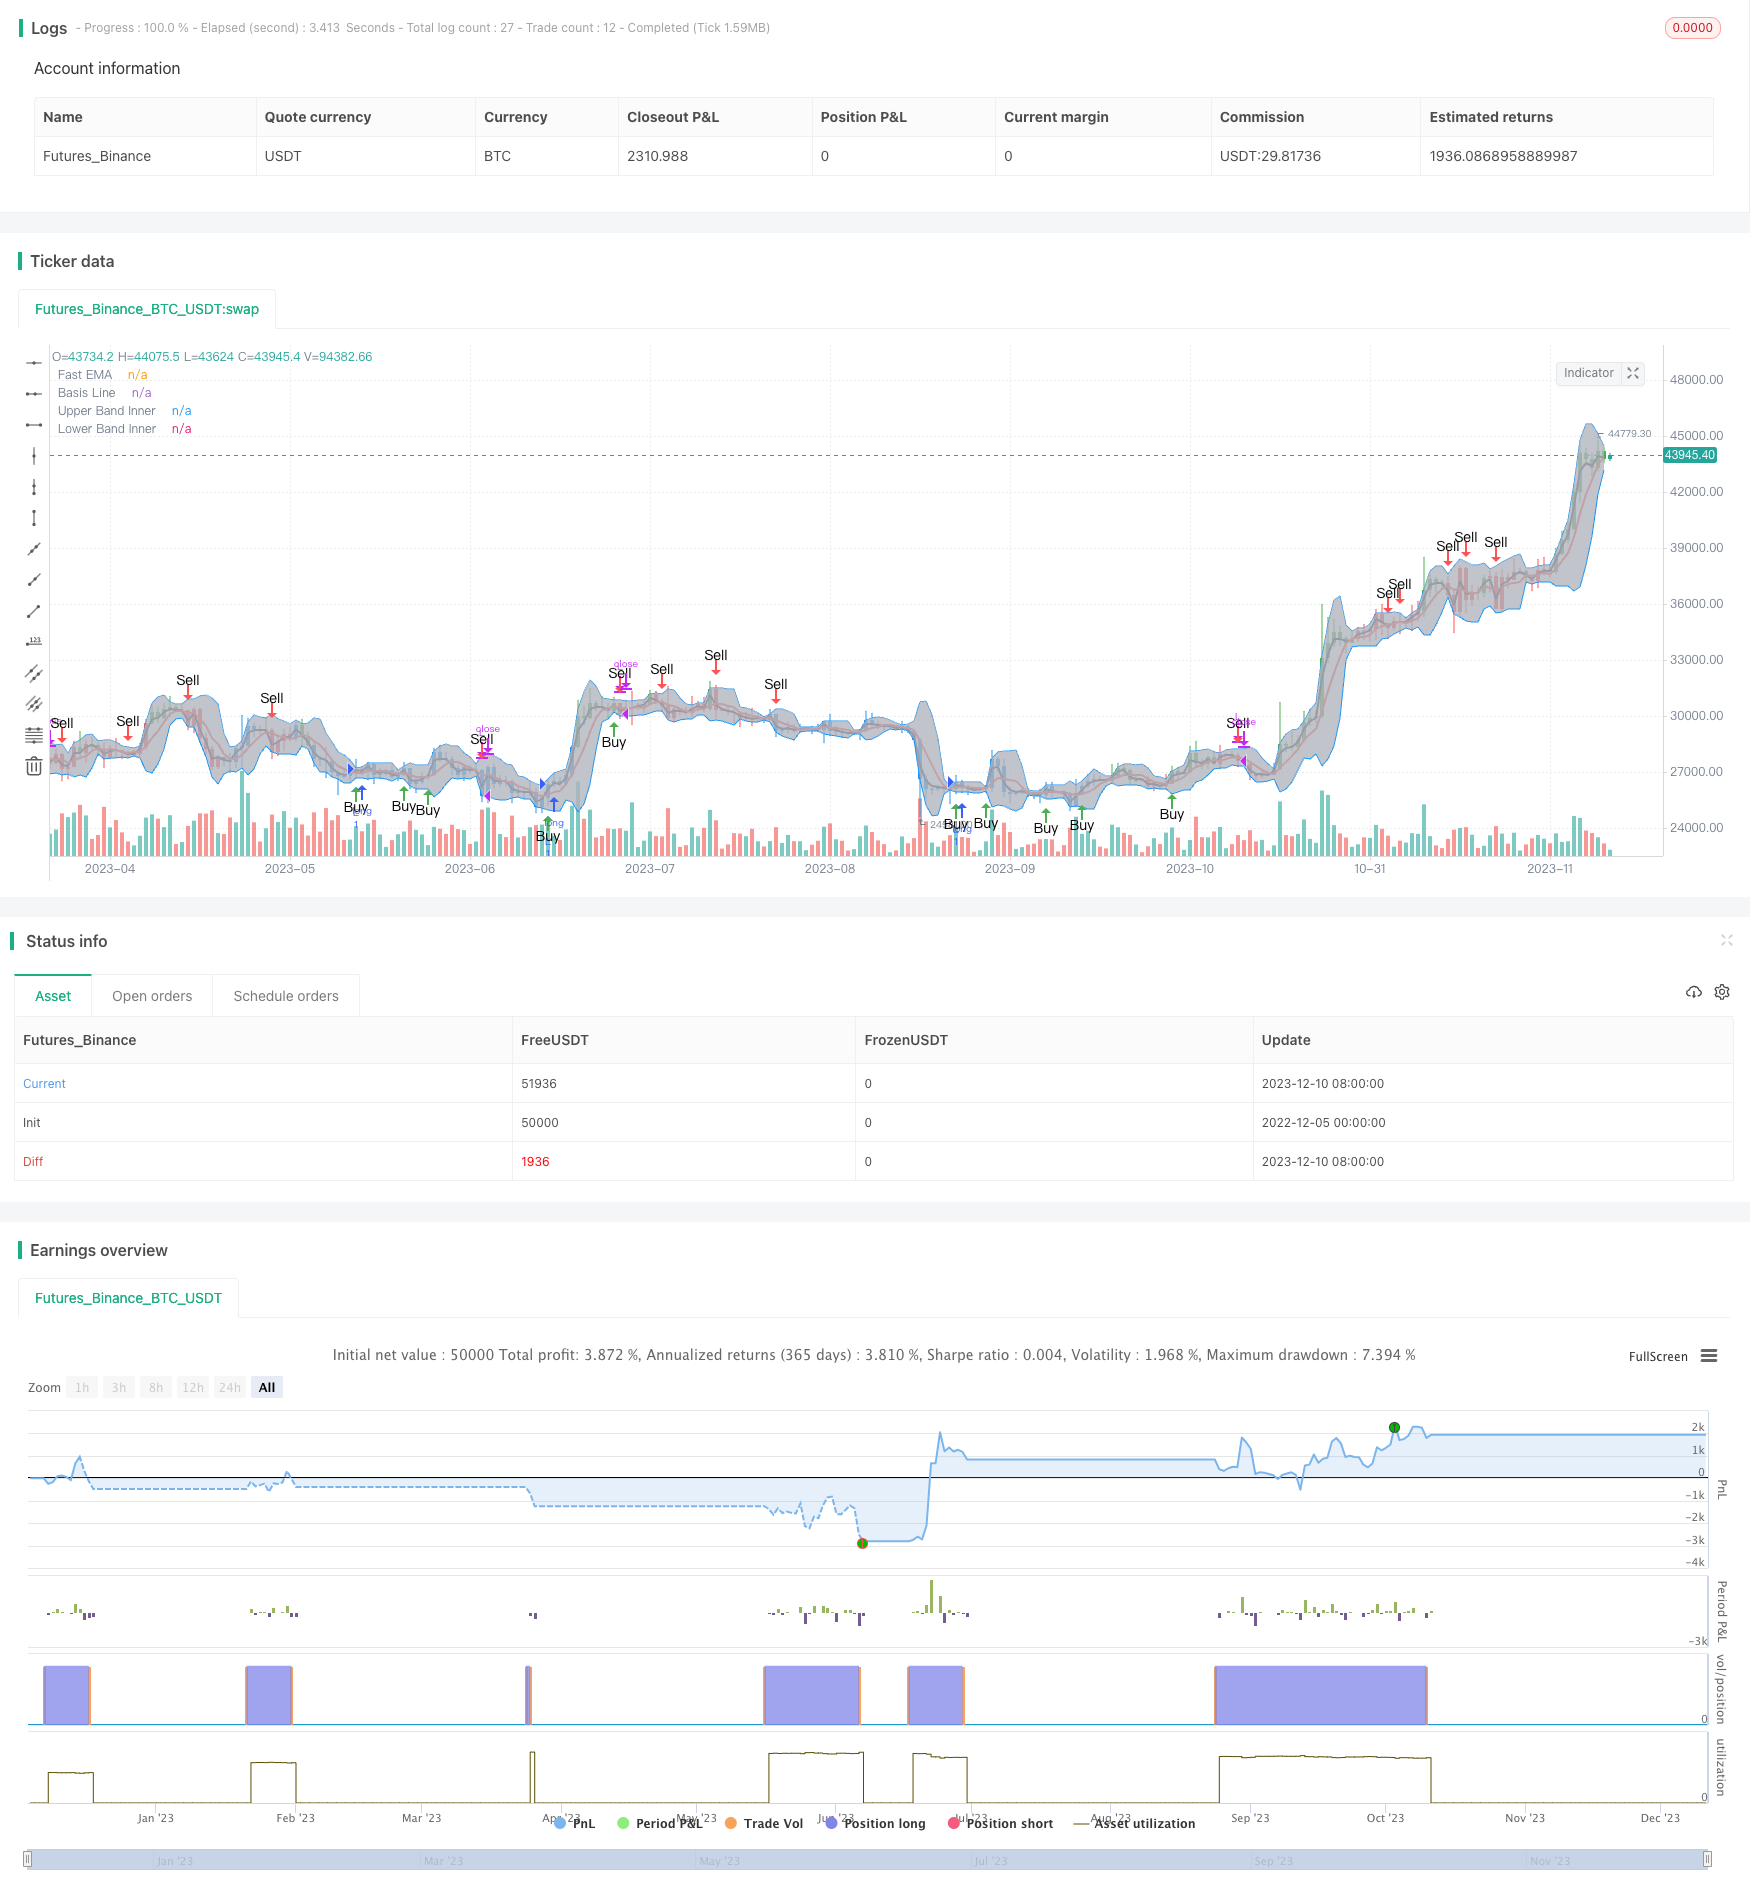
Diese Strategie kombiniert die Doppelband-Indikatoren mit den Indikatoren der Stärken und ermöglicht das Durchbruchmodell. Wenn die schnelle EMA den Bandkanal durchbricht, erzeugt sie in Kombination mit dem polygonalen Signal des AO-Indikators ein Kauf- und Verkaufssignal.
Strategieprinzip
- Mit Brin-Band-Mittel-, Ober- und Unterstrecken wird der Preiskanal bestimmt.
- Die schnelle EMA überschreitet die mittlere Bahn und wird als Durchbruch beurteilt.
- Der Kraftindex AO beurteilt die Richtung von mehrköpfigen und leeren Köpfen.
- Wenn ein schneller EMA nach oben durch die mittlere Bahn geht und AO positiv ist, wird ein Kaufsignal erzeugt.
- Wenn ein schneller EMA nach unten durch die Mitte der Bahn geht und AO negativ ist, wird ein Verkaufssignal erzeugt.
Analyse der Stärken
- Die Doppelwellenband-Indikatoren bestimmen den Preiskanal und vermeiden Fehlsignale.
- Der AO-Indikator beurteilt die Richtung des Trends und macht die Handelssignale genauer.
- In Kombination mit dem Modell des Channel Break-Tradings kann man in der Anfangsphase des Trends noch viel mehr Gold ergattern.
Risikoanalyse
- Fehlgeleitete Brin-Band-Parameter können dazu führen, dass die Kanäle zu breit oder zu schmal sind.
- Die Einstellung der AO-Indikatorparameter beeinflusst die Genauigkeit der Beurteilung.
- Ein Durchbruchsignal kann ein falscher Durchbruch sein, und es muss sichergestellt werden, dass es ausreichend Durchbruchkraft gibt.
Die Lösung
- Optimierung der Parameter für die Brin-Band- und AO-Indikatoren, um die optimale Kombination zu finden.
- Erhöhen Sie die Durchbruchstrength, um falsche Durchbrüche zu vermeiden.
- Die Verwendung in Kombination mit anderen Indikatoren gewährleistet die Zuverlässigkeit der Handelssignale.
Optimierungsrichtung
- Optimieren Sie die Parameter des Brin-Bands, um den geeignetsten Durchgangsbereich zu finden.
- Optimierung der langfristigen Mittelwertparameter der AO-Indikatoren, um die Genauigkeit der Beurteilung zu verbessern.
- Erhöhen Sie das Volumen oder andere Kennzahlen, um die Zuverlässigkeit des Durchbruchs sicherzustellen.
- Optimierung der Durchbruchparameter und Verringerung der Falschdurchbruchrate.
Zusammenfassen
Diese Strategie berücksichtigt die Preiskanäle, die Trendrichtung und das Durchbruchmodell und ist eine stabilere und effizientere Handelsstrategie. Durch die Optimierung von Parametern und die Filterung von Kombinationsindikatoren können die Stabilität und die Ertragsrate der Strategie weiter verbessert werden. Das Durchbruchmodell kann frühe Chancen für Trends erfassen und hat großen praktischen Wert.
Strategiequellcode
/*backtest
start: 2022-12-05 00:00:00
end: 2023-12-11 00:00:00
period: 1d
basePeriod: 1h
exchanges: [{"eid":"Futures_Binance","currency":"BTC_USDT"}]
*/

//@version=3

strategy(shorttitle="BB+AO STRAT", title="BB+AO STRAT", overlay=true)


// === BACKTEST RANGE ===
FromMonth = input(defval = 6, title = "From Month", minval = 1)
FromDay   = input(defval = 1, title = "From Day", minval = 1)
FromYear  = input(defval = 2018, title = "From Year", minval = 2014)
ToMonth   = input(defval = 1, title = "To Month", minval = 1)
ToDay     = input(defval = 1, title = "To Day", minval = 1)
ToYear    = input(defval = 9999, title = "To Year", minval = 2014)

// Bollinger Bands Inputs
bb_use_ema = input(false, title="Use EMA for Bollinger Band")
bb_length = input(5, minval=1, title="Bollinger Length")
bb_source = input(close, title="Bollinger Source")
bb_mult = input(2.0, title="Base Multiplier", minval=0.5, maxval=10)
// EMA inputs
fast_ma_len = input(2, title="Fast EMA length", minval=2)
// Awesome Inputs
nLengthSlow = input(34, minval=1, title="Awesome Length Slow")
nLengthFast = input(5, minval=1, title="Awesome Length Fast")


// Breakout Indicator Inputs
bb_basis = bb_use_ema ? ema(bb_source, bb_length) : sma(bb_source, bb_length)
fast_ma  = ema(bb_source, fast_ma_len)

// Deviation

dev = stdev(bb_source, bb_length)
bb_dev_inner = bb_mult * dev

// Upper bands
inner_high = bb_basis + bb_dev_inner
// Lower Bands
inner_low = bb_basis - bb_dev_inner

// Calculate Awesome Oscillator
xSMA1_hl2 = sma(hl2, nLengthFast)
xSMA2_hl2 = sma(hl2, nLengthSlow)
xSMA1_SMA2 = xSMA1_hl2 - xSMA2_hl2
// Calculate direction of AO
AO = xSMA1_SMA2>=0? xSMA1_SMA2 > xSMA1_SMA2[1] ? 1 : 2 : xSMA1_SMA2 > xSMA1_SMA2[1] ? -1 : -2


// === PLOTTING ===

// plot BB basis
plot(bb_basis, title="Basis Line", color=red, transp=10, linewidth=2)
// plot BB upper and lower bands
ubi = plot(inner_high, title="Upper Band Inner", color=blue, transp=10, linewidth=1)
lbi = plot(inner_low, title="Lower Band Inner", color=blue, transp=10, linewidth=1)
// center BB channel fill
fill(ubi, lbi, title="Center Channel Fill", color=silver, transp=90)

// plot fast ma
plot(fast_ma, title="Fast EMA", color=black, transp=10, linewidth=2)

// Calc breakouts
break_down =   crossunder(fast_ma, bb_basis) and close < bb_basis and abs(AO)==2
break_up   =  crossover(fast_ma, bb_basis) and close > bb_basis and abs(AO)==1

// Show Break Alerts
plotshape(break_down, title="Breakout Down", style=shape.arrowdown, location=location.abovebar, size=size.auto, text="Sell", color=red, transp=0)
plotshape(break_up, title="Breakout Up", style=shape.arrowup, location=location.belowbar, size=size.auto, text="Buy", color=green, transp=0)
// === ALERTS ===


strategy.entry("L", strategy.long, when=(break_up and (time > timestamp(FromYear, FromMonth, FromDay, 00, 00)) and (time < timestamp(ToYear, ToMonth, ToDay, 23, 59))))


strategy.close("L", when=(break_down and (time < timestamp(ToYear, ToMonth, ToDay, 23, 59))))

// === /PLOTTING ===
barcolor(AO == 2 ? red: AO == 1 ? green : blue )


// eof