Double-Band-Breakout-Strategie

Überblick
Die Strategie verwendet die Doppelwellenband-Anzeige, um die Berechnungszone zu identifizieren, in Verbindung mit der Breakout-Strategie, um eine Handelsstrategie zu erzielen, die niedrig ist und hoch ist. Wenn der Preis die Neutralzone durchbricht, zeigt dies, dass der Preis einen neuen Trend beginnt, und dann wird mehr eingegeben. Wenn der Preis wieder die Neutralzone durchbricht, zeigt dies, dass der Preistrend beendet ist, und dann ist er plat.
Strategieprinzip
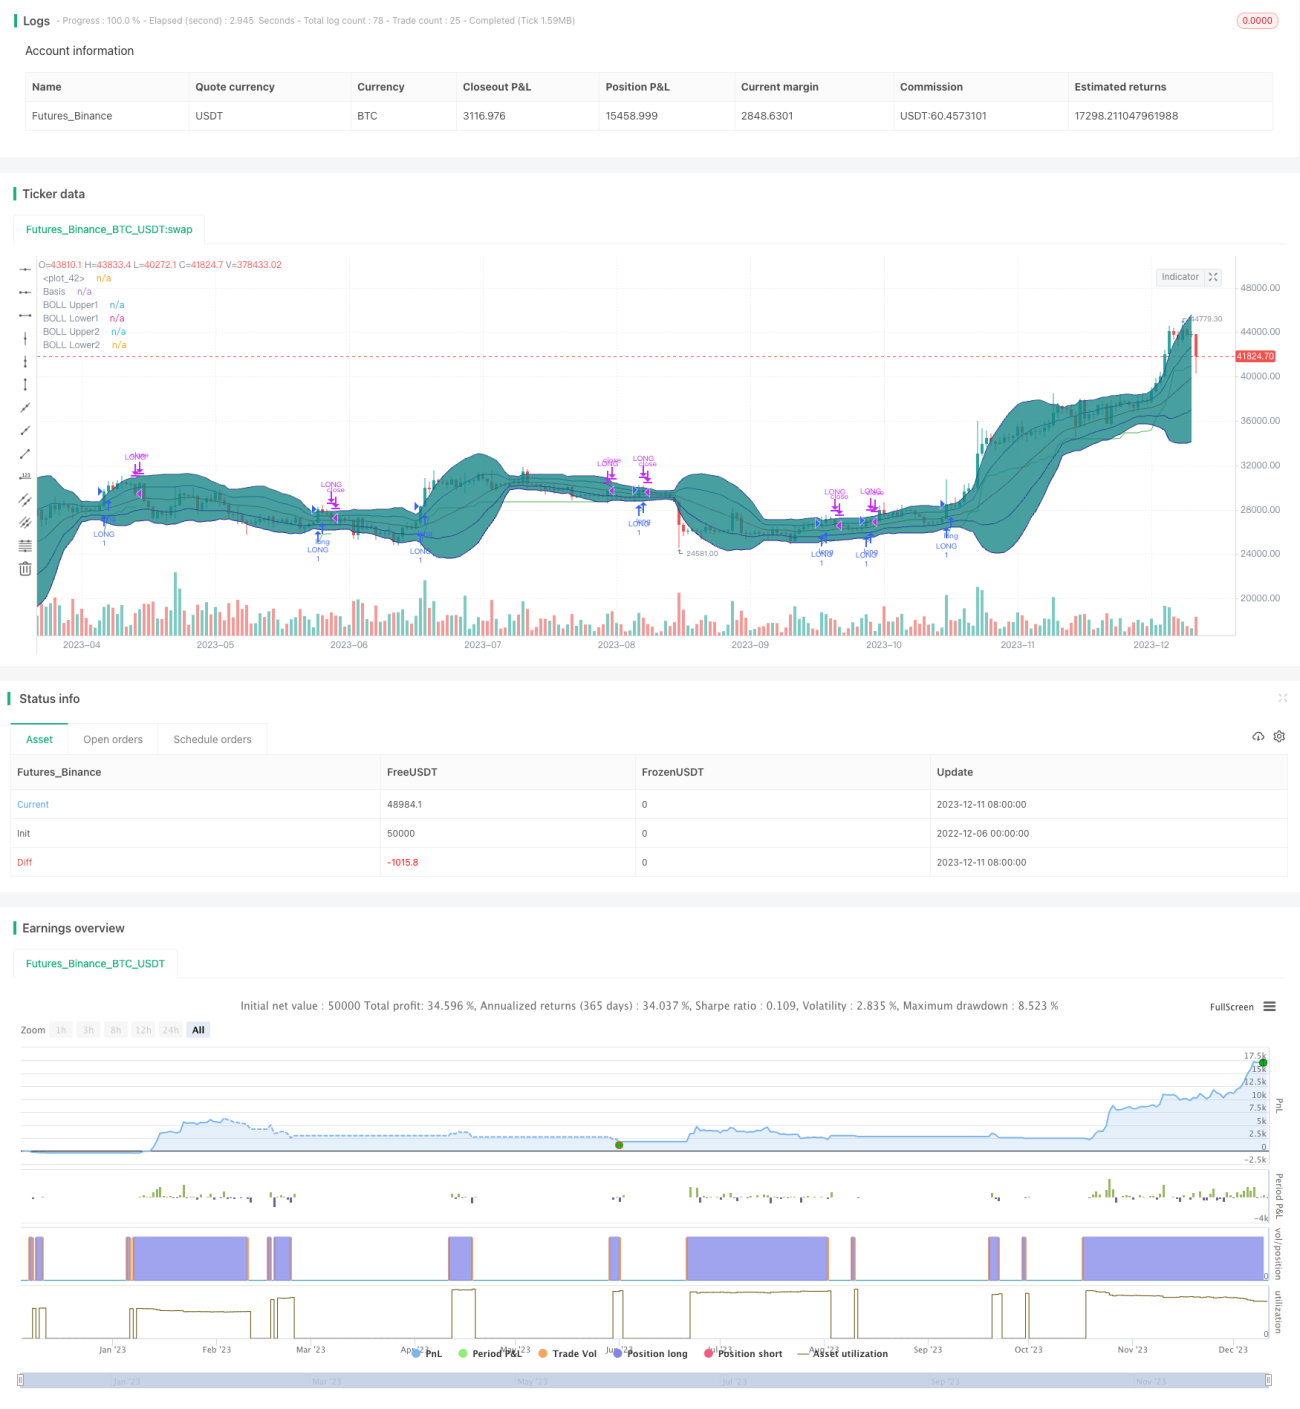
Die Strategie verwendet zwei Bollinger Bands. Die oberen und unteren Spuren des inneren Bollinger Bands sind mit einem 20-Tage-einfachen gleitenden Durchschnitt von ± 1 Standarddifferenz; die oberen und unteren Spuren des äußeren Bollinger Bands sind mit einem 20-Tage-einfachen gleitenden Durchschnitt von ± 2 Standarddifferenz. Die Neutralzone wird definiert, wenn der Preis zwischen den inneren und äußeren Bollinger Bands liegt.
Wenn der Preis zwei aufeinanderfolgende K-Linien in der neutralen Zone sind, ist es in der Ausgleichung; wenn der Preis zwei aufeinanderfolgende K-Linien ausgleichend, die dritte K-Linie Schlusskurs über Nebrill-Band auf der Bahn, erzeugen mehrere Signale.
Ein Stop-Loss-Line wird auf den Minimalpreis - 2 mal ATR gesetzt, um Gewinne zu sichern und Risiken zu kontrollieren.
Analyse der Stärken
Die Strategie kombiniert die beiden Faktoren der Indikatoren und der Tendenz, um die Bereinigung von Gebieten zu identifizieren und zu beurteilen, ob der Preis eine neue Runde des Trends eingeleitet hat, um einen niedrigen Kauf zu erzielen und einen hohen Verkauf zu erzielen. Die Stop-Loss-Strategie kann die Gewinne sperren und das Risiko kontrollieren, was die Strategie zu einer höheren Stabilität macht.
Risikoanalyse
Die Strategie basiert auf dem Mehrfachsignal, das bei einem Preisbruch der Brin-Band entsteht. Ein falscher Bruch führt zu Fehlern und Verlusten. Darüber hinaus kann ein zu naher Stopp auch durch einen Sekundenstillstand verursacht werden.
Die Wahrscheinlichkeit von False-Breakings kann durch Optimierung der Parameter des Brin-Bands, Erhöhung der Filterbedingungen und andere Methoden verringert werden. Zusätzlich kann die Stop-Loss-Punkt angemessen gelockert werden, um sicherzustellen, dass genügend Platz vorhanden ist.
Optimierungsrichtung
- Optimierung der Parameter des Brinbands, Anpassung der Breite des Brinbands und Verringerung der Wahrscheinlichkeit eines falschen Durchbruchs
- Hinzufügen von Filtern für andere Kennzahlen, z. B. Transaktionsvolumen, um falsche Durchbrüche bei geringen Mengen zu vermeiden
- Anpassung der Stop-Loss-Strategie zur Verhinderung von Setz- und Sekundenschaden
- Erhöhung der Batch-Strategie zur Verringerung des Einzelrisikos
Zusammenfassen
Die Strategie integriert die Binärband-Indikatoren und die Trendstrategie, um einen niedrigen Preis zu erzielen. Die Stop-Loss-Strategie macht die Strategie gleichzeitig stabiler. Durch weitere Optimierung kann die Effektivität der Strategie verbessert werden.
- 1