Momentum Swing Trading Strategie


Erstellungsdatum: 2023-12-15 11:00:25 zuletzt geändert: 2023-12-15 11:00:25
Kopie: 0 Klicks: 679
1
konzentrieren Sie sich auf
1621
Anhänger

Momentum Swing Trading Strategie

Überblick

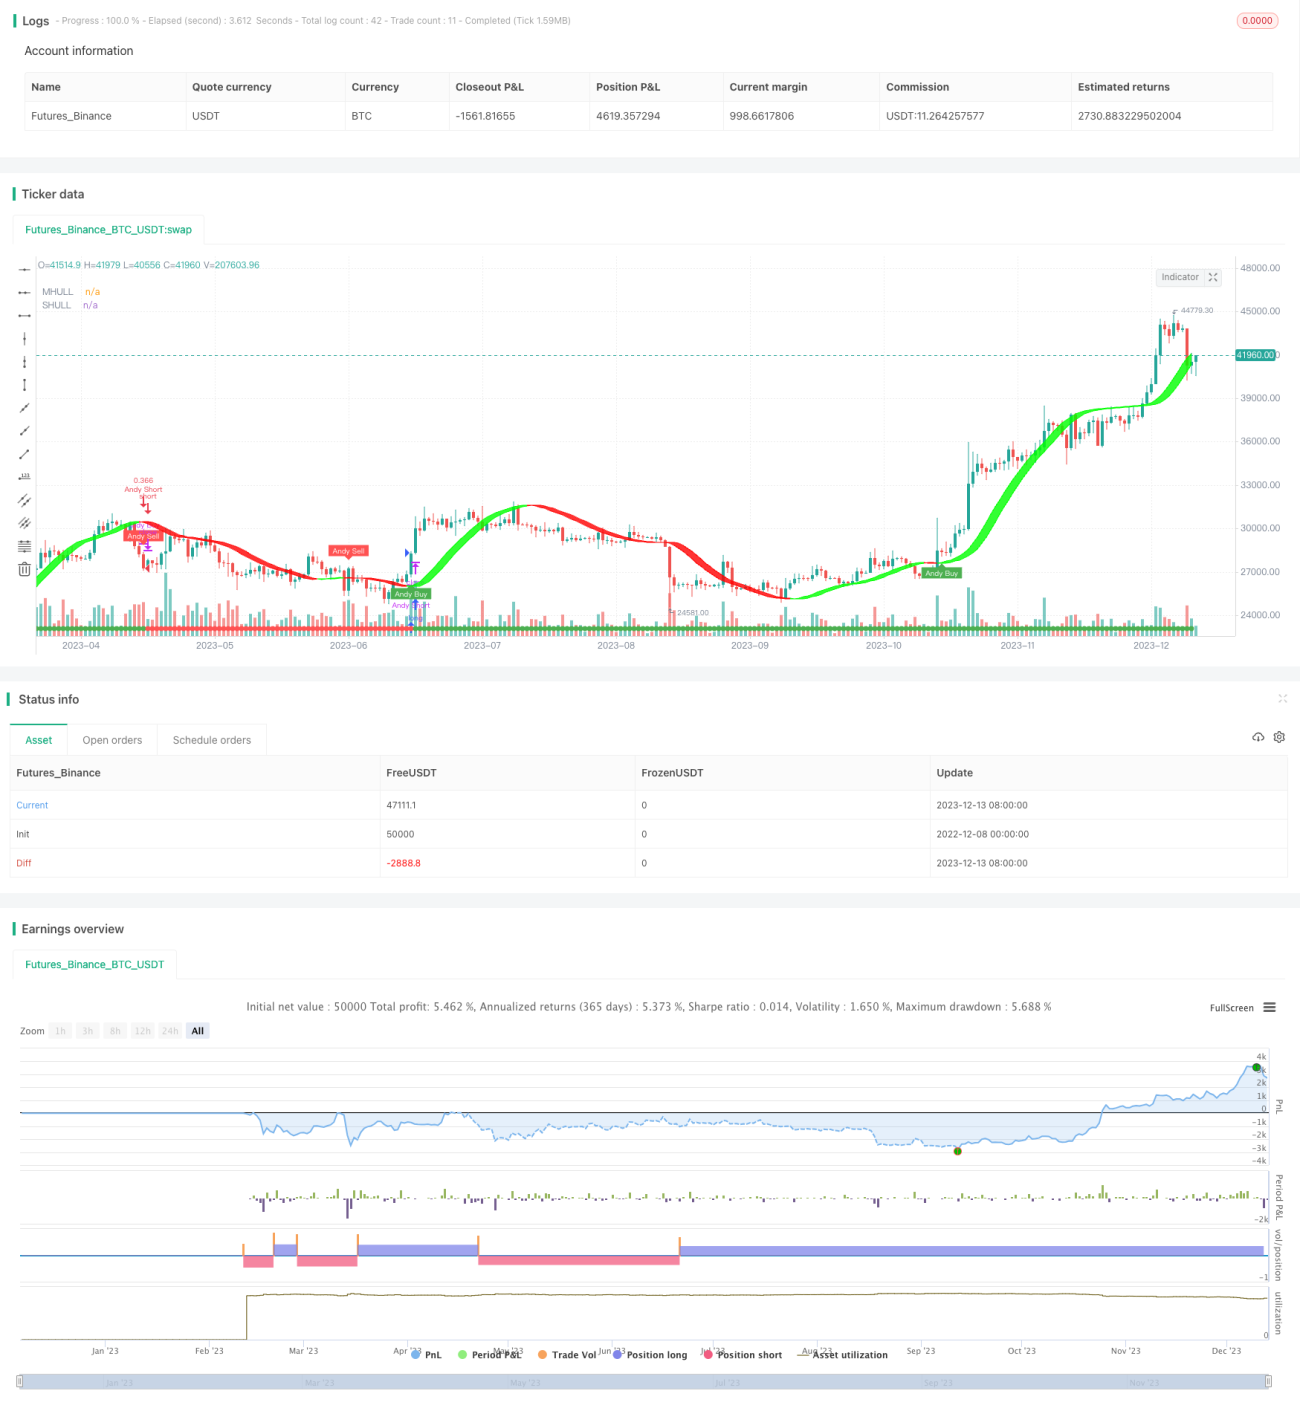
Die Dynamic Momentum Oscillator Trading Strategy (DMO-Strategie) ist eine 15-minütige Short-Line-Trading-Strategie, die auf dynamischen Oszillationsindikatoren basiert. Die Strategie kombiniert mehrere technische Indikatoren, um hochgenaue Handelssignale zu erzielen, die Anfängern helfen, Kauf- und Verkaufsentscheidungen in kurzer Zeit zu treffen, Risiken zu kontrollieren und die Gewinnwahrscheinlichkeit zu erhöhen.

Strategieprinzip

Die Strategie verwendet zunächst die Doinchian-Kanal, um die Richtung des Haupttrends des Marktes zu bestimmen. Wenn der Preis den Kanal durchbricht, ist dies ein Blicksignal, wenn er ihn durchbricht, ist es ein Blicksignal. Als nächstes verwendet die Strategie eine der drei Hull Moving-Average-Varianten, die in Kombination mit der Anpassung an den ATR-Kanal eine präzisere Trendbestimmung ermöglicht.

Analyse der Stärken

Der größte Vorteil der DMO-Strategie liegt in der organischen Kombination verschiedener Indikatoren, die sich gegenseitig verifizieren können, um falsche Signale zu filtern und jedes Handelssignal genauer und zuverlässiger zu machen. Darüber hinaus ist die Art und Weise, wie die dominanten Trends beurteilt werden, einfach und direkt. Die Mittel zur Filterung der halben Durchschnittslinie sind auch eher konventionell und insgesamt leicht verständlich.

Risikoanalyse

Obwohl die DMO-Strategie stabiler und zuverlässiger ist, besteht bei jeder quantitativen Handelsstrategie unweigerlich ein gewisses Risiko. Insbesondere ist es möglich, dass ein Falschsignal besteht, wenn die Schnelllinie und die Mittellinie einen Todesfork erzeugen, wenn keine anderen Kennzahlen überprüft werden. Darüber hinaus ist die DMO, wie alle Shortline-Strategien, mit einem gewissen Überhandelsrisiko konfrontiert.

Optimierungsrichtung

Die DMO-Strategie kann in folgenden Dimensionen optimiert werden: Erstens, die Parameter des Hull MA anpassen, um die Länge des Moving Averages zu optimieren, die Balance zwischen Smoothing und Sensitivität zu verbessern; Zweitens, die Doinchian-Kanalentscheidungslogik zu verbessern, z. B. die Kanalparameter anpassen oder zusätzliche Einstiegsbeschränkungen hinzufügen; Drittens, andere Indikatoren anstelle des halben Durchschnitts wie Brinband, KDJ usw. zu versuchen, um die Effektivität des Hilfsfilters zu verbessern; Viertens, die geeigneten Handelsintervalle entsprechend den Merkmalen der verschiedenen Marken zu bestimmen, z. B. in 5 Minuten oder 30 Minuten.

Zusammenfassen

Die DMO ist eine Kurzlinienstrategie, die eine Kombination aus mehreren Indikatoren optimiert. Sie kombiniert die Doinchian-Kanäle, den Hull MA und den Halbwertsaldo, um die Markttrends zu beurteilen und präzise Handelssignale zu erzeugen. Die Strategie ist relativ einfach, intuitiv und leicht zu bedienen und kann als Einstiegsstrategie für Anfänger verwendet werden.

Strategiequellcode
/*backtest
start: 2022-12-08 00:00:00
end: 2023-12-14 00:00:00
period: 1d
basePeriod: 1h
exchanges: [{"eid":"Futures_Binance","currency":"BTC_USDT"}]
*/

// This source code is subject to the terms of the Mozilla Public License 2.0 at https://mozilla.org/MPL/2.0/
// © kgynofomo

//@version=5
strategy(title="[Salavi] | Andy Super Pro Strategy [BTC|M15]",overlay = true, pyramiding = 1,initial_capital = 10000, default_qty_type = strategy.cash,default_qty_value = 10000)

//Doinchian Trend Ribbon
dlen = input.int(defval=30, minval=10)

dchannel(len) =>
    float hh = ta.highest(len)
    float ll = ta.lowest(len)

    int trend = 0
    trend := close > hh[1] ? 1 : close < ll[1] ? -1 : nz(trend[1])
    trend

dchannelalt(len, maintrend) =>
    float hh = ta.highest(len)
    float ll = ta.lowest(len)

    int trend = 0
    trend := close > hh[1] ? 1 : close < ll[1] ? -1 : nz(trend[1])
    maintrend == 1 ? trend == 1 ? #00FF00ff : #00FF009f : maintrend == -1 ? trend == -1 ? #FF0000ff : #FF00009f : na

maintrend = dchannel(dlen)
donchian_bull = maintrend==1
donchian_bear = maintrend==-1


//Hulls
src = input(hlc3, title='Source')
modeSwitch = input.string('Hma', title='Hull Variation', options=['Hma', 'Thma', 'Ehma'])
length = input(55, title='Length')
lengthMult = input(1.0, title='Length multiplier ')

useHtf = false
htf = '240'

switchColor = true
candleCol = false
visualSwitch = true
thicknesSwitch = 1
transpSwitch = 40

//FUNCTIONS
//HMA
HMA(_src, _length) =>
    ta.wma(2 * ta.wma(_src, _length / 2) - ta.wma(_src, _length), math.round(math.sqrt(_length)))
//EHMA    
EHMA(_src, _length) =>
    ta.ema(2 * ta.ema(_src, _length / 2) - ta.ema(_src, _length), math.round(math.sqrt(_length)))
//THMA    
THMA(_src, _length) =>
    ta.wma(ta.wma(_src, _length / 3) * 3 - ta.wma(_src, _length / 2) - ta.wma(_src, _length), _length)

//SWITCH
Mode(modeSwitch, src, len) =>
    modeSwitch == 'Hma' ? HMA(src, len) : modeSwitch == 'Ehma' ? EHMA(src, len) : modeSwitch == 'Thma' ? THMA(src, len / 2) : na

//OUT
_hull = Mode(modeSwitch, src, int(length * lengthMult))
HULL = useHtf ? request.security(syminfo.ticker, htf, _hull) : _hull
MHULL = HULL[0]
SHULL = HULL[2]

//COLOR
hullColor = switchColor ? HULL > HULL[2] ? #00ff00 : #ff0000 : #ff9800
hull_bull = HULL > HULL[2]
bull_start = hull_bull and hull_bull[1]==false
hull_bear = HULL < HULL[2]
bear_start = hull_bear and hull_bear[1]==false

barcolor(color=candleCol ? switchColor ? hullColor : na : na)

//halftrend
amplitude = input(title='Amplitude', defval=2)
channelDeviation = input(title='Channel Deviation', defval=2)
// showArrows = input(title='Show Arrows', defval=true)
// showChannels = input(title='Show Channels', defval=true)

var int trend = 0
var int nextTrend = 0
var float maxLowPrice = nz(low[1], low)
var float minHighPrice = nz(high[1], high)

var float up = 0.0
var float down = 0.0
float atrHigh = 0.0
float atrLow = 0.0
float arrowUp = na
float arrowDown = na

atr2 = ta.atr(100) / 2
dev = channelDeviation * atr2

highPrice = high[math.abs(ta.highestbars(amplitude))]
lowPrice = low[math.abs(ta.lowestbars(amplitude))]
highma = ta.sma(high, amplitude)
lowma = ta.sma(low, amplitude)

if nextTrend == 1
    maxLowPrice := math.max(lowPrice, maxLowPrice)

    if highma < maxLowPrice and close < nz(low[1], low)
        trend := 1
        nextTrend := 0
        minHighPrice := highPrice
        minHighPrice
else
    minHighPrice := math.min(highPrice, minHighPrice)

    if lowma > minHighPrice and close > nz(high[1], high)
        trend := 0
        nextTrend := 1
        maxLowPrice := lowPrice
        maxLowPrice

if trend == 0
    if not na(trend[1]) and trend[1] != 0
        up := na(down[1]) ? down : down[1]
        arrowUp := up - atr2
        arrowUp
    else
        up := na(up[1]) ? maxLowPrice : math.max(maxLowPrice, up[1])
        up
    atrHigh := up + dev
    atrLow := up - dev
    atrLow
else
    if not na(trend[1]) and trend[1] != 1
        down := na(up[1]) ? up : up[1]
        arrowDown := down + atr2
        arrowDown
    else
        down := na(down[1]) ? minHighPrice : math.min(minHighPrice, down[1])
        down
    atrHigh := down + dev
    atrLow := down - dev
    atrLow

ht = trend == 0 ? up : down

var color buyColor = color.blue
var color sellColor = color.red

htColor = trend == 0 ? buyColor : sellColor
// htPlot = plot(ht, title='HalfTrend', linewidth=2, color=htColor)

// atrHighPlot = plot(showChannels ? atrHigh : na, title='ATR High', style=plot.style_circles, color=color.new(sellColor, 0))
// atrLowPlot = plot(showChannels ? atrLow : na, title='ATR Low', style=plot.style_circles, color=color.new(buyColor, 0))

// fill(htPlot, atrHighPlot, title='ATR High Ribbon', color=color.new(sellColor, 90))
// fill(htPlot, atrLowPlot, title='ATR Low Ribbon', color=color.new(buyColor, 90))

HalfTrend_buySignal = not na(arrowUp) and trend == 0 and trend[1] == 1
HalfTrend_sellSignal = not na(arrowDown) and trend == 1 and trend[1] == 0

// plotshape(showArrows and buySignal ? atrLow : na, title='Arrow Up', style=shape.triangleup, location=location.absolute, size=size.tiny, color=color.new(buyColor, 0))
// plotshape(showArrows and sellSignal ? atrHigh : na, title='Arrow Down', style=shape.triangledown, location=location.absolute, size=size.tiny, color=color.new(sellColor, 0))


//ema
filter_ema = ta.ema(close,200)
ema_bull = close>filter_ema
ema_bear = close<filter_ema

atr_length = input.int(7)
atr = ta.atr(atr_length)
atr_rsi_length = input.int(50)
atr_rsi = ta.rsi(atr,atr_rsi_length)
atr_valid = atr_rsi>50

longCondition = bull_start and atr_valid
shortCondition = bear_start and atr_valid

Exit_long_condition = shortCondition
Exit_short_condition = longCondition

if longCondition
    strategy.entry("Andy Buy",strategy.long, limit=close,comment="Andy Buy Here")

if Exit_long_condition
    strategy.close("Andy Buy",comment="Andy Buy Out")
    // strategy.entry("Andy fandan Short",strategy.short, limit=close,comment="Andy 翻單 short Here")
    // strategy.close("Andy fandan Buy",comment="Andy short Out")


if shortCondition
    strategy.entry("Andy Short",strategy.short, limit=close,comment="Andy short Here")


// strategy.exit("STR","Long",stop=longstoploss)
if Exit_short_condition
    strategy.close("Andy Short",comment="Andy short Out")
    // strategy.entry("Andy fandan Buy",strategy.long, limit=close,comment="Andy 翻單 Buy Here")
    // strategy.close("Andy fandan Short",comment="Andy Buy Out")


inLongTrade = strategy.position_size > 0
inLongTradecolor = #58D68D
notInTrade = strategy.position_size == 0
inShortTrade = strategy.position_size < 0

// bgcolor(color = inLongTrade?color.rgb(76, 175, 79, 70):inShortTrade?color.rgb(255, 82, 82, 70):na)
plotshape(close!=0,location = location.bottom,color = inLongTrade?color.green:inShortTrade?color.red:na)


plotshape(longCondition, title='Buy', text='Andy Buy', style=shape.labelup, location=location.belowbar, color=color.new(color.green, 0), textcolor=color.new(color.white, 0), size=size.tiny)
plotshape(shortCondition, title='Sell', text='Andy Sell', style=shape.labeldown, location=location.abovebar, color=color.new(color.red, 0), textcolor=color.new(color.white, 0), size=size.tiny)

Fi1 = plot(MHULL, title='MHULL', color=hullColor, linewidth=thicknesSwitch, transp=50)
Fi2 = plot(SHULL, title='SHULL', color=hullColor, linewidth=thicknesSwitch, transp=50)

fill(Fi1, Fi2, title='Band Filler', color=hullColor, transp=transpSwitch)