Momentum TD Reversal Handelsstrategie


Erstellungsdatum: 2023-12-18 17:40:10 zuletzt geändert: 2023-12-18 17:40:10
Kopie: 0 Klicks: 845
1
konzentrieren Sie sich auf
1621
Anhänger

Momentum TD Reversal Handelsstrategie

Überblick

Die Dynamik-TD-Umkehr-Handelsstrategie ist eine quantitative Handelsstrategie, die die TD Sequential-Indikator verwendet, um Preisumkehrsignale zu identifizieren. Die Strategie basiert auf der Analyse der Preisdynamik, um nach der Bestätigung eines Preisumkehrsignals eine Über- oder Unterposition zu erstellen.

Strategieprinzip

Die Strategie analysiert die Preisschwankungen mit dem TD Sequential-Indikator und identifiziert die Preisumkehrform von 9 aufeinanderfolgenden K-Linien. Insbesondere wird die Strategie als Short-Opportunity beurteilt, wenn eine fallende K-Line nach einem Anstieg von 9 aufeinanderfolgenden K-Linien identifiziert wird. Umgekehrt wird die Strategie als Mehr-Opportunity beurteilt, wenn eine steigende K-Line nach einem Rückgang von 9 aufeinanderfolgenden K-Linien identifiziert wird.

Die Vorteile des TD Sequential-Indikators ermöglichen es, ein Preisumkehrsignal vorzeitig zu erfassen. In Kombination mit einer bestimmten Anzahl von Nachschub- und Absturzmechanismen in der Strategie können nach der Bestätigung des Umkehrsignals rechtzeitig Über- oder Kurzpositionen eingerichtet werden, um eine bessere Eintrittschance zu erhalten.

Analyse der Stärken

  • Der TD-Sequential-Indikator hilft, die Chancen auf eine Kursumkehr zu erkennen.
  • Die Einrichtung eines Abwehrmechanismus, um die Preisumkehr zu ermitteln
  • Eintrittspunkte durch Umkehrung der Formationsphase

Risikoanalyse

  • Falsche Durchbrüche im TD Sequential-Index sind möglich und müssen in Kombination mit anderen Faktoren bestätigt werden
  • Risikominderung durch angemessene Kontrolle der Positionsgröße und -dauer

Optimierungsrichtung

  • Identifizierung von Umkehrsignalen in Kombination mit anderen Indikatoren, um das Risiko eines falschen Durchbruchs zu vermeiden
  • Einrichtung von Stop-Loss-Mechanismen zur Kontrolle von Einzelschäden
  • Optimierung der Positionsgröße und -dauer, Ausgewogenheit der Gewinngröße und Risikokontrolle

Zusammenfassen

Die Dynamik-TD-Umkehr-Trading-Strategie, die eine Preisumkehr durch den TD Sequential-Indikator voraussagt und nach der Bestätigung der Umkehr schnell Positionen aufbaut, ist eine Strategie, die für Dynamik-Händler geeignet ist. Die Strategie hat den Vorteil, Umkehrmöglichkeiten zu identifizieren, jedoch muss darauf geachtet werden, das Risiko zu kontrollieren, um größere Verluste durch falsche Durchbrüche zu vermeiden.
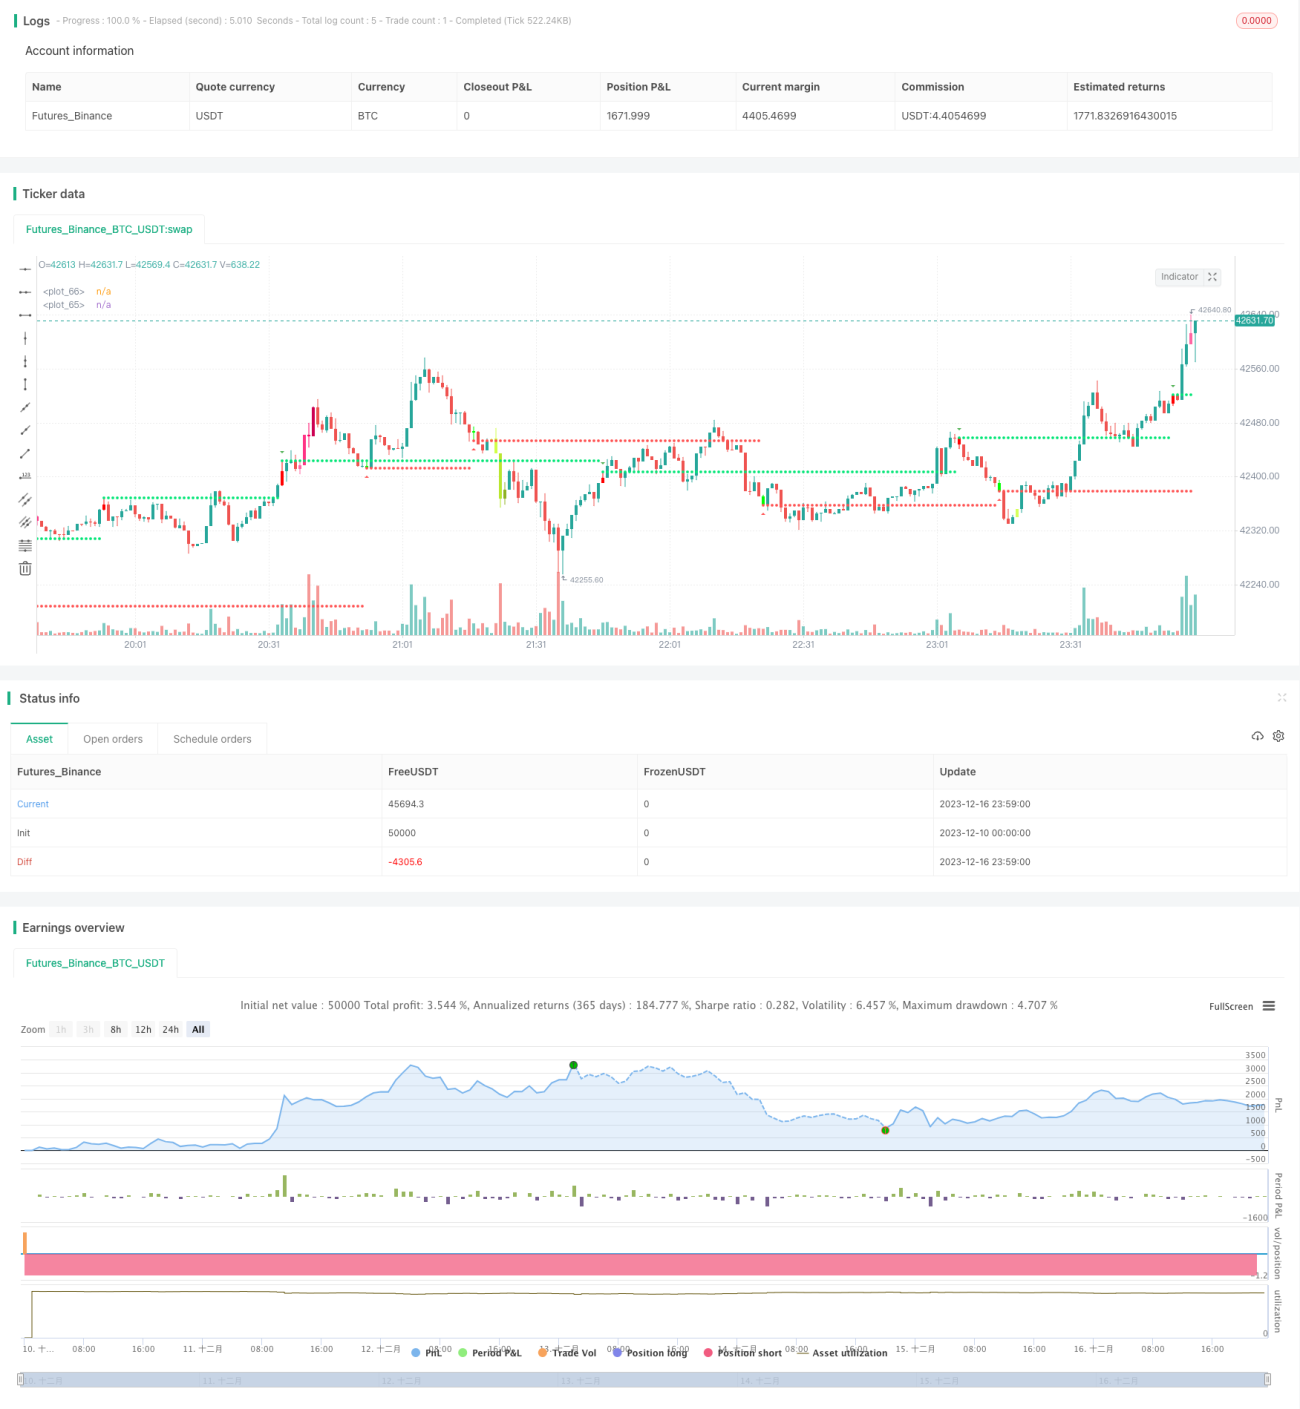
Strategiequellcode
/*backtest
start: 2023-12-10 00:00:00
end: 2023-12-17 00:00:00
period: 1m
basePeriod: 1m
exchanges: [{"eid":"Futures_Binance","currency":"BTC_USDT"}]
*/

//@version=4
//This strategy is based on TD sequential study from glaz. 
//I made some improvement and modification to comply with pine script version 4.
//Basically, it is a strategy based on proce action, supports and resistance.

strategy("Sequential Up/Down", overlay=true )
source = input(close)
BarsCount = input(9, "Count of consecutive bars")
useLinearRegression = input(false)
LR_length = input(13,"Linear Regression length")
SR = input(true,"Shows Supports and Resistance lines")
Barcolor = input(true,"Color bars when there is a signal")
transp = input(0, "Transparency of triangle Up or Downs")
Numbers = input(true,"Plot triangle Up or Downs at signal")

//Calculation
src=useLinearRegression?linreg(source,LR_length,0):source
UP = 0
DW = 0
UP := src > src[4] ? nz(UP[1]) + 1 : 0
DW := src < src[4] ? nz(DW[1]) + 1 : 0

UPUp = UP - valuewhen(UP < UP[1], UP, 1)
DWDn = DW - valuewhen(DW < DW[1], DW, 1)

plotshape(Numbers ? UPUp == BarsCount ? true : na : na, style=shape.triangledown, text="", color=color.green, location=location.abovebar, transp=transp)
plotshape(Numbers ? DWDn == BarsCount ? true : na : na, style=shape.triangleup, text="", color=color.red, location=location.belowbar, transp=transp)


// S/R Code By johan.gradin
//------------//
// Sell Setup //
//------------//
priceflip = barssince(src < src[4])
sellsetup = src > src[4] and priceflip
sell = sellsetup and barssince(priceflip != BarsCount)
sellovershoot = sellsetup and barssince(priceflip != BarsCount+4)
sellovershoot1 = sellsetup and barssince(priceflip != BarsCount+5)
sellovershoot2 = sellsetup and barssince(priceflip != BarsCount+6)
sellovershoot3 = sellsetup and barssince(priceflip != BarsCount+7)

//----------//
// Buy setup//
//----------//
priceflip1 = barssince(src > src[4])
buysetup = src < src[4] and priceflip1
buy = buysetup and barssince(priceflip1 != BarsCount)
buyovershoot = barssince(priceflip1 != BarsCount+4) and buysetup
buyovershoot1 = barssince(priceflip1 != BarsCount+5) and buysetup
buyovershoot2 = barssince(priceflip1 != BarsCount+6) and buysetup
buyovershoot3 = barssince(priceflip1 != BarsCount+7) and buysetup

//----------//
// TD lines //
//----------//
TDbuyh = valuewhen(buy, high, 0)
TDbuyl = valuewhen(buy, low, 0)
TDsellh = valuewhen(sell, high, 0)
TDselll = valuewhen(sell, low, 0)

//----------//
//   Plots  //
//----------//

plot(SR ? TDbuyh ? TDbuyl : na : na, style=plot.style_circles, linewidth=1, color=color.red)
plot(SR ? TDselll ? TDsellh : na : na, style=plot.style_circles, linewidth=1, color=color.lime)
barcolor(Barcolor ? sell ? #FF0000 : buy ? #00FF00 : sellovershoot ? #FF66A3 : sellovershoot1 ? #FF3385 : sellovershoot2 ? #FF0066 : sellovershoot3 ? #CC0052 : buyovershoot ? #D6FF5C : buyovershoot1 ? #D1FF47 : buyovershoot2 ? #B8E62E : buyovershoot3 ? #8FB224 : na : na)

//  Strategy: (Thanks to JayRogers)
// === STRATEGY RELATED INPUTS ===
//tradeInvert     = input(defval = false, title = "Invert Trade Direction?")
// the risk management inputs
inpTakeProfit   = input(defval = 0, title = "Take Profit Points", minval = 0)
inpStopLoss     = input(defval = 0, title = "Stop Loss Points", minval = 0)
inpTrailStop    = input(defval = 100, title = "Trailing Stop Loss Points", minval = 0)
inpTrailOffset  = input(defval = 0, title = "Trailing Stop Loss Offset Points", minval = 0)

// === RISK MANAGEMENT VALUE PREP ===
// if an input is less than 1, assuming not wanted so we assign 'na' value to disable it.
useTakeProfit   = inpTakeProfit  >= 1 ? inpTakeProfit  : na
useStopLoss     = inpStopLoss    >= 1 ? inpStopLoss    : na
useTrailStop    = inpTrailStop   >= 1 ? inpTrailStop   : na
useTrailOffset  = inpTrailOffset >= 1 ? inpTrailOffset : na

// === STRATEGY - LONG POSITION EXECUTION ===
enterLong() => buy or buyovershoot or buyovershoot1 or buyovershoot2 or buyovershoot3// functions can be used to wrap up and work out complex conditions
//exitLong() => oscillator <= 0
strategy.entry(id = "Buy", long = true, when = enterLong() )// use function or simple condition to decide when to get in
//strategy.close(id = "Buy", when = exitLong() )// ...and when to get out

// === STRATEGY - SHORT POSITION EXECUTION ===
enterShort() => sell or sellovershoot or sellovershoot2 or sellovershoot3
//exitShort() => oscillator >= 0
strategy.entry(id = "Sell", long = false, when = enterShort())
//strategy.close(id = "Sell", when = exitShort() )

// === STRATEGY RISK MANAGEMENT EXECUTION ===
// finally, make use of all the earlier values we got prepped
strategy.exit("Exit Buy", from_entry = "Buy", profit = useTakeProfit, loss = useStopLoss, trail_points = useTrailStop, trail_offset = useTrailOffset)
strategy.exit("Exit Sell", from_entry = "Sell", profit = useTakeProfit, loss = useStopLoss, trail_points = useTrailStop, trail_offset = useTrailOffset)