Solide und zuverlässige SMA-Strategie für gleitende Durchschnittspositionen

Überblick
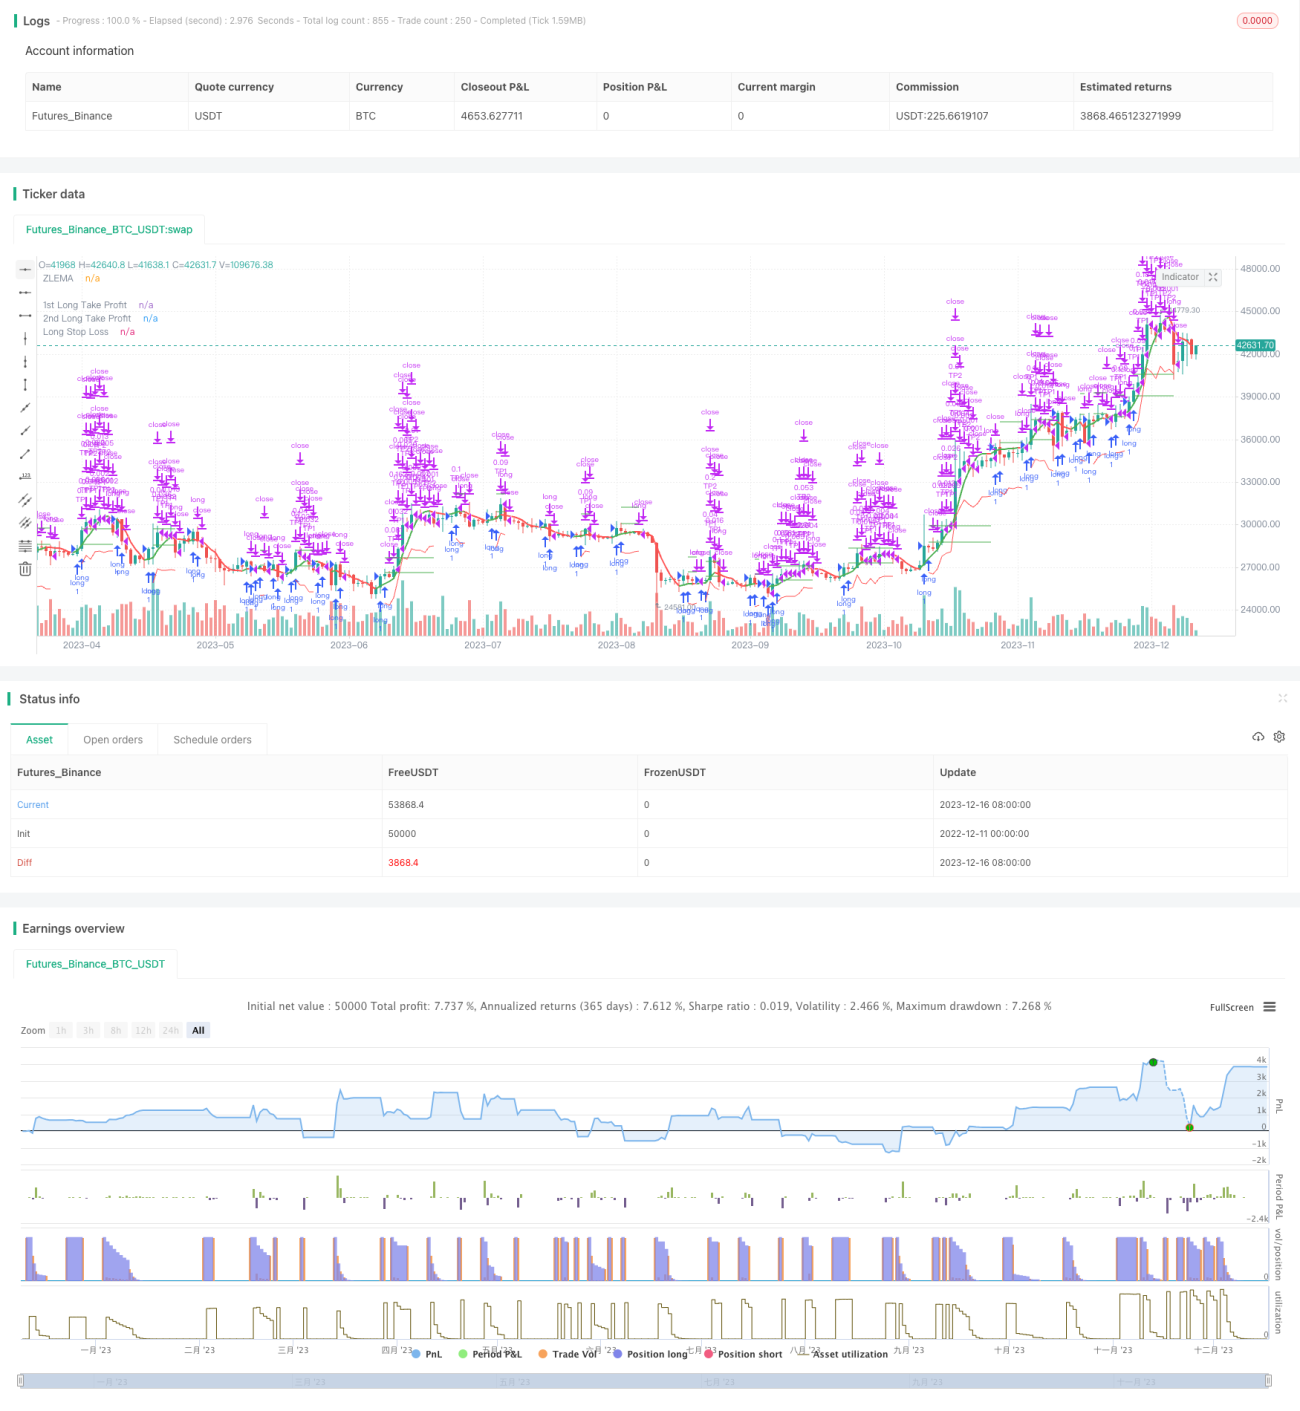
Die Strategie ist eine einfache Haltestrategie, die auf der SMA-Gewinnlinie basiert. Wenn die kurzfristige SMA-Linie die langfristige SMA-Linie durchbricht, wird eine Überposition eröffnet; wenn die kurzfristige SMA-Linie die langfristige SMA-Linie unterbricht, wird eine Off-Position gemacht.
Strategieprinzip
Die Strategie verwendet zwei SMA-Gehälter, eine kurzfristige 20-Tage-Gehälter und eine langfristige 50-Tage-Gehälter. Die kurzfristige Gehälter können die Preisentwicklung schneller erfassen, während die langfristige Gehälter den kurzfristigen Lärm filtern.
Insgesamt nutzt die Strategie die kurvenförmigen Merkmale der SMA-Mittel, um die Tendenz der Preisbewegung in zwei Zeitdimensionen zu beurteilen und mit einer eher stabilen Haltungsmethode zu profitieren.
Analyse der Stärken
Diese Strategie hat folgende Vorteile:
- Einfach zu bedienen, leicht zu verstehen, niedrige Schwelle
- Verhältnismäßige Stabilität, die von der SMA-Gewinnlinie profitiert
- Langfristige Positionen, die nicht von kurzfristigen Marktgeräuschen beeinflusst werden
- Weniger konfigurierbare Parameter, die leicht zu optimieren sind, um die optimale Kombination von Parametern zu finden
Risikoanalyse
Die Strategie birgt auch folgende Risiken:
- Wenn die Börse langfristig schwankt, ist ein Stop-Loss wahrscheinlicher.
- Die SMA-Durchschnittslinie ist nachlässig und kann keine Preisänderungen rechtzeitig erfassen.
- Unmöglichkeit, aus kurzfristigen Aufschwüngen Rückschlüsse zu ziehen
- Die Größe des Einzelschadens ist unkontrollierbar.
Optimierungsrichtung
Die Strategie kann auch in folgenden Bereichen optimiert werden:
- Zeit für einen Rückschlag auf den MACD-Index, um die Verluste in einem wackligen Zustand zu reduzieren
- Testen von SMA-Mittellinienkombinationen mit verschiedenen Parametern, um die optimale Parameter zu finden
- Die Einführung von Indicators zur Abweichung von Trends und zur Erhöhung der Genauigkeit von Positionen
- Erhöhung der Stop-Loss-Strategie und Kontrolle von Einzelschäden
Zusammenfassen
Insgesamt ist die SMA-Gewinnstrategie stabil, einfach und einfach zu bedienen und für Anfänger am Markt geeignet. Mit der fortlaufenden Entwicklung von Quantifizierungsgeschäften kann die Strategie mit mehr Indikatoren und technischen Mitteln optimiert werden, um bessere Ergebnisse zu erzielen.
- 1