Ichimoku Candlestick Breakout Strategie
Überblick
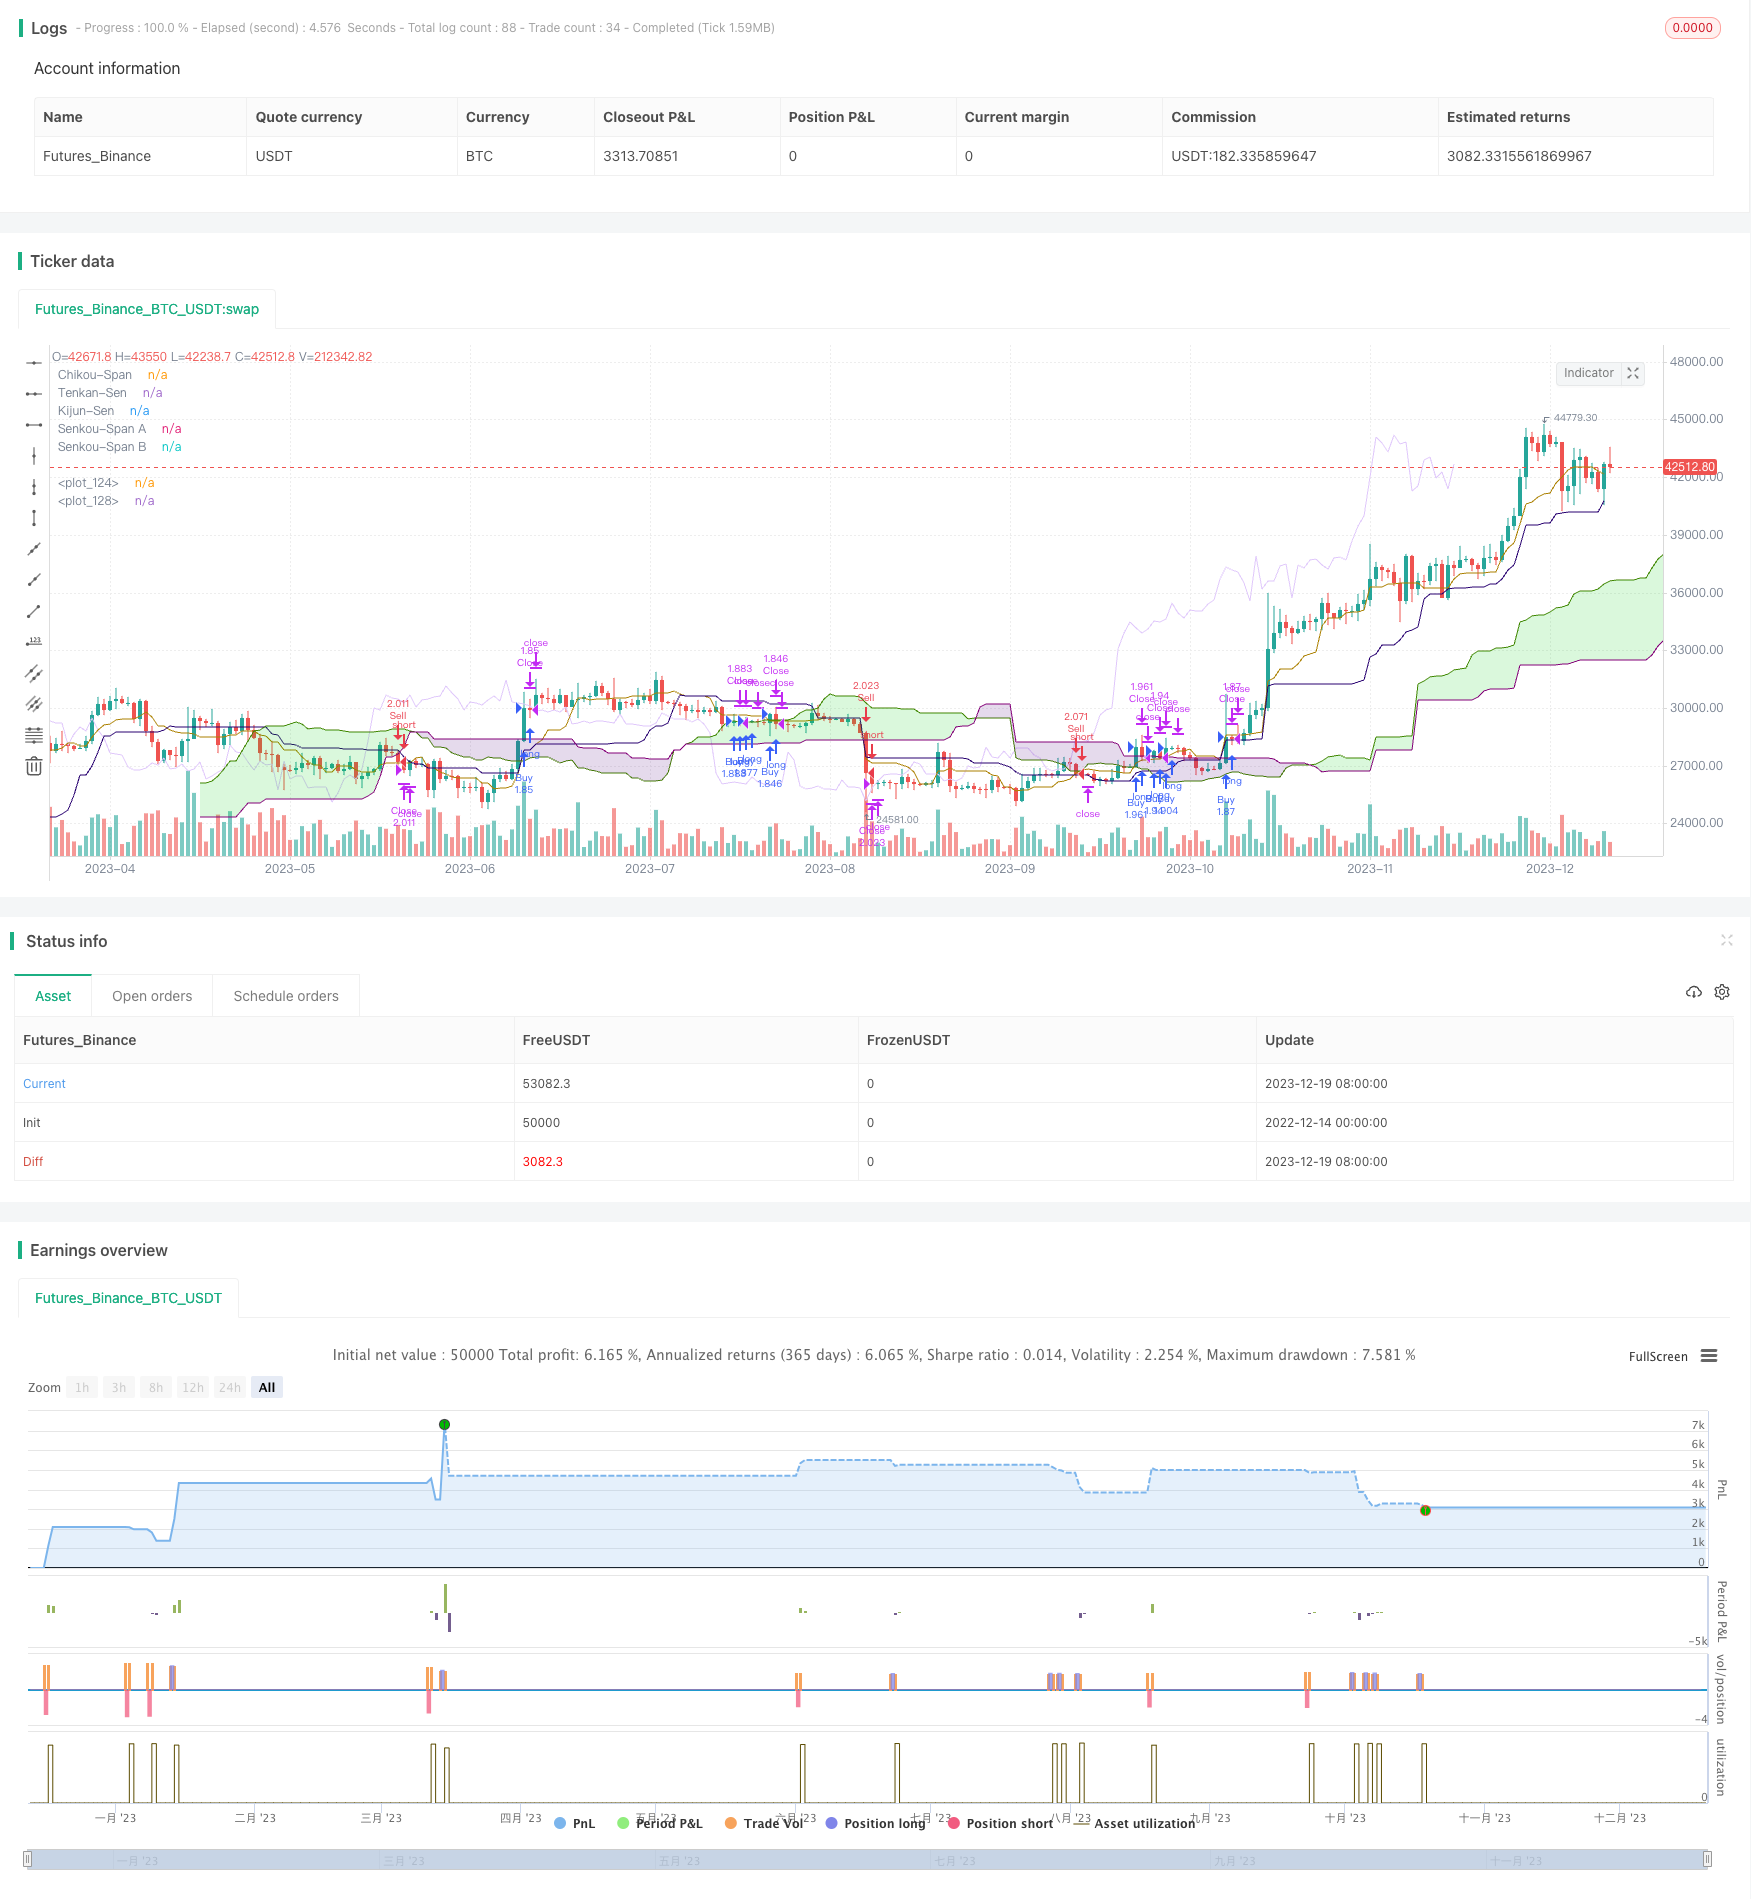
Die Strategie basiert auf dem sehr bekannten Ichimoku Kinko Hyo-Indikator, der in der technischen Analyse der Märkte verwendet wird. Die Cloud-Graphik und die Beziehung zwischen dem Preis und der Cloud werden verwendet, um die Richtung des Trends zu bestimmen, um Handelschancen zu entdecken. Die Strategie erzeugt ein Handelssignal, wenn der Preis die Cloud durchbricht.
Strategieprinzip
Die Strategie verwendet mehrere Komponenten des Ichimoku Kinko Hyo-Indikators, darunter die Umschaltungslinie (Tenkan-Sen), die Basislinie (Kijun-Sen), die Vorlauflinie (Senkou Span A), die Vorreiterlinie (Senkou Span B) und die Rückstandslinie (Chikou Span). Diese Linien bilden zusammen die sogenannte Ichimoku-Wolke.
Insbesondere basiert die Strategie darauf, ob der Preis die Wolke durchbricht. Die beiden Linien Senkou Span A und Senkou Span B bilden die Wolke. Ein Kaufsignal wird erzeugt, wenn der Kurs die Wolke überschreitet.
Die Strategie setzt außerdem Stop-Loss- und Stop-Stop-Preise fest. Die Verlustpunkte werden mithilfe von syminfo.pointvalue und Strategie-Positionsinformationen berechnet und in den konkreten Preis umgewandelt.
Analyse der Stärken
Die Strategie hat folgende Vorteile:
- Mit dem Ichimoku-Indikator kann die Richtung der Trends ermittelt werden, wodurch Marktgeräusche effektiv gefiltert und mittlere und längere Trends identifiziert werden.
- Durchbruch von Wolken als Signal zur Vermeidung von Verlusten durch falsche Durchbrüche
- In Kombination mit Stop-Loss- und Stop-Stop-Einstellungen können einzelne Verluste begrenzt und Gewinne gesperrt werden
- Parameter sind anpassbar und können die Auswirkungen verschiedener Parameter auf die Strategie-Performance testen
- Visualisierung der Wolken und anderer Ichimoku-Komponenten, die ein intuitives Graphik-Trading-Signal bilden
Risikoanalyse
Die Strategie birgt auch Risiken:
- In der Zentral- und Langzeitsteuerung könnte es zu größeren Verlusten kommen.
- Ein Durchbruchsignal könnte zurückbleiben und den besten Einstiegspunkt verpassen.
- Falsche Durchbrüche können zu Fehlschlägen und Verlusten führen
- Übermäßige Haltedauer und hohe Derivatekosten
- Die eingestellten Stop-Loss- und Stop-Stop-Preise können überschritten werden
Gegenmaßnahmen:
- Verkürzung der Haltungsdauer und Verringerung des Einzelschuldenrisikos
- Wirksamkeit von Durchbruchsignalen in Kombination mit anderen Indikatoren
- Erhöhung der Wirksamkeit von Schadensschutz und Vermeidung von Einschlüssen
- Optimierung der Laufzeit und Senkung der Kosten
Optimierungsrichtung
Diese Strategie kann in folgenden Bereichen optimiert werden:
- Verschiedene Parameterkombinationen zu testen, um die optimale Parameter zu finden
- Filterung von Signalen in Verbindung mit anderen Indikatoren, um falsche Durchbrüche zu vermeiden
- Dynamische Anpassung des Stop-Loss-Niveaus, Trails Stop Loss
- Benutzerdefinierte Ausstiegsbedingungen: Durchbruch des Cloud-Rückschlagsignals, Trigger des Preisrücktritts
- Hinzufügen eines Positionsmanagementsystems
Zusammenfassen
Die Ichimoku-Signal- und Stop-Loss-Strategie ist eine typische Strategie, mit der die Ichimoku Kinko Hyo-Indikatoren verwendet werden, um die Richtung der mittleren und langen Linie zu bestimmen. Es hat Vorteile wie Parameterstabilität, intuitive Form und visuelle Signale. Es gibt auch einige Probleme wie das Risiko eines falschen Durchbruchs und das Risiko einer Position.
/*backtest
start: 2022-12-14 00:00:00
end: 2023-12-20 00:00:00
period: 1d
basePeriod: 1h
exchanges: [{"eid":"Futures_Binance","currency":"BTC_USDT"}]
*/

//@version=5
// This source code is subject to the terms of the Mozilla Public License 2.0 at https://mozilla.org/MPL/2.0/
// © moneyofthegame
// Basado en estrategias con el indicador ICHIMOKU KINKO HIYO
// El tiempo es oro colega :)

//@version=5
strategy('Ichimoku Cloud Estrategia Ruptura Nubes SWING TRADER  (By Insert Cheese)', shorttitle='Ichimoku Cloud Estrategia Ruptura Nubes SWING TRADER  (By Insert Cheese)',

         overlay=true,
         initial_capital=500,
         process_orders_on_close=true,
         default_qty_type=strategy.percent_of_equity,
         default_qty_value=100,
         commission_type=strategy.commission.percent,
         commission_value=0.05,
         currency=currency.NONE)


// Inputs: Ichimoku parametros
ts_bars =   input.int(9,  minval=1, title='Tenkan-Sen ',          group='Parámetros Ichimoku')
ks_bars =   input.int(26, minval=1, title='Kijun-Sen ',           group='Parámetros Ichimoku')
ssb_bars =  input.int(52, minval=1, title='Senkou-Span B ',       group='Parámetros Ichimoku')
cs_offset = input.int(26, minval=1, title='Chikou-Span',          group='Parámetros Ichimoku')
ss_offset = input.int(26, minval=1, title='Senkou-Span A',        group='Parámetros Ichimoku')

middle(len) => // LONGITITUD Ichimoku (SenkouB)
    math.avg(ta.lowest(len), ta.highest(len))

// Ichimoku Componentes
tenkan = middle (ts_bars)
kijun   = middle (ks_bars)
senkouA = math.avg(tenkan, kijun)
senkouB = middle (ssb_bars)


// Plot Ichimoku Kinko Hyo
plot(tenkan,                                     color=color.rgb(171, 128, 0),                              title="Tenkan-Sen",    display = display.none)
plot(kijun,                                      color=color.rgb(39, 0, 112),                               title="Kijun-Sen",     display = display.none)
plot(close, offset=-cs_offset+1,                 color=color.rgb(224, 200, 251),                            title="Chikou-Span",   display = display.none)
sa=plot(senkouA, offset=ss_offset-1,             color=color.rgb(68, 128, 0),                               title="Senkou-Span A", display = display.none)
sb=plot(senkouB, offset=ss_offset-1,             color=color.rgb(131, 0, 120),                              title="Senkou-Span B", display = display.none)
fill(sa, sb, color = senkouA > senkouB ?         color.rgb(0, 211, 11, 82) : color.rgb(75, 0, 126, 82),   title="Cloud color")

// Calculating
ss_high = math.max(senkouA[ss_offset - 1], senkouB[ss_offset - 1])  //parte alta de la nube
ss_low = math.min(senkouA[ss_offset - 1], senkouB[ss_offset - 1])   //parte baja de la nube
ss_medium = ss_low + (ss_high - ss_low) / 2                         //parte intermedia


// Input para seleccionar largos o cortos
long_entry_enable =  input.bool(true, title='Entradas Largo',   group='Backtest Operativa', inline='SP20')
short_entry_enable = input.bool(true, title='Entradas Corto',   group='Backtest Operativa', inline='SP20')

// Input backtest rango de fechas
fromMonth =  input.int  (defval=1,     title='Desde Mes',  minval=1,     maxval=12,      group='Backtest rango de fechas')
fromYear  =  input.int  (defval=2000,  title='Desde Año',  minval=1970,                  group='Backtest rango de fechas')
fromDay   =  input.int  (defval=1,     title='Desde Día',  minval=1,     maxval=31,      group='Backtest rango de fechas')
thruDay   =  input.int  (defval=1,     title='Hasta Día',  minval=1,     maxval=31,      group='Backtest rango de fechas')
thruMonth =  input.int  (defval=1,     title='Hasta Mes',  minval=1,     maxval=12,      group='Backtest rango de fechas')
thruYear  =  input.int  (defval=2099,  title='Hasta Año',  minval=1970,                  group='Backtest rango de fechas')

inDataRange = time >= timestamp(syminfo.timezone, fromYear, fromMonth, fromDay, 0, 0) and time < timestamp(syminfo.timezone, thruYear, thruMonth, thruDay, 0, 0)


//Estrategia

// Señales de entrada y salida

price_above_kumo = close  > ss_high // precio cierra arriba de la nube
price_below_kumo = close  < ss_low // precio cierra abajo de la nube
price_cross_above_kumo = ta.crossover  (close  , ss_high )   //precio cruza la nube parte alta
price_cross_below_kumo = ta.crossunder (close  , ss_low )     // precio cruza la nube parte baja

bullish = (price_above_kumo and price_cross_above_kumo)
bearish = (price_below_kumo and price_cross_below_kumo)

comprado = strategy.position_size > 0
vendido = strategy.position_size  < 0

sl_long =  price_above_kumo
sl_short = price_below_kumo


if ( not comprado and bullish and inDataRange and long_entry_enable)
//realizar compra
    strategy.entry("Buy", strategy.long)

//realizar salida long
if (comprado and bearish and inDataRange and long_entry_enable)
    strategy.close ("Buy", comment = "cerrado")

if ( not vendido and bearish and inDataRange and short_entry_enable)
//realizar venta
    strategy.entry("Sell", strategy.short)

//realizar salida long
if (vendido  and bullish and inDataRange and short_entry_enable)
    strategy.close ("Buy", comment = "cerrado")

// Función Calcular TP y SL

// Inputs para SL y TP


tpenable = input.bool(true, title =  "SL y TP metodo")


moneyToSLPoints(money)  =>
    strategy.position_size !=0 and tpenable ?  (money / syminfo.pointvalue / math.abs (strategy.position_size)) / syminfo.mintick : na

p = moneyToSLPoints(input.float(  100.0, minval=0.1, step=10.0, title = "Take Profit $$"))
l = moneyToSLPoints(input.float(  100.0, minval=0.1, step=10.0, title = "Stop Loss $$"))
strategy.exit("Close", profit = p, loss = l)


// debug plots for visualize SL & TP levels
pointsToPrice(pp) =>
    na(pp) ? na : strategy.position_avg_price + pp * math.sign(strategy.position_size) * syminfo.mintick

pp = plot(pointsToPrice(p),color = color.rgb(76, 175, 79, 96), style = plot.style_linebr )
lp = plot(pointsToPrice(-l),color = color.rgb(76, 175, 79, 96), style = plot.style_linebr )
avg = plot( strategy.position_avg_price, color = color.rgb(76, 175, 79, 96), style = plot.style_linebr )
fill(pp, avg, color = color.rgb(76, 175, 79, 96))
fill(avg, lp, color = color.rgb(255, 82, 82, 97))