
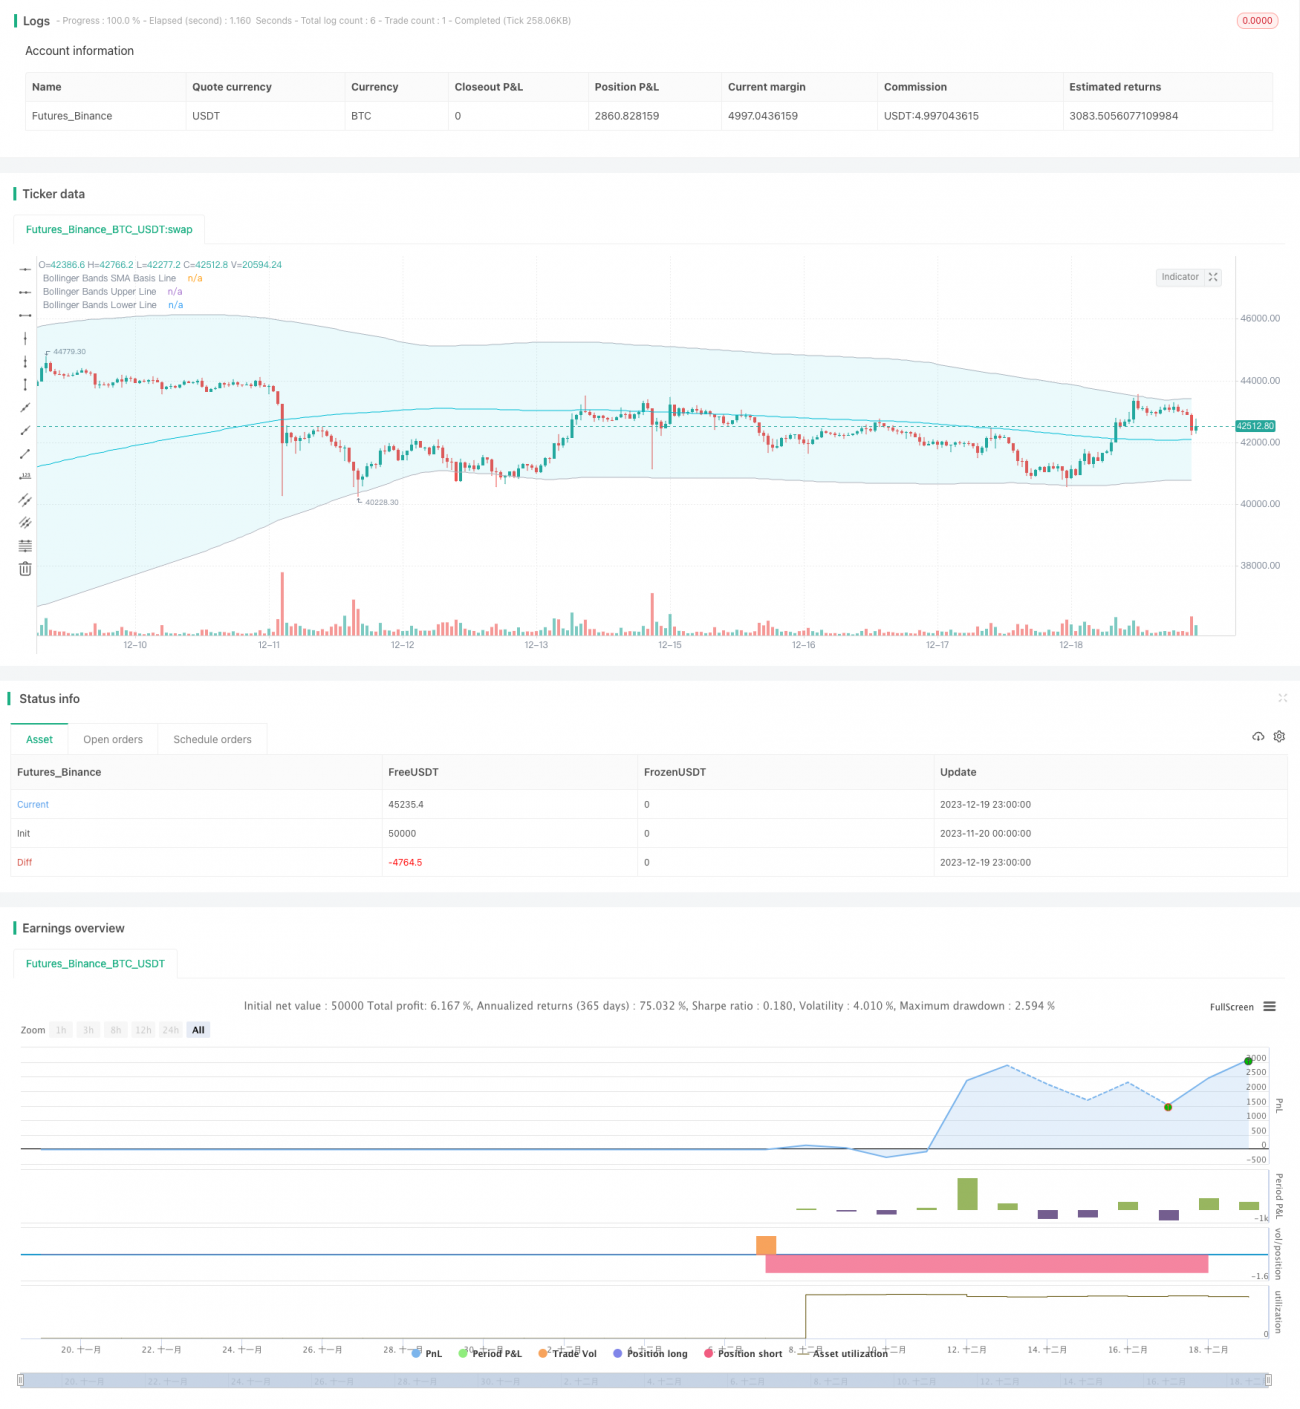
Diese Strategie wird als RSI Bollinger Bands TP/SL Strategie bezeichnet. Die Strategie kombiniert den RSI- und Bollinger-Band-Indikator und ermöglicht Trendpositionierung und Breakout-Handel.
Der RSI-Indikator kann beurteilen, ob eine Aktie im Überkauf-Überverkauf-Bereich ist. Wenn der RSI größer als die eingestellte Überkauf- und kleiner als die eingestellte Überverkaufsgrenze ist, ist er überkauft. Die Strategie setzt die Überkauflinie auf 50 und die Überverkaufsgrenze auf 50.
Die Brin-Band berechnet die Standarddifferenz des Aktienpreises und ergibt die Auf- und Abwärtsbahn des Aktienpreises. Die obere Bahn ist die Widerstandslinie, die untere Bahn ist die Unterstützungslinie.
Wenn der RSI-Indikator ein unteres Umkehrsignal zeigt und der Aktienpreis den Bollinger-Band überschreitet, wird angenommen, dass der Kurs von unten nach oben umgekehrt ist, und das ist ein Überschuss. Wenn der RSI-Indikator ein oberes Umkehrsignal zeigt und der Aktienpreis den Bollinger-Band überschreitet, wird angenommen, dass der Kurs von oben nach unten umgekehrt ist, und der Kurs ist leer.
Der RSI-Indikator und der Brin-Band-Indikator werden verwendet, um Trends und Wendepunkte zu ermitteln. In Kombination mit ihnen kann die Genauigkeit der Identifizierung von echten Kauf- und Verkaufssignalen verbessert und falsche Durchbrüche vermieden werden.
Die Strategie setzt einen Stop-Loss-Punkt ein, um den Einstiegspreis zu erhöhen.*Der Stop-Loss ist der Einstiegspreis.*Das ist der Unterschied zu einem Stop-Loss-Verhältnis, bei dem man die Gewinne sichern kann, um Verluste zu vermeiden und Risiken zu kontrollieren.
Die Strategie bietet die Möglichkeit, nur zu handeln, nur zu handeln oder in beide Richtungen zu handeln. Der Benutzer kann die verschiedenen Richtungen wählen, je nach Marktsituation, und die Risiken flexibel kontrollieren.
Die Standardgröße des Brinbands beeinflusst die Breite des Brinbands und beeinflusst somit die Erzeugung von Handelssignalen. Wenn die Parameter nicht richtig eingestellt sind, kann dies zu einer großen Anzahl von Fehlsignalen führen.
Die Stop-Loss-Einstellungen können zu radikal sein, um unnötige Verluste zu verursachen, wenn eine V-Rückkehr eintritt.
Die Parameter des RSI beeinflussen auch die Form der RSI-Kurve. Wenn die RSI-Parameter falsch eingestellt sind, wird die Genauigkeit des RSI-Umkehrsignals verringert.
Weitere RSI-Längenparameter können getestet werden, um die optimale Parameterkombination zu finden.
Es gibt mehrere Arten von Brin-Bandlängen und Standarddifferenz-Parametern, die getestet werden können, um die optimale Kombination zu finden.
Die optimale Stop-Loss-Ratio-Parameter können durch Rückmessung gefunden werden.
Diese Strategie verwendet die RSI- und Bollinger-Band-Indikatoren, um Trends und Umkehrungen zu erkennen. Die Stop-Loss-Mechanismen enthalten Risikokontrollen, die automatisch Kauf- und Verkaufspunkte identifizieren und Stop-Loss-Stopps rechtzeitig einstellen können. Die Strategie birgt auch gewisse Risiken und kann hauptsächlich durch Parameteroptimierung verbessert werden.
/*backtest
start: 2023-11-20 00:00:00
end: 2023-12-20 00:00:00
period: 1h
basePeriod: 15m
exchanges: [{"eid":"Futures_Binance","currency":"BTC_USDT"}]
*/
// This source code is subject to the terms of the Mozilla Public License 2.0 at https://mozilla.org/MPL/2.0/
// © BigCoinHunter
//@version=5
strategy(title="RSI_Boll-TP/SL", overlay=true,
pyramiding=0, default_qty_type=strategy.percent_of_equity,
default_qty_value=100, initial_capital=1000,
currency=currency.USD, commission_value=0.05,
commission_type=strategy.commission.percent,
process_orders_on_close=true)
//----------- get the user inputs --------------
//---------- RSI -------------
price = input(close, title="Source")
RSIlength = input.int(defval=6,title="RSI Length")
RSIoverSold = input.int(defval=50, title="RSI OverSold", minval=1)
RSIoverBought = input.int(defval=50, title="RSI OverBought", minval=1)
//------- Bollinger Bands -----------
BBlength = input.int(defval=200, title="Bollinger Period Length", minval=1)
BBmult = input.float(defval=2.0, minval=0.001, maxval=50, step=0.1, title="Bollinger Bands Standard Deviation")
BBbasis = ta.sma(price, BBlength)
BBdev = BBmult * ta.stdev(price, BBlength)
BBupper = BBbasis + BBdev
BBlower = BBbasis - BBdev
source = close
buyEntry = ta.crossover(source, BBlower)
sellEntry = ta.crossunder(source, BBupper)
plot(BBbasis, color=color.aqua, title="Bollinger Bands SMA Basis Line")
p1 = plot(BBupper, color=color.silver, title="Bollinger Bands Upper Line")
p2 = plot(BBlower, color=color.silver, title="Bollinger Bands Lower Line")
fill(plot1=p1, plot2=p2, title="Bollinger BackGround", color=color.new(color.aqua,90), fillgaps=false, editable=true)
//---------- input TP/SL ---------------
tp = input.float(title="Take Profit:", defval=0.0, minval=0.0, maxval=100.0, step=0.1) * 0.01
sl = input.float(title="Stop Loss: ", defval=0.0, minval=0.0, maxval=100.0, step=0.1) * 0.01
longEntry = input.bool(defval=true, title= 'Long Entry', inline="11")
shortEntry = input.bool(defval=true, title='Short Entry', inline="11")
//---------- backtest range setup ------------
fromDay = input.int(defval = 1, title = "From Day", minval = 1, maxval = 31)
fromMonth = input.int(defval = 1, title = "From Month", minval = 1, maxval = 12)
fromYear = input.int(defval = 2021, title = "From Year", minval = 2010)
toDay = input.int(defval = 30, title = "To Day", minval = 1, maxval = 31)
toMonth = input.int(defval = 12, title = "To Month", minval = 1, maxval = 12)
toYear = input.int(defval = 2042, title = "To Year", minval = 2010)
//------------ time interval setup -----------
start = timestamp(fromYear, fromMonth, fromDay, 00, 00) // backtest start window
finish = timestamp(toYear, toMonth, toDay, 23, 59) // backtest finish window
window() => time >= start and time <= finish ? true : false // create function "within window of time"
//------- define the global variables ------
var bool long = true
var bool stoppedOutLong = false
var bool stoppedOutShort = false
//--------- Colors ---------------
TrendColor = RSIoverBought and (price[1] > BBupper and price < BBupper) and BBbasis < BBbasis[1] ? color.red : RSIoverSold and (price[1] < BBlower and price > BBlower) and BBbasis > BBbasis[1] ? color.green : na
//bgcolor(switch2?(color.new(TrendColor,50)):na)
//--------- calculate the input/output points -----------
longProfitPrice = strategy.position_avg_price * (1 + tp) // tp -> take profit percentage
longStopPrice = strategy.position_avg_price * (1 - sl) // sl -> stop loss percentage
shortProfitPrice = strategy.position_avg_price * (1 - tp)
shortStopPrice = strategy.position_avg_price * (1 + sl)
//---------- RSI + Bollinger Bands Strategy -------------
vrsi = ta.rsi(price, RSIlength)
rsiCrossOver = ta.crossover(vrsi, RSIoverSold)
rsiCrossUnder = ta.crossunder(vrsi, RSIoverBought)
BBCrossOver = ta.crossover(source, BBlower)
BBCrossUnder = ta.crossunder(source, BBupper)
if (not na(vrsi))
if rsiCrossOver and BBCrossOver
long := true
if rsiCrossUnder and BBCrossUnder
long := false
//------------------- determine buy and sell points ---------------------
buySignall = window() and long and (not stoppedOutLong)
sellSignall = window() and (not long) and (not stoppedOutShort)
//---------- execute the strategy -----------------
if(longEntry and shortEntry)
if long
strategy.entry("LONG", strategy.long, when = buySignall, comment = "ENTER LONG")
stoppedOutLong := true
stoppedOutShort := false
else
strategy.entry("SHORT", strategy.short, when = sellSignall, comment = "ENTER SHORT")
stoppedOutLong := false
stoppedOutShort := true
else if(longEntry)
strategy.entry("LONG", strategy.long, when = buySignall)
strategy.close("LONG", when = sellSignall)
if long
stoppedOutLong := true
else
stoppedOutLong := false
else if(shortEntry)
strategy.entry("SHORT", strategy.short, when = sellSignall)
strategy.close("SHORT", when = buySignall)
if not long
stoppedOutShort := true
else
stoppedOutShort := false
//----------------- take profit and stop loss -----------------
if(tp>0.0 and sl>0.0)
if ( strategy.position_size > 0 )
strategy.exit(id="LONG", limit=longProfitPrice, stop=longStopPrice, comment="Long TP/SL Trigger")
else if ( strategy.position_size < 0 )
strategy.exit(id="SHORT", limit=shortProfitPrice, stop=shortStopPrice, comment="Short TP/SL Trigger")
else if(tp>0.0)
if ( strategy.position_size > 0 )
strategy.exit(id="LONG", limit=longProfitPrice, comment="Long TP Trigger")
else if ( strategy.position_size < 0 )
strategy.exit(id="SHORT", limit=shortProfitPrice, comment="Short TP Trigger")
else if(sl>0.0)
if ( strategy.position_size > 0 )
strategy.exit(id="LONG", stop=longStopPrice, comment="Long SL Trigger")
else if ( strategy.position_size < 0 )
strategy.exit(id="SHORT", stop=shortStopPrice, comment="Short SL Trigger")