Momentum Breakout Moving Average Handelsstrategie
Überblick
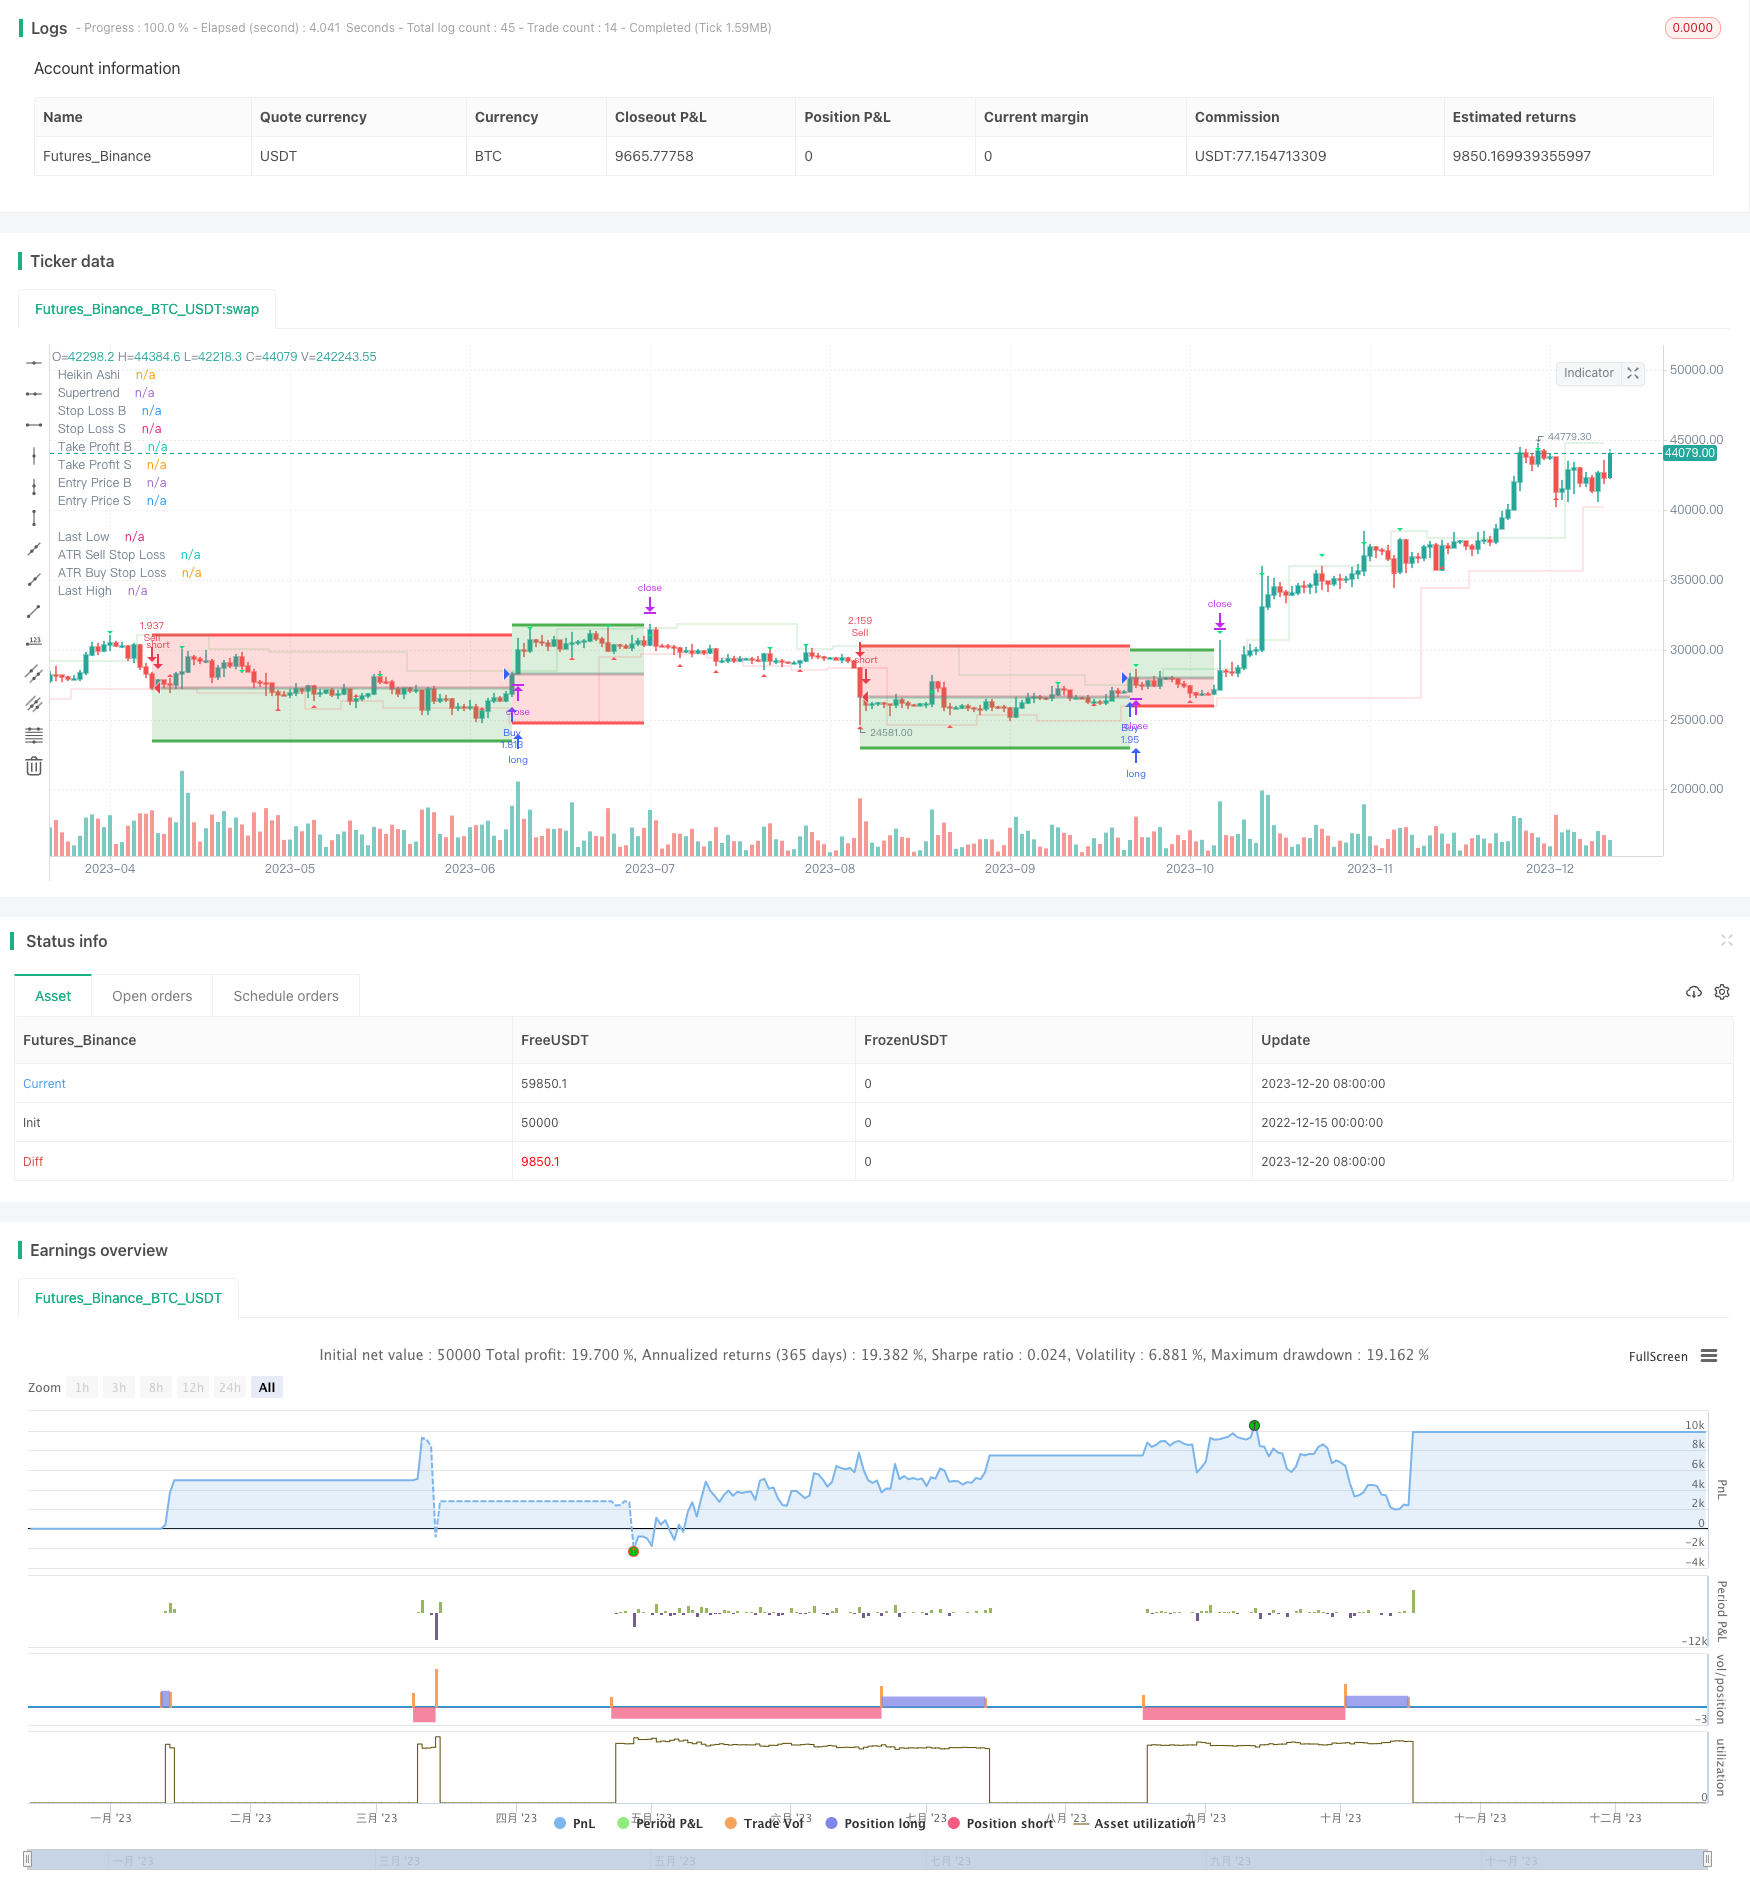
Die Strategie nutzt Supertrend-Indikatoren, um die Richtung der Markttrends zu erkennen und in Kombination mit der Heikin Ashi-Platte-Formatur zum Börsengang zu gelangen. Die Strategie bietet außerdem eine Stop-Loss- und Stop-Stop-Funktion, um Verluste zu sperren.
Strategieprinzip
Der Supertrend-Indikator wird verwendet, um die Richtung des Markttrends zu bestimmen. Dieser Indikator basiert auf dem durchschnittlichen realen Schwankungsbereich und bestimmten Multiplikatoren, um Auf- und Abtrieb zu bestimmen. Wenn der Preis den Auftrieb durchbricht, ist dies ein bullish Signal und umgekehrt ein bearish Signal.
In Kombination mit dem Heikin Ashi Graphik-Form-Filter zum Markteintritt. Wenn der Supertrend-Indikator ein Signal sendet, macht Heikin Ashi mehr, wenn er positiv ist, und macht nichts, wenn er negativ ist.
Die Strategie bietet mehrere Stop-Methoden, wie zum Beispiel Proportionsstop, Fixed Stop, Average True Stopp, Pivot Stop. Die Stop-Methode enthält Proportionsstop, Fixed Stop, Risk Return Comparison Stop usw.
Analyse der Stärken
Der Supertrend-Indikator kann die Markttrends effektiv verfolgen und verhindert, dass wichtige Handelschancen verpasst werden.
Heikin Ashi filtert die Zeit, die für die Markteinführung benötigt wird, um unnötige Transaktionen zu reduzieren und die Gewinnquote zu erhöhen.
Es gibt eine Vielzahl von Optionen, die individuell eingestellt werden können, um das Risiko zu kontrollieren.
Sie können wählen, ob Sie bei neuen Signalen aktiv wieder platzieren möchten, um sicherzustellen, dass Sie den neuesten Trends folgen.
Risikoanalyse
Der Supertrend-Indikator reagiert auf Marktveränderungen nicht schnell genug und kann einen Trendwendepunkt verpassen.
Die Heikin Ashi-Formfilter können nicht vollständig das Auftreten von Verlustgeschäften vermeiden.
Ein falsches Stop-Loss-System kann zu früh oder zu viel Verlust verursachen.
Häufige Wiederholungen führen zu höheren Transaktionskosten und einem Risiko für Ausrutscher.
Diese Risiken können durch die Anpassung der Supertrend-Indikatorparameter und die Kombination anderer Indikatoren als Filter und Optimierung des Stop-Loss-Stopps verringert werden.
Optimierungsrichtung
Anpassung der Parameter des Supertrend-Indikators auf die optimale Kombination der Parameter.
Versuchen Sie, verschiedene Preisdaten als Berechnungsquellen für Supertrend-Indikatoren zu verwenden, wie z. B. den Schlusskurs, den Durchschnittspreis usw.
Hinzufügen von Filtern für andere Indikatoren, z. B. KDJ, Moving Average usw.
Optimierung der Stop-Loss-Stopp-Einstellungen für ein optimales Risiko-Gewinn-Verhältnis.
Testen Sie die Wirksamkeit von Positionen mit einer festen Anzahl oder einem Kapitalverhältnis.
Zusammenfassen
Die Strategie integriert Supertrend-Indikatoren und Heikin Ashi-Technologie, um die Markttrend-Einnahmen effektiv zu erzielen, indem sie die Richtung der Trends verfolgt und den richtigen Zeitpunkt für die Markteinführung wählt. Die flexible Stop-Loss-Setup ermöglicht auch die Risikokontrolle. Die Strategie kann durch die Optimierung der Parameter und die Erhöhung anderer Filterbedingungen weiter verbessert werden.
/*backtest
start: 2022-12-15 00:00:00
end: 2023-12-21 00:00:00
period: 1d
basePeriod: 1h
exchanges: [{"eid":"Futures_Binance","currency":"BTC_USDT"}]
*/


//# * —————————————————————————————————————————————————————————————————————————————————————————————————————————————————————
//# *
//# *  Script       |  [MT Trader] Backtest Template w/ Supertrend Strategy
//# *  Description  |  Small template open source made in pinescript with the purpose of testing
//# *                  different strategies and how they could be improved
//# *
//# *  Author       |  ©VertMT
//# *
//# *  Pinescript   |  https://www.tradingview.com/pine-script-docs/en/v5/Introduction.html
//# *                 @version=5
//# *
//# *  Revision History
//# *    Release    |  Jul 30, 2022  | Initial Release
//# *
//# *
//# *  Reference    |  https://tradingview.com/script/wzevYXew-TEMPLATE-Code-Block-Comments/
//# *
//# *
//# *    ███▄ ▄███▓ ▄▄▄█████▓
//# *   ▓██▒▀█▀ ██▒ ▓  ██▒ ▓▒
//# *   ▓██    ▓██░ ▒ ▓██░ ▒░
//# *   ▒██    ▒██  ░ ▓██▓ ░
//# *   ▒██▒   ░██▒   ▒██▒ ░
//# *   ░ ▒░   ░  ░   ▒ ░░
//# *   ░  ░      ░     ░
//# *   ░      ░      ░
//# *
//# * —————————————————————————————————————————————————————————————————————————————————————————————————————————————————————

//@version=5
strategy("[MT Trader] Backtest template w/ SuperTrend Strategy", overlay=true, pyramiding = 0, calc_on_order_fills = false, commission_type = strategy.commission.percent, commission_value = 0.03, default_qty_type = strategy.percent_of_equity, default_qty_value = 100, initial_capital=100, currency=currency.USD, process_orders_on_close=true, backtest_fill_limits_assumption=0)


// ————————————————————————————————————————————————————————————————————————————————————————————————————————————————————————
// —————————————————————————————————————— 1. 📆 Timeframe 📆 ——————————————————————————————————————————————————————————————
//# * —————————————————————————————————————————————————————————————————————————————————————————————————————————————————————
//# *
//# *        In this section you can configure the strategy so that it only runs between 2
//# *               time periods, being also able to adjust to any time zone.
//# *
//# *        En este apartado se puede configurar la estrategia para que solo se ejecute entre
//# *        2 periodos de tiempo, siendo capaz tambien de ajustarse a cualquier zona horaria.
//# *
// ————————————————————————————————————————————————————————————————————————————————————————————————————————————————————————


dateFilter  = input.bool(group='📆 Timeframe 📆', defval=false)
startTime   = input(group='📆 Timeframe 📆', defval=timestamp('01 Jan 2022 00:00'), title='Start Time')
endTime     = input(group='📆 Timeframe 📆', defval=timestamp('31 Dec 2022 23:45'), title='End Time')
zoneTime    = input.string("UTC", options = ["UTC-10", "UTC-8", "UTC-7", "UTC-6", "UTC-5", "UTC-4", "UTC-3", "UTC", "UTC+1", "UTC+2", "UTC+3", "UTC+4", "UTC+4:30", "UTC+5", "UTC+5:30", "UTC+6", "UTC+7", "UTC+8", "UTC+9", "UTC+9:30", "UTC+10", "UTC+11", "UTC+12", "UTC+12:45", "UTC+13"], title='UTC', group='📆 Timeframe 📆', tooltip="Match this time zone with that of your graph so that all values are displayed correctly. \n\nHaga coincidir esta zona horaria con la de su gráfico para que todos los valores se muestren correctamente.")

cTime = timestamp(year(timenow), month(timenow), dayofmonth(timenow), hour(timenow), minute(timenow))
sTime = timestamp(year(startTime), month(startTime), dayofmonth(startTime), hour(startTime), minute(startTime), second(startTime))
eTime = timestamp(year(endTime), month(endTime), dayofmonth(endTime), hour(endTime), minute(endTime), second(endTime))

bgcolor(dateFilter and time == sTime or dateFilter and time == eTime?color.new(color.white, 80):na, title="Date Range")
plotshape(dateFilter and time == sTime, title="Start Time", style=shape.labelup, location=location.belowbar, color=color.white, text="Start", textcolor=color.black, size=size.tiny)
plotshape(dateFilter and time == eTime, title="End Time",   style=shape.labelup, location=location.belowbar, color=color.white, text="End",   textcolor=color.black, size=size.tiny)

zcTime = zoneTime == "UTC-10" ? cTime - 10*60*60000 : zoneTime == "UTC-8" ? cTime - 8*60*60000 : zoneTime == "UTC-7" ? cTime - 7*60*60000 : zoneTime == "UTC-6" ? cTime - 6*60*60000 : zoneTime == "UTC-5" ? cTime - 5*60*60000 : zoneTime == "UTC-4" ? cTime - 4*60*60000 : zoneTime == "UTC-3" ? cTime - 3*60*60000 : zoneTime == "UTC" ? cTime - 0*60*60000 : zoneTime == "UTC+1" ? cTime + 1*60*60000 :  zoneTime == "UTC+2" ? cTime + 2*60*60000 : zoneTime == "UTC+3" ? cTime + 3*60*60000 : zoneTime == "UTC+4" ? cTime + 4*60*60000 : zoneTime == "UTC+4:30" ? cTime + 4*60*60000 + 30*60000 : zoneTime == "UTC+5" ? cTime + 5*60*60000 : zoneTime == "UTC+5" ? cTime + 5*60*60000 + 30*60000 : zoneTime == "UTC+6" ? cTime + 6*60*60000 : zoneTime == "UTC+7" ? cTime + 7*60*60000 : zoneTime == "UTC+8" ? cTime + 8*60*60000 : zoneTime == "UTC+9" ? cTime + 9*60*60000 : zoneTime == "UTC+9" ? cTime + 9*60*60000 + 30*60000 : zoneTime == "UTC+10" ? cTime + 10*60*60000 : zoneTime == "UTC+11" ? cTime + 11*60*60000 : zoneTime == "UTC+12" ? cTime + 12*60*60000 : zoneTime == "UTC+12:45" ? cTime + 12*60*60000 + 45*60000 : zoneTime == "UTC+13" ? cTime + 13*60*60000 : 0
zsTime = zoneTime == "UTC-10" ? sTime - 10*60*60000 : zoneTime == "UTC-8" ? sTime - 8*60*60000 : zoneTime == "UTC-7" ? sTime - 7*60*60000 : zoneTime == "UTC-6" ? sTime - 6*60*60000 : zoneTime == "UTC-5" ? sTime - 5*60*60000 : zoneTime == "UTC-4" ? sTime - 4*60*60000 : zoneTime == "UTC-3" ? sTime - 3*60*60000 : zoneTime == "UTC" ? sTime - 0*60*60000 : zoneTime == "UTC+1" ? sTime + 1*60*60000 :  zoneTime == "UTC+2" ? sTime + 2*60*60000 : zoneTime == "UTC+3" ? sTime + 3*60*60000 : zoneTime == "UTC+4" ? sTime + 4*60*60000 : zoneTime == "UTC+4:30" ? sTime + 4*60*60000 + 30*60000 : zoneTime == "UTC+5" ? sTime + 5*60*60000 : zoneTime == "UTC+5" ? sTime + 5*60*60000 + 30*60000 : zoneTime == "UTC+6" ? sTime + 6*60*60000 : zoneTime == "UTC+7" ? sTime + 7*60*60000 : zoneTime == "UTC+8" ? sTime + 8*60*60000 : zoneTime == "UTC+9" ? sTime + 9*60*60000 : zoneTime == "UTC+9" ? sTime + 9*60*60000 + 30*60000 : zoneTime == "UTC+10" ? sTime + 10*60*60000 : zoneTime == "UTC+11" ? sTime + 11*60*60000 : zoneTime == "UTC+12" ? sTime + 12*60*60000 : zoneTime == "UTC+12:45" ? sTime + 12*60*60000 + 45*60000 : zoneTime == "UTC+13" ? sTime + 13*60*60000 : 0
zeTime = zoneTime == "UTC-10" ? eTime - 10*60*60000 : zoneTime == "UTC-8" ? eTime - 8*60*60000 : zoneTime == "UTC-7" ? eTime - 7*60*60000 : zoneTime == "UTC-6" ? eTime - 6*60*60000 : zoneTime == "UTC-5" ? eTime - 5*60*60000 : zoneTime == "UTC-4" ? eTime - 4*60*60000 : zoneTime == "UTC-3" ? eTime - 3*60*60000 : zoneTime == "UTC" ? eTime - 0*60*60000 : zoneTime == "UTC+1" ? eTime + 1*60*60000 :  zoneTime == "UTC+2" ? eTime + 2*60*60000 : zoneTime == "UTC+3" ? eTime + 3*60*60000 : zoneTime == "UTC+4" ? eTime + 4*60*60000 : zoneTime == "UTC+4:30" ? eTime + 4*60*60000 + 30*60000 : zoneTime == "UTC+5" ? eTime + 5*60*60000 : zoneTime == "UTC+5" ? eTime + 5*60*60000 + 30*60000 : zoneTime == "UTC+6" ? eTime + 6*60*60000 : zoneTime == "UTC+7" ? eTime + 7*60*60000 : zoneTime == "UTC+8" ? eTime + 8*60*60000 : zoneTime == "UTC+9" ? eTime + 9*60*60000 : zoneTime == "UTC+9" ? eTime + 9*60*60000 + 30*60000 : zoneTime == "UTC+10" ? eTime + 10*60*60000 : zoneTime == "UTC+11" ? eTime + 11*60*60000 : zoneTime == "UTC+12" ? eTime + 12*60*60000 : zoneTime == "UTC+12:45" ? eTime + 12*60*60000 + 45*60000 : zoneTime == "UTC+13" ? eTime + 13*60*60000 : 0

tradeDateIsAllowed() =>
    dateFilter ? time >= sTime and time <= eTime : true
dateRange = tradeDateIsAllowed()


// ————————————————————————————————————————————————————————————————————————————————————————————————————————————————————————
// —————————————————————————————————————— 2. 🔰 Strategy 🔰 ———————————————————————————————————————————————————————————————
//# * —————————————————————————————————————————————————————————————————————————————————————————————————————————————————————
//# *
//# *                Here are located the options that you can use in this strategy.
//# *
//# *           Aqui se encuentran ubicados las opciones que puedes utilizar en esta estrategia.
//# *
//# *
//# *  Heikin Ashi  |  https://tradingview.com/script/U1QGgSOw-Heikin-Ashi-Source-Function-HTF/
//# *
// ————————————————————————————————————————————————————————————————————————————————————————————————————————————————————————


superTrend    =   input.bool(group='🔰 Strategy 🔰', defval=true,    title="Supertrend")
closeNewEntry =   input.bool(group='🔰 Strategy 🔰', defval=true,    title="Close Position on New Entry", tooltip="When it is active and a new alert is fired, the current position is closed to open a new one, otherwise, the operations only close when reach sl/tp \n\nCuando está activa y una nueva alerta es disparada se cierra la posicion actual para abrir una nueva, en caso contrario las operaciones solo se cierran al tocar sl/tp")
heikinPrice   =   input.bool(group='🔰 Strategy 🔰', defval=false,   title="Heikin Ashi Entry", tooltip="When activated, entries will be based on Heikin Ashi candles but executed at Japanese candles prices. Disable the border of the candles from chart settings for a better experience. \n\nCuando se active, las entradas se basarán en velas heikin ashi pero se ejecutarán a precios de velas japonesas. Deshabilite el borde de las velas desde la configuración del gráfico para una mejor experiencia.")


// —————————————————————————————————————— 1. Heikin Ashi Entry —————————————————————————————————————————————————————————————————


heikin(_src)  =>
    Close  = not heikinPrice ? close : ohlc4
    Open   = float(na)
    Open  := not heikinPrice ? open  : na(Open[1]) ? (open + close) / 2 : (nz(Open[1]) + nz(Close[1])) / 2
    High   = not heikinPrice ? high  : math.max(high, math.max(Open, Close))
    Low    = not heikinPrice ? low   : math.min(low,  math.min(Open, Close))
    HL2    = not heikinPrice ? hl2   : math.avg(High, Low)
    HLC3   = not heikinPrice ? hlc3  : math.avg(High, Low, Close)
    OHLC4  = not heikinPrice ? ohlc4 : math.avg(Open, High, Low, Close)
    HLCC4  = not heikinPrice ? ohlc4 : math.avg(High, Low, Close, Close)
    Price  = _src == 'close' ? Close : _src == 'open' ? Open : _src == 'high' ? High : _src == 'low' ? Low : _src == 'hl2' ? HL2 : _src == 'hlc3' ? HLC3 : _src == 'ohlc4' ? OHLC4 : HLCC4
    Source = math.round(Price / syminfo.mintick) * syminfo.mintick

heikinColor   = heikin('close') > heikin('open') ? #26a69a : #ef5350
plotcandle(heikin('open'), heikin('high'), heikin('low'), heikin('close'), title="Heikin Ashi", color=heikinColor, wickcolor=heikinColor, bordercolor=heikinColor)
barcolor(color=color.new(heikinPrice ? heikinColor:na, 100))

Open  = heikinPrice ? heikin('open')  : open
High  = heikinPrice ? heikin('high')  : high
Low   = heikinPrice ? heikin('low')   : low
Close = heikinPrice ? heikin('close') : close
HL2   = heikinPrice ? heikin('hl2')   : hl2
HLC3  = heikinPrice ? heikin('hl3')   : hlc3
OHLC4 = heikinPrice ? heikin('ohlc4') : ohlc4
HLCC4 = heikinPrice ? heikin('hlcc4') : hlcc4


// ————————————————————————————————————————————————————————————————————————————————————————————————————————————————————————
// —————————————————————————————————————— 2-1. Indicators —————————————————————————————————————————————————————————————————
//# * —————————————————————————————————————————————————————————————————————————————————————————————————————————————————————
//# *
//# *                         Here are the indicators used for the strategy
//# *
//# *                  Aqui se encuentran los indicadores usados para la estrategia.
//# *
//# *
//# *  Supertrend  |  https://tradingview.com/script/P5Gu6F8k/
//# *
// ————————————————————————————————————————————————————————————————————————————————————————————————————————————————————————

// —————————————————————————————————————— 1. Supertrend ———————————————————————————————————————————————————————————————————


stPeriods    = input(group="Supertrend", title='ATR Period', defval=10)
stSourceX    = input(group="Supertrend", title='Source', defval=hl2)
stMultiplier = input.float(group="Supertrend", title='ATR Multiplier', defval=3.0, step=0.1)
stChangeATR  = input(group="Supertrend", title='Change ATR Calculation Method ?', defval=false)
showsignals  = input(group="Supertrend", title='Plot Supertrend', defval=false)

varip float stSource = 0.0
stSource := stSourceX == close ? Close : stSourceX == open ? Open : stSourceX == high ? High : stSourceX == low ? Low : stSourceX == hl2 ? HL2 : stSourceX == hlc3 ? HLC3 : stSourceX == ohlc4 ? OHLC4 : HLCC4

tr   = math.max(High - Low, math.abs(High - Close[1]), math.abs(Low - Close[1]))    // The true range and functions that need olhc need to be calculated with the custom olhc values
atr2 = ta.sma(tr, stPeriods)                                                        // in lines 117-124 for the heikin ashi entries, otherwise the functions will be calculated with
atr  = stChangeATR ? atr2 : ta.rma(tr, stPeriods)                                   // Japanese values and the entries will be in Japanese candlesticks.
up   = stSource - stMultiplier * atr
up1  = nz(up[1], up)                                                                // El rango verdadero y las funciones que necesitan olhc, necesitan ser calculados con los valores
up   := Close[1] > up1 ? math.max(up, up1) : up                                     // olhc personalizados en las líneas 117-124 para las entradas heikin ashi, de lo contrario las
dn   = stSource + stMultiplier * atr                                                // funciones serán calculadas con valores japoneses y las entradas estarán en velas japonesas.
dn1  = nz(dn[1], dn)
dn   := Close[1] < dn1 ? math.min(dn, dn1) : dn
trend = 1
trend := nz(trend[1], trend)
trend := trend == -1 and Close > dn1 ? 1 : trend == 1 and Close < up1 ? -1 : trend

supertrend = trend == 1 ? true : false         //🔵
supertrendBuy  = trend == 1 and trend[1] == -1 //🟢
supertrendSell = trend == -1 and trend[1] == 1 //🔴


upPlot = plot(trend == 1 and showsignals ? up : na, title='Supertrend', style=plot.style_linebr, color=color.new(color.green, 0), linewidth=2)
dnPlot = plot(trend != 1 and showsignals ? dn : na, title='Supertrend', style=plot.style_linebr, color=color.new(color.red,   0), linewidth=2)

plotshape(supertrendBuy  and showsignals ? up : na, title='Supertrend', style=shape.circle,      color=color.new(color.green, 0), location=location.absolute, size=size.tiny)
plotshape(supertrendBuy  and showsignals ? up : na, title='Supertrend', style=shape.labelup,     color=color.new(color.green, 0), location=location.absolute, text='Buy',  textcolor=color.new(color.white, 0))

plotshape(supertrendSell and showsignals ? dn : na, title='Supertrend', style=shape.circle,      color=color.new(color.red,   0), location=location.absolute, size=size.tiny)
plotshape(supertrendSell and showsignals ? dn : na, title='Supertrend', style=shape.labeldown,   color=color.new(color.red,   0), location=location.absolute, text='Sell', textcolor=color.new(color.white, 0))

mPlot = plot(ohlc4, title='Supertrend', style=plot.style_circles, linewidth=0, color=color.new(color.white, 100))
longFillColor  = trend ==  1 ? color.green : color.white
shortFillColor = trend == -1 ? color.red   : color.white
fill(mPlot, upPlot, title='UpTrend Highligter',   color=color.new(longFillColor,  90))
fill(mPlot, dnPlot, title='DownTrend Highligter', color=color.new(shortFillColor, 90))


// ————————————————————————————————————————————————————————————————————————————————————————————————————————————————————————
// —————————————————————————————————————— 3. Stop Loss and Take Profit ————————————————————————————————————————————————————
//# * —————————————————————————————————————————————————————————————————————————————————————————————————————————————————————
//# *
//# *           Various options for stop loss and take profit are already pre-programmed to
//# *                   protect the investment from unexpected market movements.
//# *
//# *           Diversas opciones para stop loss y take profit se encuentran ya pre-programadas
//# *               para asi proteger la inversion de movimientos innesperados del mercado
//# *
//# *
// ————————————————————————————————————————————————————————————————————————————————————————————————————————————————————————


SL       = input.bool(   group="🔴 Stop Loss 🔴",   title="Use Stop Loss",     defval=true)
optionSL = input.string( group="🔴 Stop Loss 🔴",   title="Type of Stop",      defval="Last High/Low",        options = ["Fixed %", "Fixed $", "ATR", "Last High/Low", "Custom"])
fixedPSL = input.float(  group="🔴 Stop Loss 🔴",   title="Fixed %",           defval=1,   minval = 0)  / 100
fixedESL = input.float(  group="🔴 Stop Loss 🔴",   title="Fixed $",           defval=100, minval = 0)
atrL     = input.int(    group="🔴 Stop Loss 🔴",   title="ATR Lenght",        defval=14,  minval = 1)
atrM     = input.float(  group="🔴 Stop Loss 🔴",   title="ATR Multiplier",    defval=1,   minval = 0)
leftBHL  = input.int(    group="🔴 Stop Loss 🔴",   title="Last H/L Left",     defval=5,   minval = 1)
rightBHL = input.int(    group="🔴 Stop Loss 🔴",   title="last H/L Right",    defval=5,   minval = 1)
customSL = input.string( group="🔴 Stop Loss 🔴",   title="Custom",            defval="Custom",         options = ["Custom"])
trailSL  = input.bool(   group="🔴 Stop Loss 🔴",   title="Trailng Stop Loss", defval=false,            tooltip="The maximum stop loss price will decrease as the closing price moves further away from the entry price. \n\nEl precio maximo de stop loss ira disminuyendo mientras el precio de cierre se aleje mas del precio de entrada")

TP       = input.bool(   group="🟢 Take Profit 🟢", title="Use Take Profit",   defval=true)
optionTP = input.string( group="🟢 Take Profit 🟢", title="Type of Stop",      defval="Ratio 1:#",        options = ["Fixed %", "Fixed $", "Ratio 1:#", "Custom"])
fixedPTP = input.float(  group="🟢 Take Profit 🟢", title="Fixed %",           defval=1,   minval = 0)  / 100
fixedETP = input.float(  group="🟢 Take Profit 🟢", title="Fixed $",           defval=100, minval = 0)
ratioTP  = input.float(  group="🟢 Take Profit 🟢", title="Ratio 1:",          defval=1,   minval = 0)
customTP = input.string( group="🟢 Take Profit 🟢", title="Custom",            defval="Custom",         options = ["Custom"])

inOperationB = strategy.position_size >  0 ? true : false
inOperationS = strategy.position_size <  0 ? true : false
inOperation  = strategy.position_size != 0 ? true : false

varip float stopLossB   = 0
varip float takeProfitB = 0
varip float stopLossS   = 0
varip float takeProfitS = 0
varip float entryPrice  = 0
varip float entryPriceB = 0
varip float entryPriceS = 0
varip float trailingB = 0
varip float trailingS = 0

buy  = superTrend and supertrendBuy  //🟢
sell = superTrend and supertrendSell //🔴


// —————————————————————————————————————————— 1. ATR ————————————————————————————————————————————————————————————————————————

atrHigh = ta.rma(ta.tr(true), atrL) * atrM + high
atrLow  = low - ta.rma(ta.tr(true), atrL) * atrM

atrHighPlot = plot(atrHigh, title='ATR Sell Stop Loss', color=color.new(color.red,   not inOperation and optionSL == "ATR" ? 70 : 100), style=plot.style_stepline)
atrLowPlot  = plot(atrLow,  title='ATR Buy Stop Loss',  color=color.new(color.green, not inOperation and optionSL == "ATR" ? 70 : 100), style=plot.style_stepline)


// —————————————————————————————————————— 2. Pivot Points ———————————————————————————————————————————————————————————————————

mb = leftBHL + rightBHL + 1
highestbars_1 = ta.highestbars(mb)
lowestbars_1  = ta.lowestbars(mb)
iff_1 = highestbars_1 == -leftBHL ? high[leftBHL] : na
iff_2 = lowestbars_1  == -leftBHL ?  low[leftBHL] : na
lowest  = not na(high[mb]) ? iff_1 : na
highest = not na( low[mb]) ? iff_2 : na

varip float highestHigh = 0
varip float lowestLow = 0
highestHigh := ta.valuewhen(lowest, high[leftBHL], 0)
lowestLow   := ta.valuewhen(highest, low[leftBHL], 0)

plotshape(highest, title="Last Low",  color=color.new(color.red,   optionSL == "Last High/Low" ?  0 : 100), style=shape.triangleup,   location=location.belowbar, size=size.tiny, offset=-leftBHL)
plotshape(lowest,  title="Last High", color=color.new(color.lime,  optionSL == "Last High/Low" ?  0 : 100), style=shape.triangledown, location=location.abovebar, size=size.tiny, offset=-leftBHL)

plot(lowestLow,    title='Last Low',  color=color.new(color.red,   optionSL == "Last High/Low" ? 70 : 100), style=plot.style_stepline)
plot(highestHigh,  title='Last High', color=color.new(color.green, optionSL == "Last High/Low" ? 70 : 100), style=plot.style_stepline)


// —————————————————————————————————————— 3. Stop Loss ——————————————————————————————————————————————————————————————————————

calculateSL() =>
    varip float stopResult = 0
    varip float stop = 0

    if optionSL == "Fixed %"       and buy
        stop := entryPriceB - ( entryPriceB * fixedPSL)

    if optionSL == "Fixed %"       and sell
        stop := entryPriceS + ( entryPriceS * fixedPSL)

    if optionSL == "Fixed $"       and buy
        stop := entryPriceB - fixedESL

    if optionSL == "Fixed $"       and sell
        stop := entryPriceS + fixedESL

    if optionSL == "Last High/Low" and buy
        stop := lowestLow

    if optionSL == "Last High/Low" and sell
        stop := highestHigh

    if optionSL == "ATR"           and buy
        stop := atrLow

    if optionSL == "ATR"           and sell
        stop := atrHigh

    if optionSL == "Custom"        and buy
        stop := entryPriceB - ( entryPriceB * fixedPSL)

    if optionSL == "Custom"        and sell
        stop := entryPriceS + ( entryPriceS * fixedPSL)

    stopResult := stop


// —————————————————————————————————————— 4. Take Profit ————————————————————————————————————————————————————————————————————

calculateTP() =>
    varip float takeResult = 0
    varip float take = 0

    if optionTP == "Fixed %"            and buy
        take := entryPriceB + ( entryPriceB * fixedPTP)

    if optionTP == "Fixed %"            and sell
        take := entryPriceS - ( entryPriceS * fixedPTP)

    if optionTP == "Fixed $"            and buy
        take := entryPriceB + fixedETP

    if optionTP == "Fixed $"            and sell
        take := entryPriceS - fixedETP

    if optionTP == "Ratio 1:#"          and buy
        take := entryPriceB + ( trailingB * ratioTP )

    if optionTP == "Ratio 1:#"          and sell
        take := entryPriceS - ( trailingS * ratioTP )

    if optionTP == "Custom"             and buy
        take := entryPriceB + ( entryPriceB * fixedPTP)

    if optionTP == "Custom"             and sell
        take := entryPriceS - ( entryPriceS * fixedPTP)

    takeResult := take


// —————————————————————————————————————— 5. BUY ————————————————————————————————————————————————————————————————————————————

if inOperationB and trailSL and not buy
    stopLossBNew = close - trailingB
    stopLossB := stopLossBNew > stopLossB ? stopLossBNew : stopLossB[1]
    strategy.exit("Buy Exit", "Buy", stop=stopLossB, limit=takeProfitB)

if dateRange and buy and (((inOperation and closeNewEntry) or not inOperation))
    entryPrice  := close
    entryPriceB := close
    stopLossB   := SL ? calculateSL() : na
    trailingB   := close - stopLossB
    takeProfitB := TP ? calculateTP() : na
    strategy.entry("Buy", strategy.long, limit=entryPriceB)
    strategy.exit("Buy Exit", "Buy", stop=stopLossB, limit=takeProfitB)

if sell and inOperationB and not closeNewEntry
    strategy.cancel("Buy")

// —————————————————————————————————————— 6. SELL ———————————————————————————————————————————————————————————————————————————

if inOperationS and trailSL and not sell
    stopLossSNew = close + trailingS
    stopLossS := stopLossSNew > stopLossS ? stopLossSNew : stopLossS[1]
    strategy.exit("Sell Exit", "Sell", stop=stopLossS, limit=takeProfitS)

if dateRange and sell and (((inOperation and closeNewEntry) or not inOperation))
    entryPrice  := close
    entryPriceS := close
    stopLossS   := SL ? calculateSL() : na
    trailingS   := stopLossS - close
    takeProfitS := TP ? calculateTP() : na
    strategy.entry("Sell", strategy.short, limit=entryPriceS)
    strategy.exit("Sell Exit", "Sell", stop=stopLossS, limit=takeProfitS)

if sell and inOperationS and not closeNewEntry
    strategy.cancel("Sell")


slbp = plot(stopLossB,   color=color.new(color.red,   inOperationB ?  0 : 100), style=plot.style_linebr, linewidth=3, title="Stop Loss B")
slsp = plot(stopLossS,   color=color.new(color.red,   inOperationS ?  0 : 100), style=plot.style_linebr, linewidth=3, title="Stop Loss S")
tpbp = plot(takeProfitB, color=color.new(color.green, inOperationB ?  0 : 100), style=plot.style_linebr, linewidth=3, title="Take Profit B")
tpsp = plot(takeProfitS, color=color.new(color.green, inOperationS ?  0 : 100), style=plot.style_linebr, linewidth=3, title="Take Profit S")
epbp = plot(entryPriceB, color=color.new(color.gray,  inOperationB ? 50 : 100), style=plot.style_linebr, linewidth=3, title="Entry Price B")
epsp = plot(entryPriceS, color=color.new(color.gray,  inOperationS ? 50 : 100), style=plot.style_linebr, linewidth=3, title="Entry Price S")

fill(epbp, slbp, color=color.new(color.red,   inOperationB ? 75 : 100))
fill(epbp, tpbp, color=color.new(color.green, inOperationB ? 75 : 100))
fill(epsp, slsp, color=color.new(color.red,   inOperationS ? 75 : 100))
fill(epsp, tpsp, color=color.new(color.green, inOperationS ? 75 : 100))