Rainbow Oscillator Backtesting-Strategie
Überblick
Die Rainbow Oscillator Retracement Strategie ist eine quantitative Trading-Strategie, die auf Rainbow Oscillator-Indikatoren basiert. Die Strategie beurteilt die Richtung und Stärke des Markttrends, indem sie die Abweichung zwischen dem Aktienpreis und der Durchschnittslinie berechnet, um die Richtung der langen und kurzen Positionen zu bestimmen.
Strategieprinzip
Der Kernindikator für diese Strategie ist der Rainbow Oscillator (RO), dessen Berechnungsformel lautet:
RO = 100 * ((收盘价 - 10日移动平均线) / (最高价的最高值 - 最低价的最低值))
Der 10-Tage-Moving-Average ist ein einfacher Moving-Average für 10 Perioden des Schlusskurses. Der Indikator spiegelt die Abweichung des Preises von seiner eigenen Durchschnittslinie wider. Wenn RO > 0 ist, bedeutet dies, dass der Preis über der Durchschnittslinie liegt, ein bullish Signal; wenn RO < 0 ist, bedeutet dies, dass der Preis unter der Durchschnittslinie ist, ein bullish Signal.
Die Strategie berechnet auch ein Hilfsindikator für die Bandbreite: Bandwidth, RB. Die Berechnungsformel lautet:
RB = 100 * ((均线的最高值 - 均线的最低值) / (最高价的最高值 - 最低价的最低值))
Die RB zeigt die Breite zwischen den Durchschnittslinien an. Je größer die RB, desto größer ist die Preisschwankung, umgekehrt ist die Preisstabilität. Die RB-Indikatoren können verwendet werden, um die Stabilität des Marktes zu beurteilen.
Die Strategie beurteilt die Preisabweichung und die Stabilität des Marktes anhand der Werte der RO- und RB-Indikatoren und erzeugt damit ein Handelssignal für Long- und Short-Positions.
Strategische Vorteile
Diese Strategie hat folgende Vorteile:
- Die Einschränkung der Einschätzung eines einzelnen Indikators wird durch die Einschätzung auf der Grundlage von zwei Indikatoren vermieden.
- Es gibt eine Reihe von Faktoren, die die Marktstabilität beeinflussen können.
- Die Berechnung ist einfach, leicht zu verstehen und umzusetzen.
- Die Indikatoren werden visualisiert und bilden einen Regenbogen-Effekt, der leicht zu lesen ist.
Strategisches Risiko
Die Strategie birgt auch einige Risiken:
- Die falsche Einstellung der Parameter für die RO- und RB-Indikatoren kann zu Fehlsignalen führen.
- Die Strategie der Doppel-Einheitlichkeit ist anfällig für falsche Signale und häufigen Handel.
- Unzureichende Auswahl der Sorten und Rücklaufzeiten beeinträchtigen die Effektivität der Strategie.
- Es ist nicht möglich, dass die Festplatte ohne Berücksichtigung der Transaktionskosten so gut funktioniert.
Gegenmaßnahmen:
- Parameter zur Optimierung der RO- und RB-Indikatoren.
- Die Filterbedingungen sollen erhöht werden, um häufige Transaktionen zu vermeiden.
- Wählen Sie die richtige Rücklaufphase und Sorte.
- Berechnen und berücksichtigen Sie die Transaktionskosten.
Strategieoptimierung
Die Strategie kann auch in folgenden Bereichen optimiert werden:
- Die Funktion “Smooth” wurde in die RO-Anzeige integriert, um starke Schwankungen zu vermeiden.
- Ein Stop-Loss-Strategien, um einzelne Verluste zu kontrollieren.
- In Kombination mit anderen Indikatoren, um die Gewinnwahrscheinlichkeit zu erhöhen.
- Die Einführung von Machine-Learning-Modellen zur Vorhersage und Bewertung der Effektivität von Kennzahlen.
- Optimierung für verschiedene Sortenparameter, um die Anpassungsfähigkeit zu verbessern.
Zusammenfassen
Die Rainbow Oscillator Retracement Strategie berechnet die Abweichung zwischen dem Preis und der Durchschnittslinie, um die Markttrends und die Stabilität zu beurteilen, um einen langen und kurzen Handel zu betreiben. Die Strategie ist intuitiv, leicht zu lesen, einfach zu implementieren und hat einen gewissen praktischen Wert. Aber es gibt auch einige Risiken, die für die Parameter und Handelsregeln optimiert werden müssen, um das Risiko zu verringern und die Wirksamkeit auf dem Markt zu verbessern.
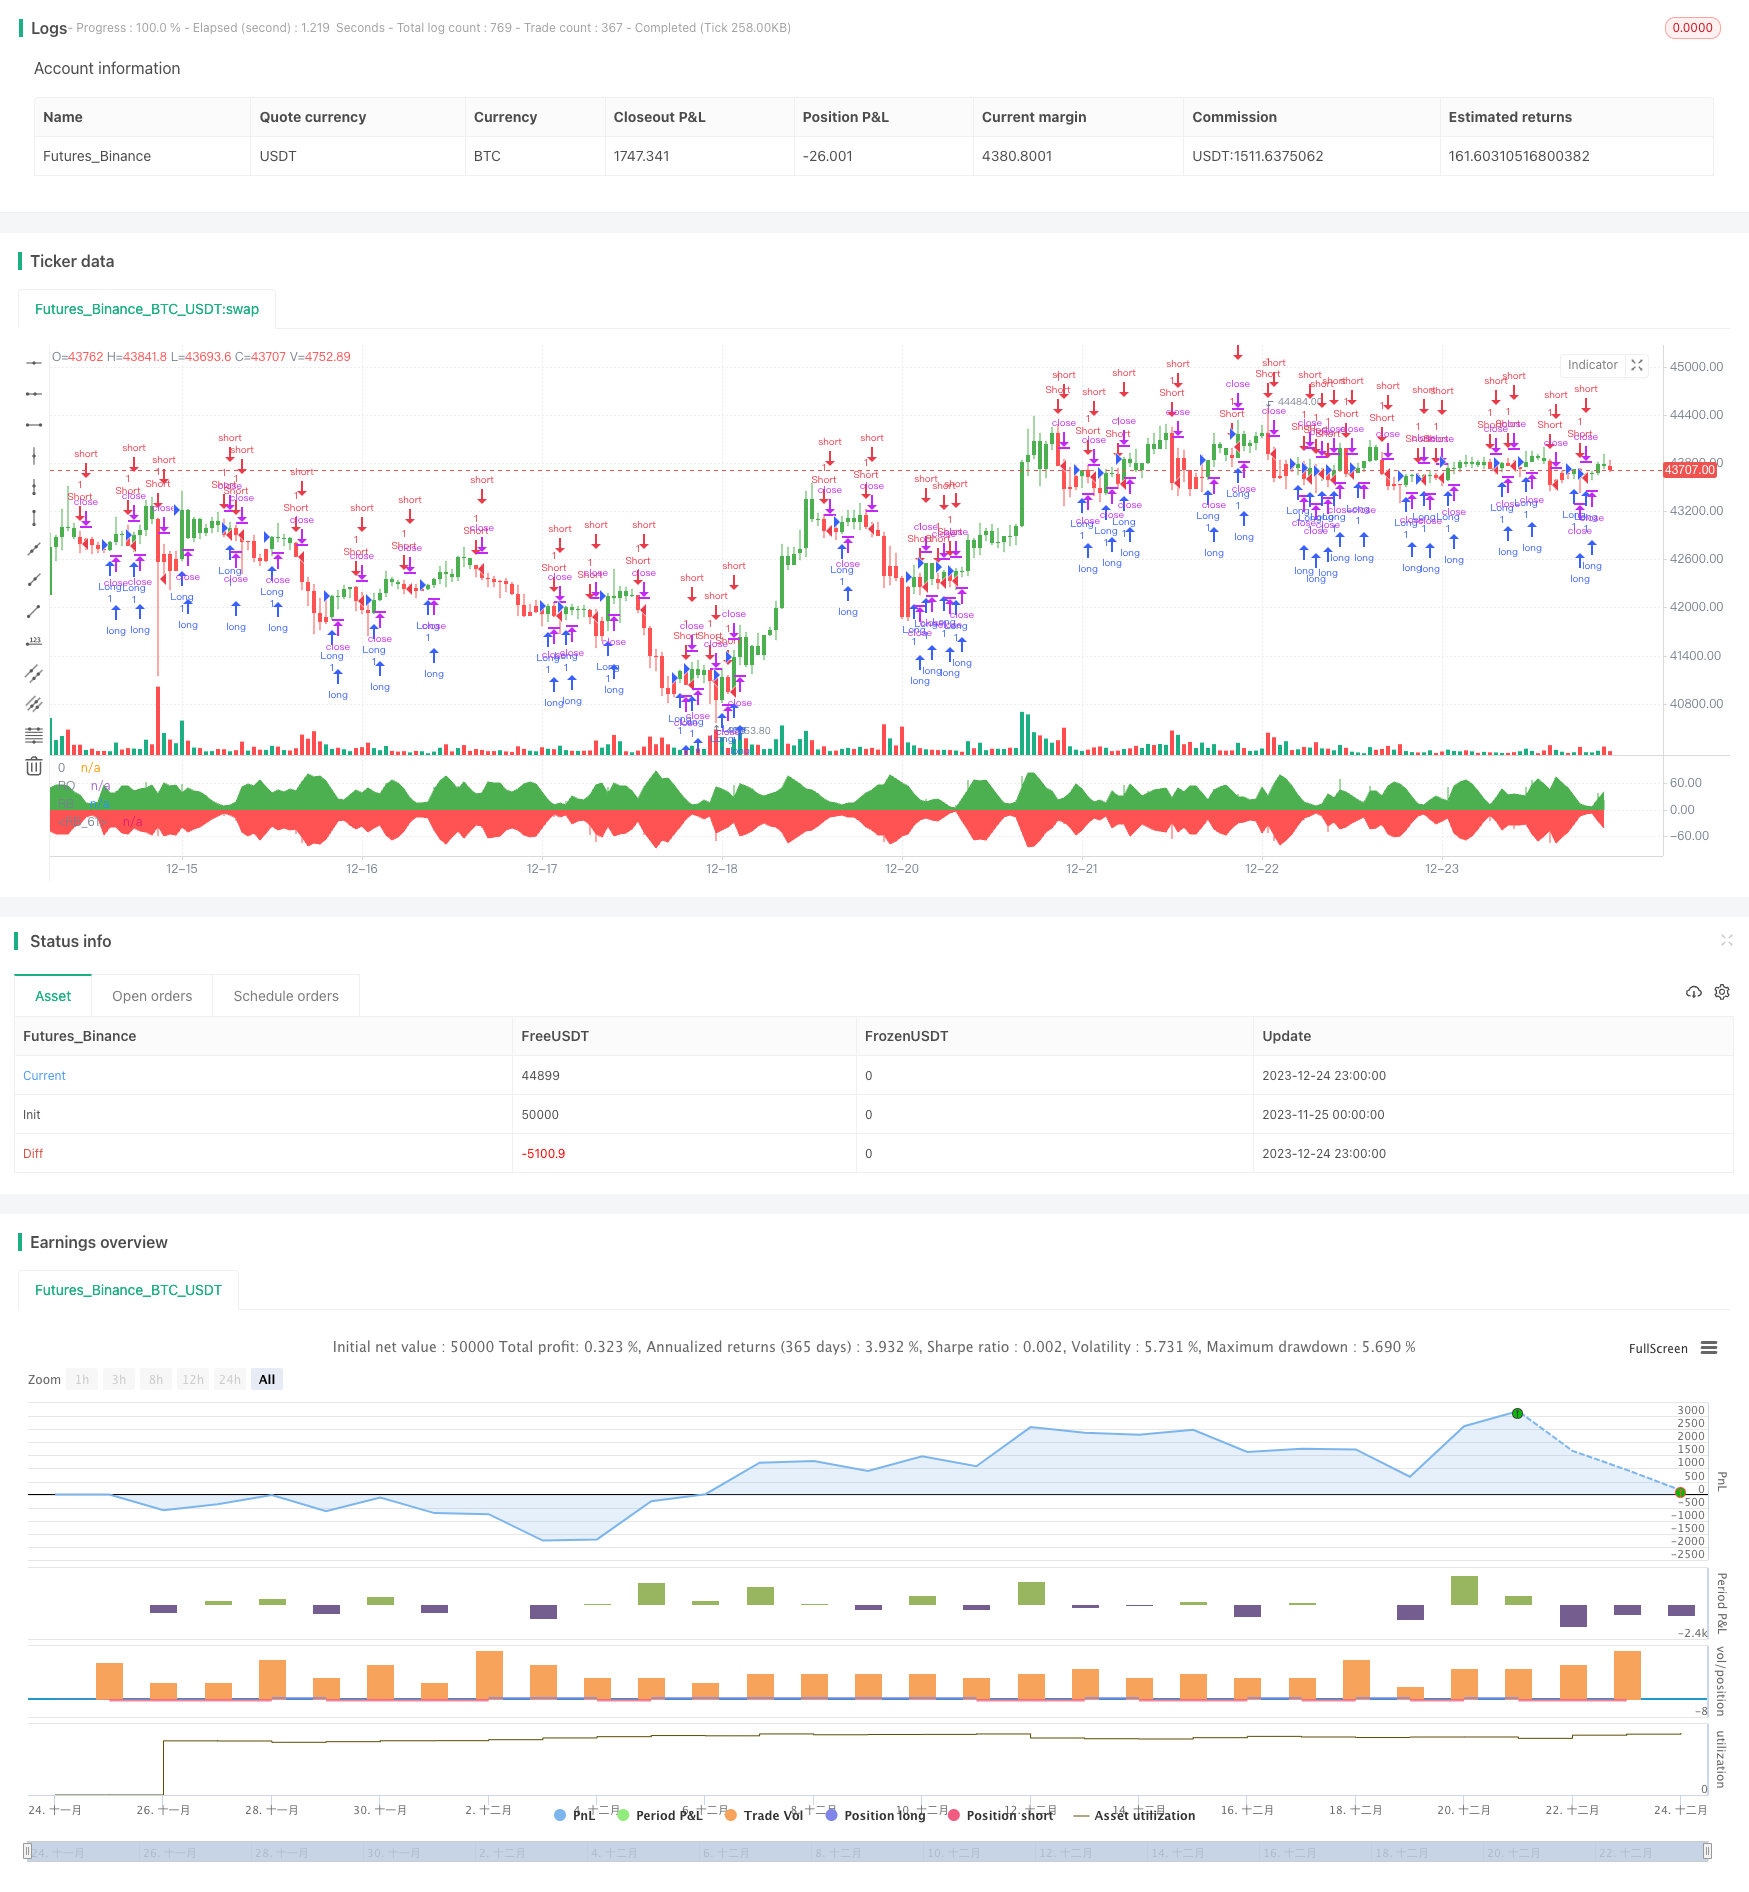
/*backtest
start: 2023-11-25 00:00:00
end: 2023-12-25 00:00:00
period: 1h
basePeriod: 15m
exchanges: [{"eid":"Futures_Binance","currency":"BTC_USDT"}]
*/

//@version=2
////////////////////////////////////////////////////////////
//  Copyright by HPotter v1.0 18/03/2018
// Ever since the people concluded that stock market price movements are not
// random or chaotic, but follow specific trends that can be forecasted, they
// tried to develop different tools or procedures that could help them identify
// those trends. And one of those financial indicators is the Rainbow Oscillator
// Indicator. The Rainbow Oscillator Indicator is relatively new, originally
// introduced in 1997, and it is used to forecast the changes of trend direction.
//
// As market prices go up and down, the oscillator appears as a direction of the
// trend, but also as the safety of the market and the depth of that trend. As
// the rainbow grows in width, the current trend gives signs of continuity, and
// if the value of the oscillator goes beyond 80, the market becomes more and more
// unstable, being prone to a sudden reversal. When prices move towards the rainbow
// and the oscillator becomes more and more flat, the market tends to remain more
// stable and the bandwidth decreases. Still, if the oscillator value goes below 20,
// the market is again, prone to sudden reversals. The safest bandwidth value where
// the market is stable is between 20 and 80, in the Rainbow Oscillator indicator value.
// The depth a certain price has on a chart and into the rainbow can be used to judge
// the strength of the move.
//
// You can change long to short in the Input Settings
// WARNING:
//  - For purpose educate only
//  - This script to change bars colors.
////////////////////////////////////////////////////////////
strategy(title="Rainbow Oscillator Backtest")
Length = input(2, minval=1)
LengthHHLL = input(10, minval=2, title="HHV/LLV Lookback")
reverse = input(false, title="Trade reverse")
xMA1 = sma(close, Length)
xMA2 = sma(xMA1, Length)
xMA3 = sma(xMA2, Length)
xMA4 = sma(xMA3, Length)
xMA5 = sma(xMA4, Length)
xMA6 = sma(xMA5, Length)
xMA7 = sma(xMA6, Length)
xMA8 = sma(xMA7, Length)
xMA9 = sma(xMA8, Length)
xMA10 = sma(xMA9, Length)
xHH = highest(close, LengthHHLL)
xLL = lowest(close, LengthHHLL)
xHHMAs = max(xMA1,max(xMA2,max(xMA3,max(xMA4,max(xMA5,max(xMA6,max(xMA7,max(xMA8,max(xMA9,xMA10)))))))))
xLLMAs = min(xMA1,min(xMA2,min(xMA3,min(xMA4,min(xMA5,min(xMA6,min(xMA7,min(xMA8,min(xMA9,xMA10)))))))))
xRBO = 100 * ((close - ((xMA1+xMA2+xMA3+xMA4+xMA5+xMA6+xMA7+xMA8+xMA9+xMA10) / 10)) / (xHH - xLL))
xRB = 100 * ((xHHMAs - xLLMAs) / (xHH - xLL))
clr = iff(xRBO >= 0, green, red)
pos = iff(xRBO > 0, 1,
       iff(xRBO < 0, -1, nz(pos[1], 0)))
possig = iff(reverse and pos == 1, -1,
          iff(reverse and pos == -1, 1, pos))
if (possig == 1)
    strategy.entry("Long", strategy.long)
if (possig == -1)
    strategy.entry("Short", strategy.short)
barcolor(possig == -1 ? red: possig == 1 ? green : blue )
plot(xRBO, color=clr, title="RO", style= histogram, linewidth=2)
p0 = plot(0, color = gray, title="0")
p1 = plot(xRB, color=green, title="RB")
p2 = plot(-xRB, color=red, title="RB")
fill(p1, p0, color=green)
fill(p2, p0, color=red)