Trendfolgende Intraday-Strategie mit mehreren Stopps
Überblick
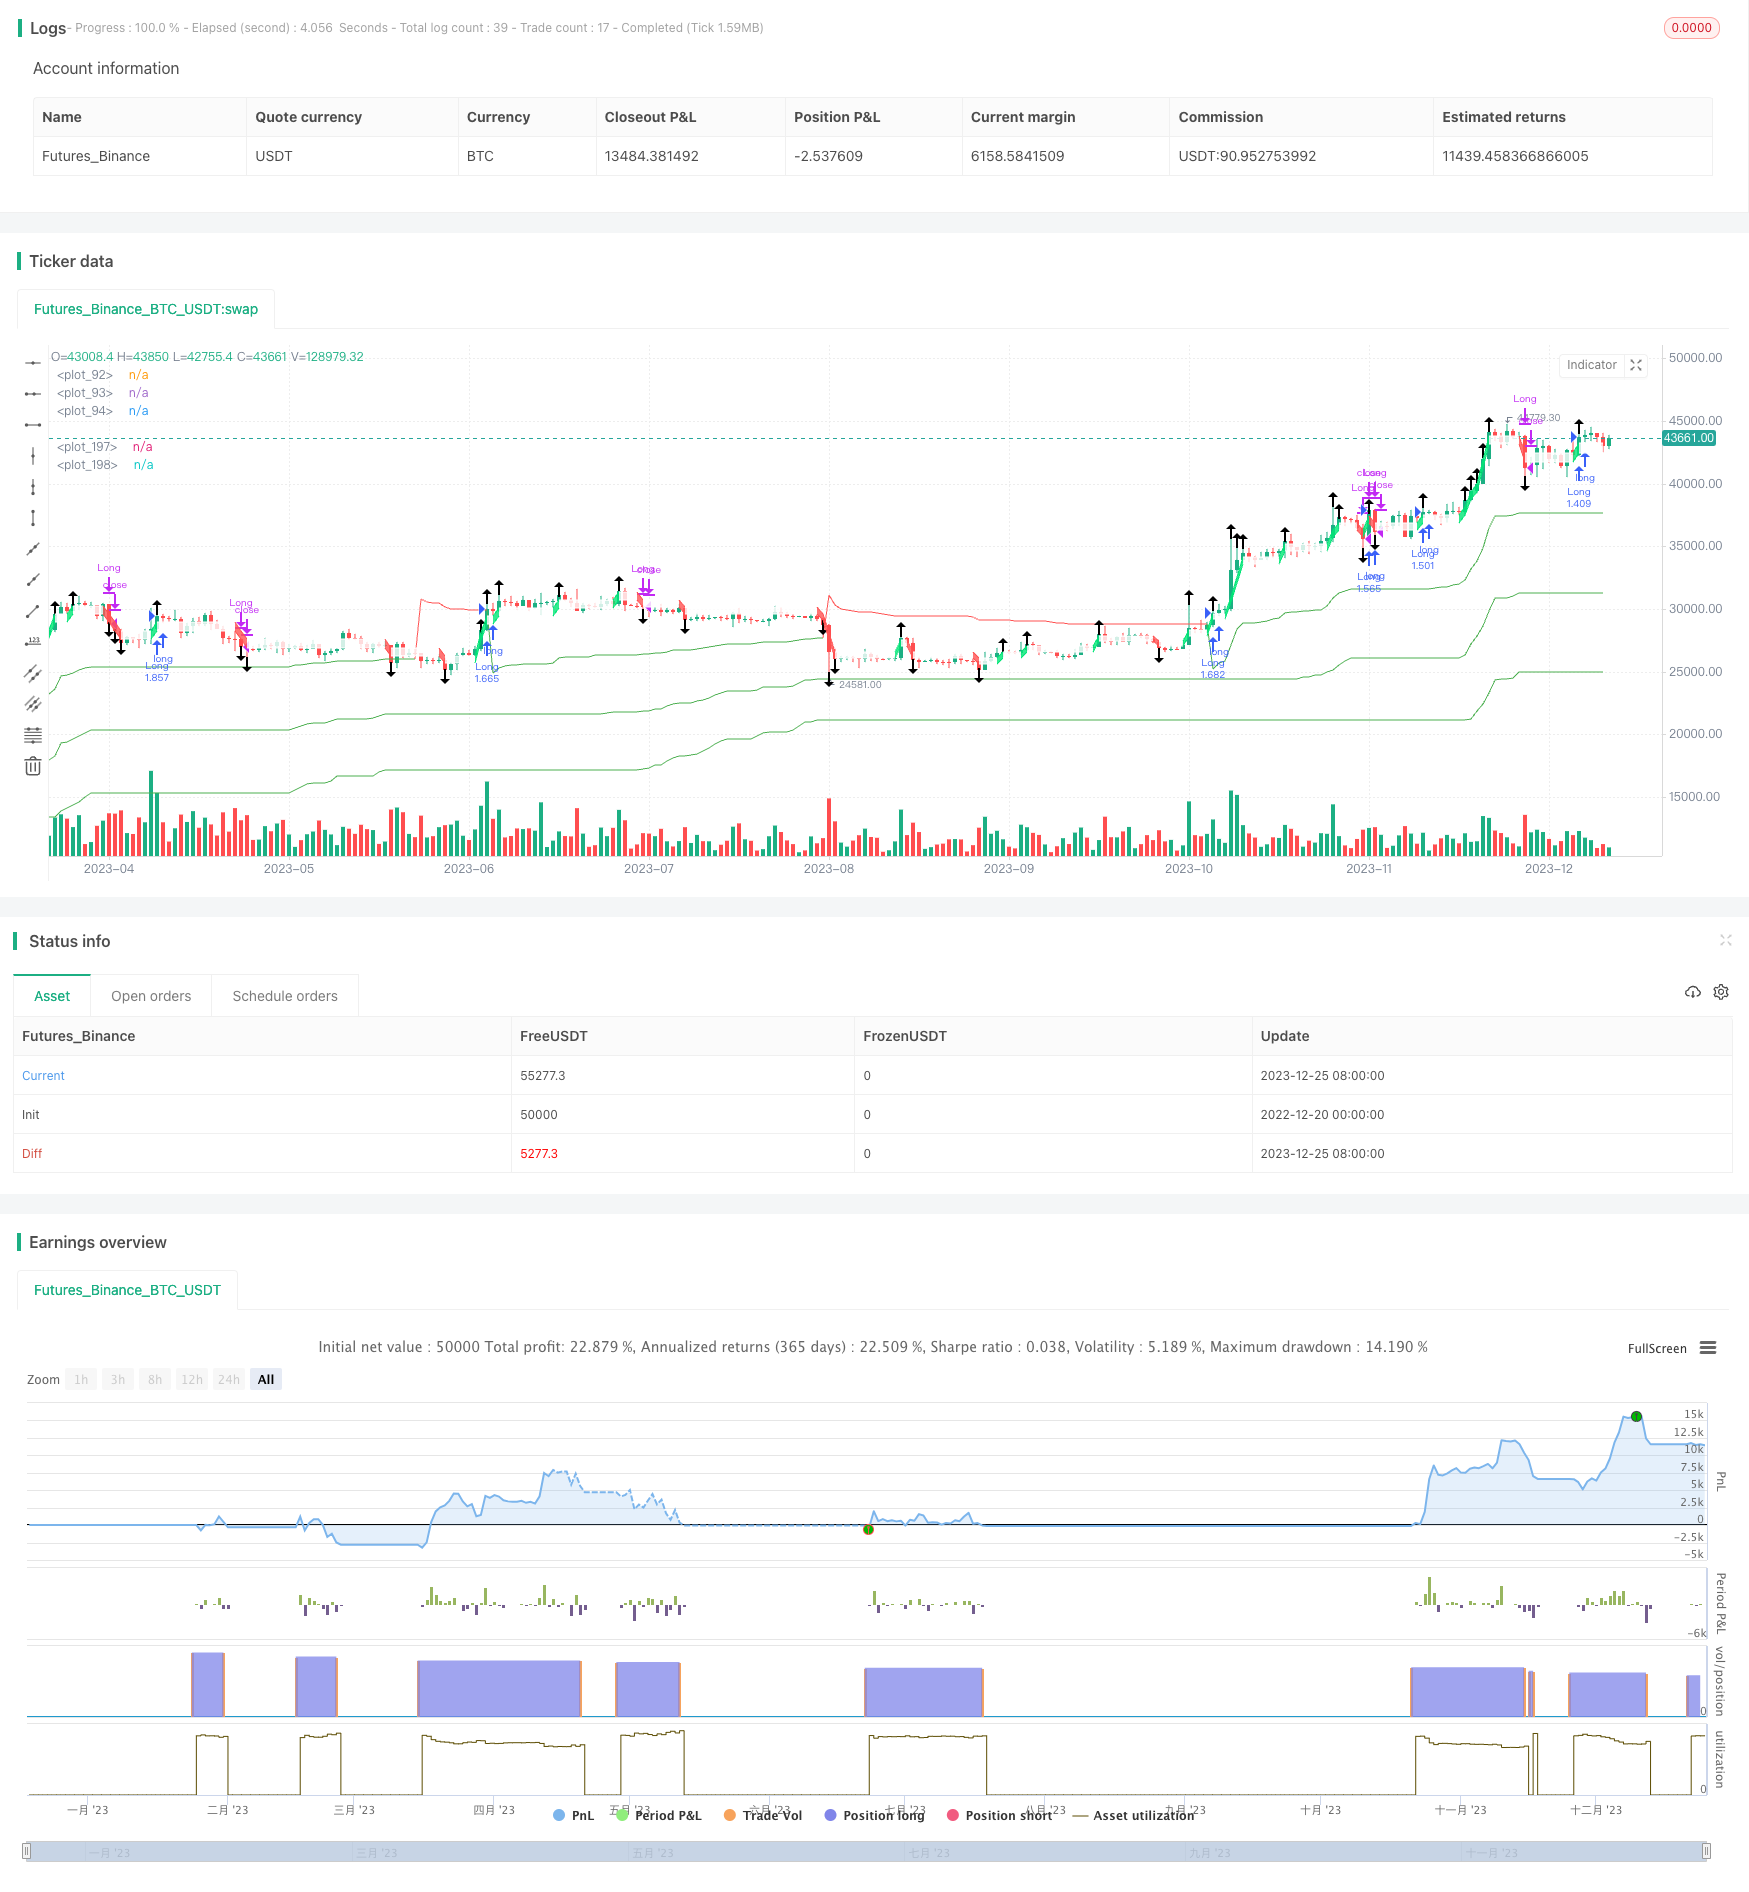
Die Strategie kombiniert mehrere ATR-Dynamische Stopps und eine verbesserte Renko-Block, um die Trendentwicklung im Intraday zu erfassen. Sie kombiniert Trend- und Block-Indikatoren und ermöglicht eine Multi-Time-Frame-Analyse, um die Trendrichtung effektiv zu identifizieren und den Verlust rechtzeitig zu stoppen.
Strategieprinzip
Der Kern der Strategie ist der Multiple-ATR-Stopp-Mechanismus. Er setzt drei Gruppen von ATR-Dynamikstopps mit Parametern von 5-facher ATR, 10-facher ATR und 15-facher ATR. Wenn der Preis diese drei Gruppen von Stopp-Linien überschreitet, wird eine Trendwende angezeigt, bei der die Position platziert wird. Diese Multiple-Stopp-Einstellung filtert effektiv falsche Signale aus kurzfristigen Schwankungen.
Ein weiterer Kernteil ist der verbesserte Renko-Block, der die Zunahme anhand der ATR-Werte verteilt und die Richtung der Tendenz in Verbindung mit dem SMA-Indikator beurteilt. Er ist empfindlicher als der normale Renko-Block und kann eine Trendänderung früher erkennen. Wenn sich die Farbe des Blocks ändert, wird eine Trendwende angezeigt, die als Stoppsignal dient.
Die Eintrittsbedingungen gelten für den Fall, dass der Preis den 3-Gruppen-ATR-Stopp nach oben überschreitet, und für den Fall, dass der Preis den 3-Gruppen-ATR-Stopp nach unten überschreitet. Die Ausstiegsbedingungen gelten für den Fall, dass der Preis einen ATR-Stopp auslöst oder die Farbe der Renko-Blöcke ändert.
Strategische Vorteile
- Mehrfache ATR-Stopp-Verluste, um das Risiko zu kontrollieren
- Renko-Blöcke, empfindlicher und schneller schadenlos
- Kombination von Trend- und Blockindikatoren, um sicherzustellen, dass Trends erfasst werden
- Mehrzeit-Analysen, um Trends zu bestimmen
- Parameter sind anpassbar für unterschiedliche Marktumstände
Strategische Risiken und Optimierungen
Das Hauptrisiko dieser Strategie besteht darin, dass die Stop-Loss-Verluste durch einen Durchbruch vergrößert werden. Sie kann durch folgende Methoden optimiert werden:
- Anpassung des Multiplikators des ATR-Stopps, der in stark trendigen Märkten angemessen gelockert werden kann; bei schwachen Trends sollte angemessen gestärkt werden
- Anpassung der ATR-Zyklusparameter für Renko-Blöcke, um Sensitivität und Stabilität zu balancieren
- Hinzufügen von weiteren Stop-Loss-Indikatoren, wie Donchian-Kanal, um zuverlässige Stop-Loss zu gewährleisten
- Mehr Filter zur Vermeidung häufiger Transaktionen in der Berechnung
Zusammenfassen
Die Strategie ist insgesamt für starke Intraday-Trends geeignet. Sie zeichnet sich durch die Wissenschaft des Stop-Loss-Settings aus. Die Block-Indikatoren können die Trendwende vorzeitig erkennen. Durch die Anpassung der Parameter an die unterschiedlichen Marktumgebungen ist es eine Trendverfolgungsstrategie, die es wert ist, in der Praxis zu überprüfen.
/*backtest
start: 2022-12-20 00:00:00
end: 2023-12-26 00:00:00
period: 1d
basePeriod: 1h
exchanges: [{"eid":"Futures_Binance","currency":"BTC_USDT"}]
*/

//@version=4
strategy("Lancelot vstop intraday strategy", overlay=true, currency=currency.NONE, initial_capital = 100, commission_type=strategy.commission.percent,
     commission_value=0.075, default_qty_type = strategy.percent_of_equity, default_qty_value = 100)

///Volatility Stop///
lengtha = input(title="Vstop length", type=input.integer, defval=26, minval=1)
mult1a = 5

atr_a = atr(lengtha)
max1a = 0.0
min1a = 0.0
is_uptrend_preva = false
stopa = 0.0
vstop_preva = 0.0
vstop1a = 0.0
is_uptrenda = false
is_trend_changeda = false
max_a = 0.0
min_a = 0.0
vstopa = 0.0
max1a := max(nz(max_a[1]), ohlc4)
min1a := min(nz(min_a[1]), ohlc4)
is_uptrend_preva := nz(is_uptrenda[1], true)
stopa := is_uptrend_preva ? max1a - mult1a * atr_a : min1a + mult1a * atr_a
vstop_preva := nz(vstopa[1])
vstop1a := is_uptrend_preva ? max(vstop_preva, stopa) : min(vstop_preva, stopa)
is_uptrenda := ohlc4 - vstop1a >= 0
is_trend_changeda := is_uptrenda != is_uptrend_preva
max_a := is_trend_changeda ? ohlc4 : max1a
min_a := is_trend_changeda ? ohlc4 : min1a
vstopa := is_trend_changeda ? is_uptrenda ? max_a - mult1a * atr_a : min_a + mult1a * atr_a :
   vstop1a

///Volatility Stop///
lengthb = input(title="Vstop length", type=input.integer, defval=26, minval=1)
mult1b = 10

atr_b = atr(lengthb)
max1b = 0.0
min1b = 0.0
is_uptrend_prevb = false
stopb = 0.0
vstop_prevb = 0.0
vstop1b = 0.0
is_uptrendb = false
is_trend_changedb = false
max_b = 0.0
min_b = 0.0
vstopb = 0.0
max1b := max(nz(max_b[1]), ohlc4)
min1b := min(nz(min_b[1]), ohlc4)
is_uptrend_prevb := nz(is_uptrendb[1], true)
stopb := is_uptrend_prevb ? max1b - mult1b * atr_b : min1b + mult1b * atr_b
vstop_prevb := nz(vstopb[1])
vstop1b := is_uptrend_prevb ? max(vstop_prevb, stopb) : min(vstop_prevb, stopb)
is_uptrendb := ohlc4 - vstop1b >= 0
is_trend_changedb := is_uptrendb != is_uptrend_prevb
max_b := is_trend_changedb ? ohlc4 : max1b
min_b := is_trend_changedb ? ohlc4 : min1b
vstopb := is_trend_changedb ? is_uptrendb ? max_b - mult1b * atr_b : min_b + mult1b * atr_b :
   vstop1b

///Volatility Stop///
lengthc = input(title="Vstop length", type=input.integer, defval=26, minval=1)
mult1c = 15

atr_c = atr(lengthc)
max1c = 0.0
min1c = 0.0
is_uptrend_prevc = false
stopc = 0.0
vstop_prevc = 0.0
vstop1c = 0.0
is_uptrendc = false
is_trend_changedc = false
max_c = 0.0
min_c = 0.0
vstopc = 0.0
max1c := max(nz(max_c[1]), ohlc4)
min1c := min(nz(min_c[1]), ohlc4)
is_uptrend_prevc := nz(is_uptrendc[1], true)
stopc := is_uptrend_prevc ? max1c - mult1c * atr_c : min1c + mult1c * atr_c
vstop_prevc := nz(vstopc[1])
vstop1c := is_uptrend_prevc ? max(vstop_prevc, stopc) : min(vstop_prevc, stopc)
is_uptrendc := ohlc4 - vstop1c >= 0
is_trend_changedc := is_uptrendc != is_uptrend_prevc
max_c := is_trend_changedc ? ohlc4 : max1c
min_c := is_trend_changedc ? ohlc4 : min1c
vstopc := is_trend_changedc ? is_uptrendc ? max_c - mult1c * atr_c : min_c + mult1c * atr_c :
   vstop1c

plot(vstopa, color=is_uptrenda ? color.green : color.red, style=plot.style_line, linewidth=1)
plot(vstopb, color=is_uptrendb ? color.green : color.red, style=plot.style_line, linewidth=1)
plot(vstopc, color=is_uptrendc ? color.green : color.red, style=plot.style_line, linewidth=1)

vstoplongcondition = close > vstopa and close > vstopb and close > vstopc and vstopa > vstopb and vstopa > vstopc and vstopb > vstopc
vstoplongclosecondition = crossunder(close, vstopa)
vstopshortcondition = close < vstopa and close < vstopb and close < vstopc and vstopa < vstopb and vstopa < vstopc and vstopb < vstopc
vstopshortclosecondition = crossover(close, vstopa)

///Renko///
TF = input(title='TimeFrame', type=input.resolution, defval="240")
ATRlength = input(title="ATR length", type=input.integer, defval=60, minval=2, maxval=100)
SMAlength = input(title="SMA length", type=input.integer, defval=5, minval=2, maxval=100)
SMACurTFlength = input(title="SMA CurTF length", type=input.integer, defval=20, minval=2, maxval=100)

HIGH = security(syminfo.tickerid, TF, high)
LOW = security(syminfo.tickerid, TF, low)
CLOSE = security(syminfo.tickerid, TF, close)
ATR = security(syminfo.tickerid, TF, atr(ATRlength))
SMA = security(syminfo.tickerid, TF, sma(close, SMAlength))
SMACurTF = sma(close, SMACurTFlength)

RENKOUP = float(na)
RENKODN = float(na)
H = float(na)
COLOR = color(na)
BUY = int(na)
SELL = int(na)
UP = bool(na)
DN = bool(na)
CHANGE = bool(na)

RENKOUP := na(RENKOUP[1]) ? (HIGH + LOW) / 2 + ATR / 2 : RENKOUP[1]
RENKODN := na(RENKOUP[1]) ? (HIGH + LOW) / 2 - ATR / 2 : RENKODN[1]
H := na(RENKOUP[1]) or na(RENKODN[1]) ? RENKOUP - RENKODN : RENKOUP[1] - RENKODN[1]
COLOR := na(COLOR[1]) ? color.white : COLOR[1]
BUY := na(BUY[1]) ? 0 : BUY[1]
SELL := na(SELL[1]) ? 0 : SELL[1]
UP := false
DN := false
CHANGE := false

if not CHANGE and close >= RENKOUP[1] + H * 3
    CHANGE := true
    UP := true
    RENKOUP := RENKOUP[1] + ATR * 3
    RENKODN := RENKOUP[1] + ATR * 2
    COLOR := color.lime
    SELL := 0
    BUY := BUY + 3
    BUY

if not CHANGE and close >= RENKOUP[1] + H * 2
    CHANGE := true
    UP := true
    RENKOUP := RENKOUP[1] + ATR * 2
    RENKODN := RENKOUP[1] + ATR
    COLOR := color.lime
    SELL := 0
    BUY := BUY + 2
    BUY

if not CHANGE and close >= RENKOUP[1] + H
    CHANGE := true
    UP := true
    RENKOUP := RENKOUP[1] + ATR
    RENKODN := RENKOUP[1]
    COLOR := color.lime
    SELL := 0
    BUY := BUY + 1
    BUY

if not CHANGE and close <= RENKODN[1] - H * 3
    CHANGE := true
    DN := true
    RENKODN := RENKODN[1] - ATR * 3
    RENKOUP := RENKODN[1] - ATR * 2
    COLOR := color.red
    BUY := 0
    SELL := SELL + 3
    SELL

if not CHANGE and close <= RENKODN[1] - H * 2
    CHANGE := true
    DN := true
    RENKODN := RENKODN[1] - ATR * 2
    RENKOUP := RENKODN[1] - ATR
    COLOR := color.red
    BUY := 0
    SELL := SELL + 2
    SELL

if not CHANGE and close <= RENKODN[1] - H
    CHANGE := true
    DN := true
    RENKODN := RENKODN[1] - ATR
    RENKOUP := RENKODN[1]
    COLOR := color.red
    BUY := 0
    SELL := SELL + 1
    SELL

plotshape(UP, style=shape.arrowup, location=location.abovebar, size=size.normal)
plotshape(DN, style=shape.arrowdown, location=location.belowbar, size=size.normal)

p1 = plot(RENKOUP, style=plot.style_line, linewidth=1, color=COLOR)
p2 = plot(RENKODN, style=plot.style_line, linewidth=1, color=COLOR)
fill(p1, p2, color=COLOR, transp=80)

///Long Entry///
longcondition = vstoplongcondition and UP
if (longcondition)
    strategy.entry("Long", strategy.long)

///Long exit///
closeconditionlong = vstoplongclosecondition or DN
if (closeconditionlong)
    strategy.close("Long")

// ///Short Entry///
// shortcondition = vstopshortcondition and DN
// if (shortcondition)
//     strategy.entry("Short", strategy.short)

// ///Short exit///
// closeconditionshort = vstopshortclosecondition or UP
// if (closeconditionshort)
//     strategy.close("Short")