Trendfolgestrategie basierend auf geglättetem Oszillator
Überblick
Die Strategie basiert auf glatten Schwingungsindikatoren, um Preistrends zu identifizieren und mit Trendverfolgung zu handeln. Wenn der Preis die Richtlinie überschreitet, wird ein Überschuss gemacht, und wenn der Preis die Richtlinie überschreitet, wird ein Unterschuss gemacht.
Strategieprinzip
Die Strategie verwendet eine benutzerdefinierte Glattschwingungsmarke, um eine Preisentwicklung zu erkennen. Die Marke berechnet den theoretischen Kurs, der den gegenwärtigen K-Linien-Umkehrschluss ermöglicht, der die Verluste und die Farbe des Trajectories umkehren kann. Die Marke wird dann mit einer Glattschwingung bearbeitet, um die endgültige Glattschwingungsmarke zu erhalten.
Die Strategie verwendet das Durchbrechen der Indikatorlinie als Positionssignal. Wenn der Preis die Indikatorlinie überschreitet, wird ein Plus gemacht, wenn der Preis die Indikatorlinie überschreitet, wird ein Minus gemacht. Die Stop-Loss-Linie wird als ein bestimmter Prozentsatz des Einstiegspreises festgelegt, um Gewinne zu sichern und Risiken zu kontrollieren.
Strategische Vorteile
- Trends mit benutzerdefinierten Kennzahlen identifizieren und besser zurückmessbar machen
- Trendverfolgung, die im Großen und Ganzen mit der Theorie des quantitativen Trendhandels übereinstimmt
- Die Stop-Loss-Einstellung ist für die Risikokontrolle geeignet
Risikoanalyse
- Ein gewisser Rückgang der Indikatoren kann zu einer schlechten Strategie führen
- Ein einziger Indikator kann zu falschen Signalen führen.
- Die Stop-Loss-Einstellungen können optimiert werden, es kann zu Überstop-Verlusten kommen.
Optimierungsrichtung
- Berücksichtigen Sie die Möglichkeit, Handelssignale in Kombination mit anderen Indikatoren zu filtern, z. B. Bollinger Bands, RSI usw.
- Verschiedene Parameter-Einstellungen für den Index testen
- Test und Optimierung von Schadensbegrenzungsmethoden
- Weitere Daten zu verschiedenen Sorten und Zyklen
Zusammenfassen
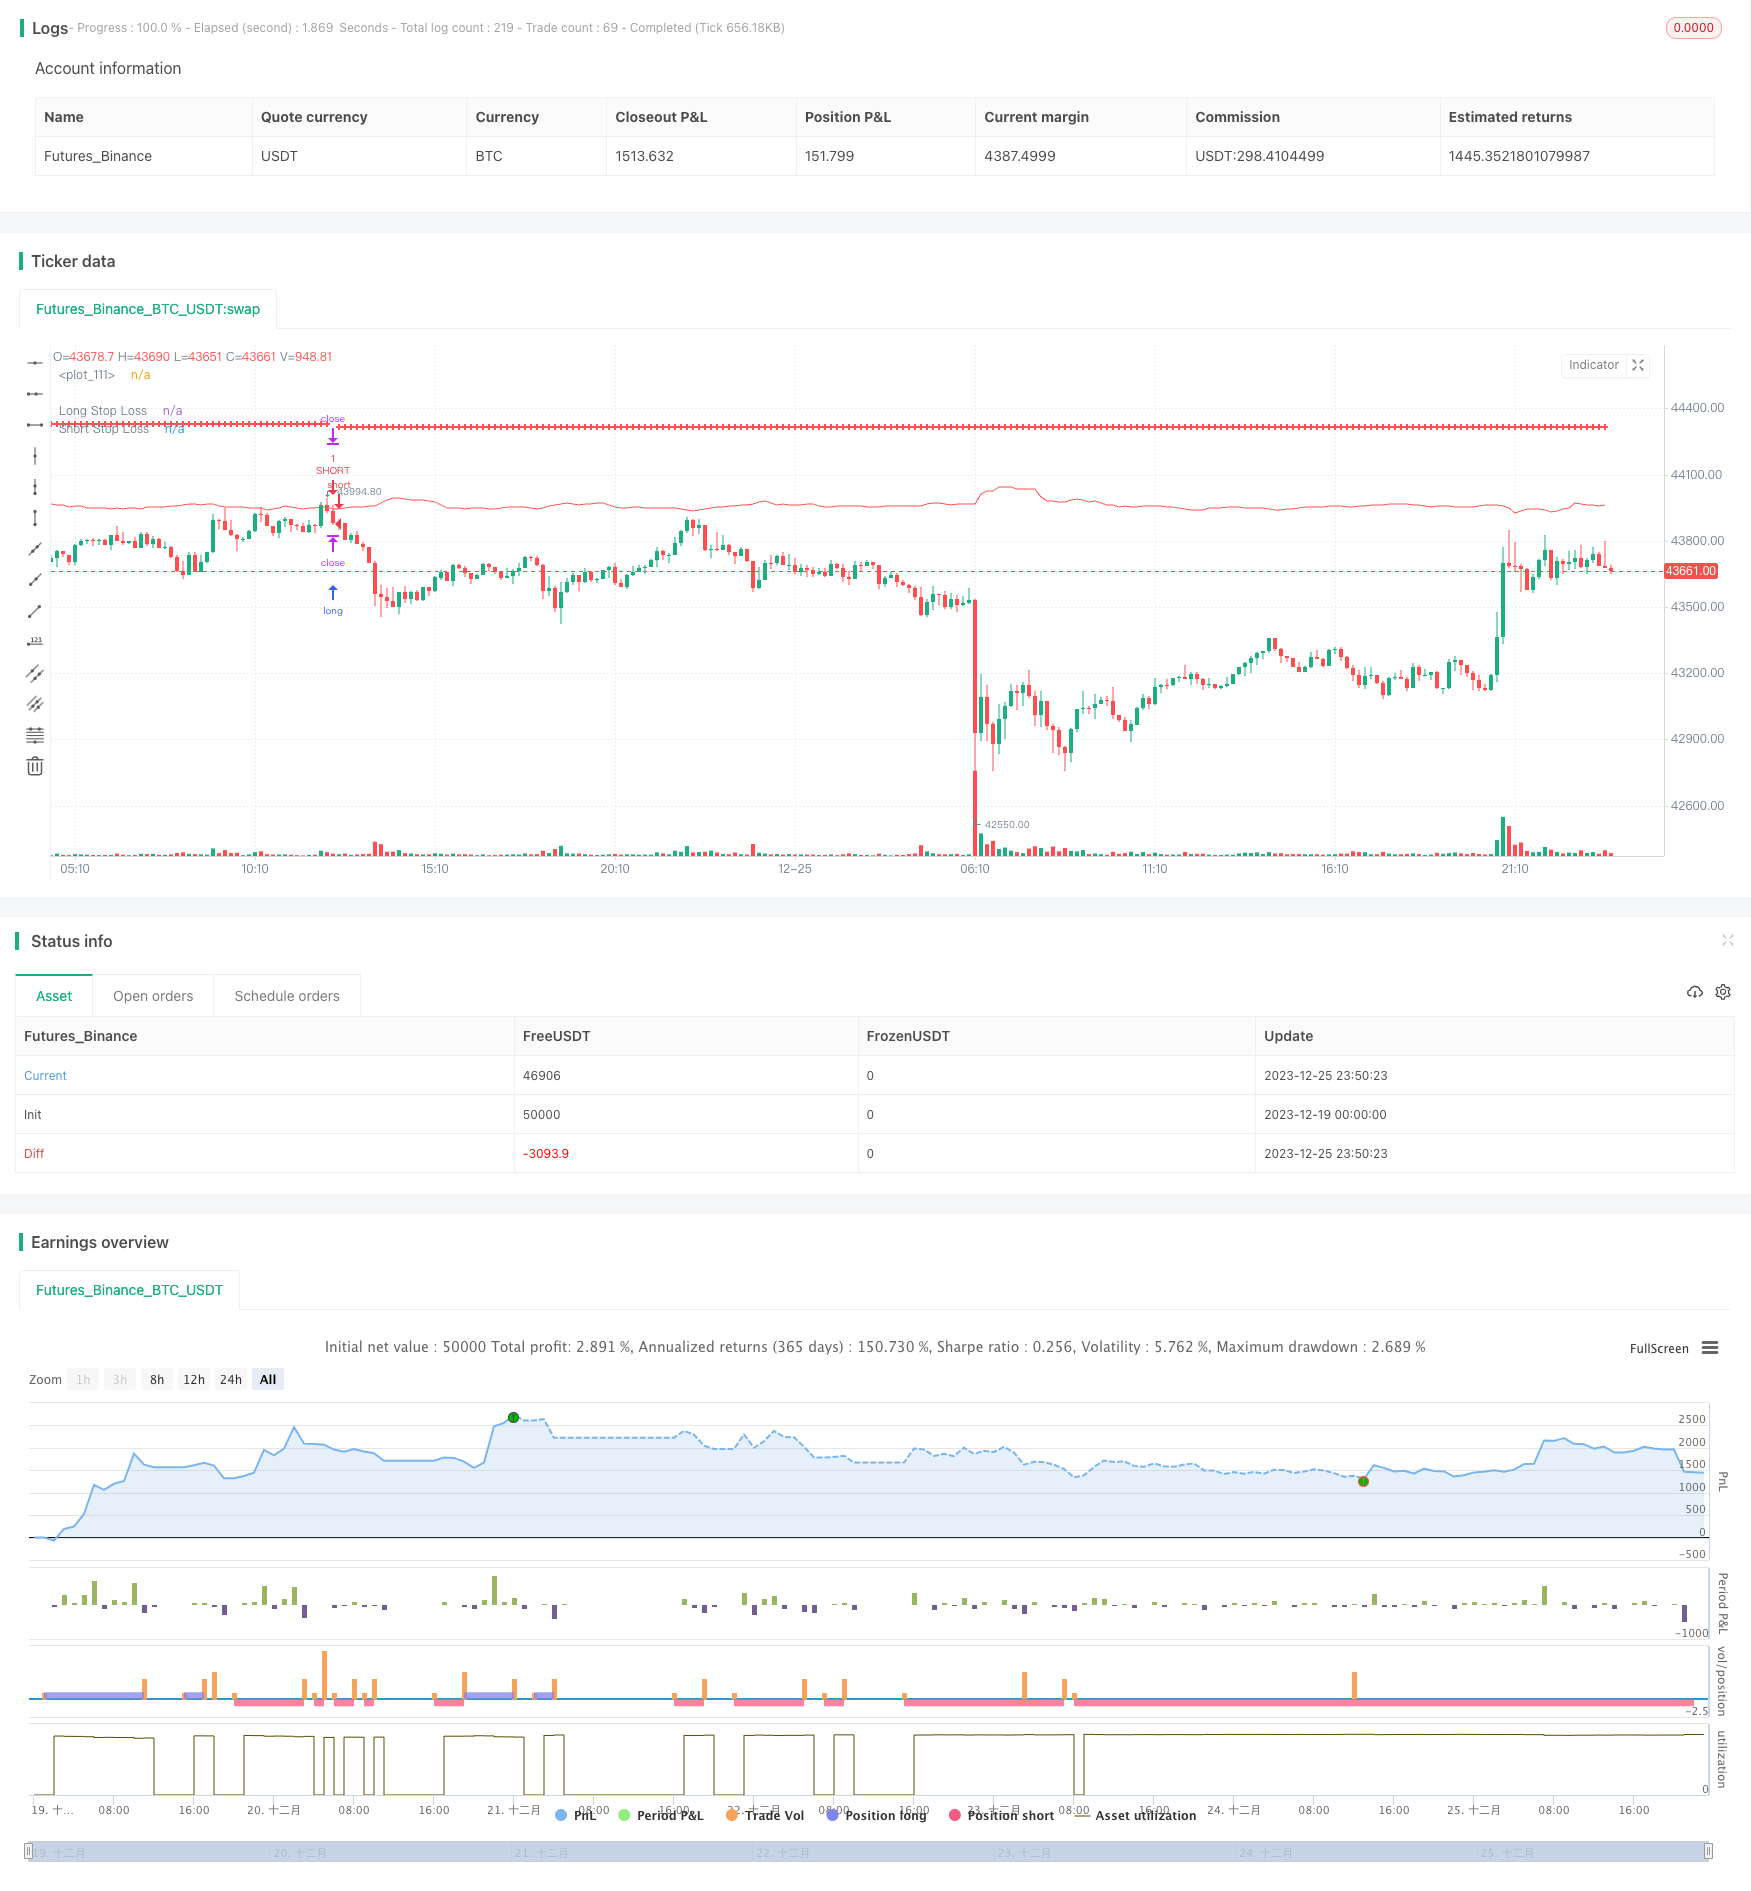
Die Strategie hat eine klare Gesamtkonzeption und verwendet benutzerdefinierte Indikatoren, um Trends zu identifizieren und Trends zu verfolgen. Aus Rückmeldungsergebnissen geht die Strategie gut und hat ein gewisses Potenzial für den Einsatz auf dem Markt. Die Signalqualität muss jedoch noch verifiziert werden, da sie nur auf einem einzigen Indikator basiert und eine gewisse Rückführung besteht.
/*backtest
start: 2023-12-19 00:00:00
end: 2023-12-26 00:00:00
period: 10m
basePeriod: 1m
exchanges: [{"eid":"Futures_Binance","currency":"BTC_USDT"}]
*/

// This source code is subject to the terms of the Mozilla Public License 2.0 at https://mozilla.org/MPL/2.0/

// © TraderHalai
// This is a backtest of the Smoothed Heikin Ashi Trend indicator, which computes the reverse candle close price required to flip a heikin ashi trend from red to green and vice versa. Original indicator can be found on the scripts section of my profile.

// Default testing parameters are 10% of equity position size, with a 1% stop loss on short and long strategy.opentrades.commission

// This particular back test uses this indicator as a Trend trading tool with a tight stop loss. The equity curve as tested seems promising but requires further work to refine. Note in an actual trading setup, you may wish to use this with volatilty filters as most of the losses are in sideways, low volatility markets.


//@version=5
strategy("Smoothed Heikin Ashi Trend on Chart - TraderHalai BACKTEST", " SHA Trend - BACKTEST", overlay=true)
//Inputs

i_useSmooth =       input ( true, "Use smoothing Heikin Ashi")
i_smoothingMethod = input.string("SMA", "Method", options=["SMA", "EMA", "HMA", "VWMA", "RMA"])
i_smoothingPeriod = input ( 10, "Smoothing period")

i_infoBox   =       input ( true, "Show Info Box"        )
i_decimalP  =       input ( 2,    "Prices Decimal Places")
i_boxOffSet =       input ( 5,    "Info Box Offset"      )
i_repaint   =       input (false,  "Repaint -  Keep on for live / Off for backtest")

i_longLossPerc = input.float(title="Long Stop Loss (%)",minval=0.0, step=0.1, defval=1) * 0.01

i_shortLossPerc = input.float(title="Short Stop Loss (%)", minval=0.0, step=0.1, defval=1) * 0.01


timeperiod = timeframe.period

//Security functions to avoid repaint, as per PineCoders
f_secureSecurity(_symbol, _res, _src) => request.security(_symbol, _res, _src[1], lookahead = barmerge.lookahead_on)
f_security(_symbol, _res, _src, _repaint) => request.security(_symbol, _res, _src[_repaint ? 0 : barstate.isrealtime ? 1 : 0])[_repaint ? 0 : barstate.isrealtime ? 0 : 1]
f_secSecurity2(_symbol, _res, _src) => request.security(_symbol, _res, _src[1])


candleClose = f_security(syminfo.tickerid, timeperiod, close, i_repaint)
candleOpen = f_security(syminfo.tickerid, timeperiod, open, i_repaint)
candleLow = f_security(syminfo.tickerid, timeperiod, low, i_repaint)
candleHigh = f_security(syminfo.tickerid, timeperiod, high, i_repaint)

haTicker = ticker.heikinashi(syminfo.tickerid)
haClose = f_security(haTicker, timeperiod, close, i_repaint)
haOpen = f_security(haTicker, timeperiod, open, i_repaint)
haLow = f_security(haTicker, timeperiod, low, i_repaint)
haHigh= f_security(haTicker, timeperiod, high, i_repaint)


reverseClose = (2 * (haOpen[1] + haClose[1])) - candleHigh - candleLow - candleOpen

if(reverseClose < candleLow)
    reverseClose := (candleLow + reverseClose) / 2

if(reverseClose > candleHigh)
    reverseClose := (candleHigh + reverseClose) / 2

//Smoothing

smaSmoothed = ta.sma(reverseClose, i_smoothingPeriod)
emaSmoothed = ta.ema(reverseClose, i_smoothingPeriod)
hmaSmoothed = ta.hma(reverseClose, i_smoothingPeriod)
vwmaSmoothed = ta.vwma(reverseClose, i_smoothingPeriod)
rmaSmoothed = ta.rma(reverseClose, i_smoothingPeriod)

shouldApplySmoothing = i_useSmooth and i_smoothingPeriod > 1

smoothedReverseClose = reverseClose

if(shouldApplySmoothing)
    if(i_smoothingMethod == "SMA")
        smoothedReverseClose := smaSmoothed
    else if(i_smoothingMethod == "EMA")
        smoothedReverseClose := emaSmoothed
    else if(i_smoothingMethod == "HMA")
        smoothedReverseClose := hmaSmoothed
    else if(i_smoothingMethod == "VWMA")
        smoothedReverseClose := vwmaSmoothed
    else if(i_smoothingMethod == "RMA")
        smoothedReverseClose := rmaSmoothed
    else
        smoothedReverseClose := reverseClose // Default to non-smoothed for invalid smoothing type

haBull = candleClose >= smoothedReverseClose
haCol = haBull ? color.green : color.red


//Overall trading strategy
if(ta.crossover(candleClose, smoothedReverseClose))
    strategy.entry("LONG", strategy.long, stop=smoothedReverseClose)
else
    strategy.cancel("LONG")

if(ta.crossunder(candleClose, smoothedReverseClose))
    strategy.entry("SHORT", strategy.short, stop=smoothedReverseClose)
else
    strategy.cancel("SHORT")


longStopPrice  = strategy.position_avg_price * (1 - i_longLossPerc)
shortStopPrice = strategy.position_avg_price * (1 + i_shortLossPerc)


plot(series=(strategy.position_size > 0) ? longStopPrice : na,
     color=color.red, style=plot.style_cross,
     linewidth=2, title="Long Stop Loss")
plot(series=(strategy.position_size < 0) ? shortStopPrice : na,
     color=color.red, style=plot.style_cross,
     linewidth=2, title="Short Stop Loss")

plot(smoothedReverseClose, color=haCol)

if (strategy.position_size > 0)
    strategy.exit(id="XL STP", stop=longStopPrice)

if (strategy.position_size < 0)
    strategy.exit(id="XS STP", stop=shortStopPrice)