Quantitativer Handel: volumengesteuerte Strategie
Überblick
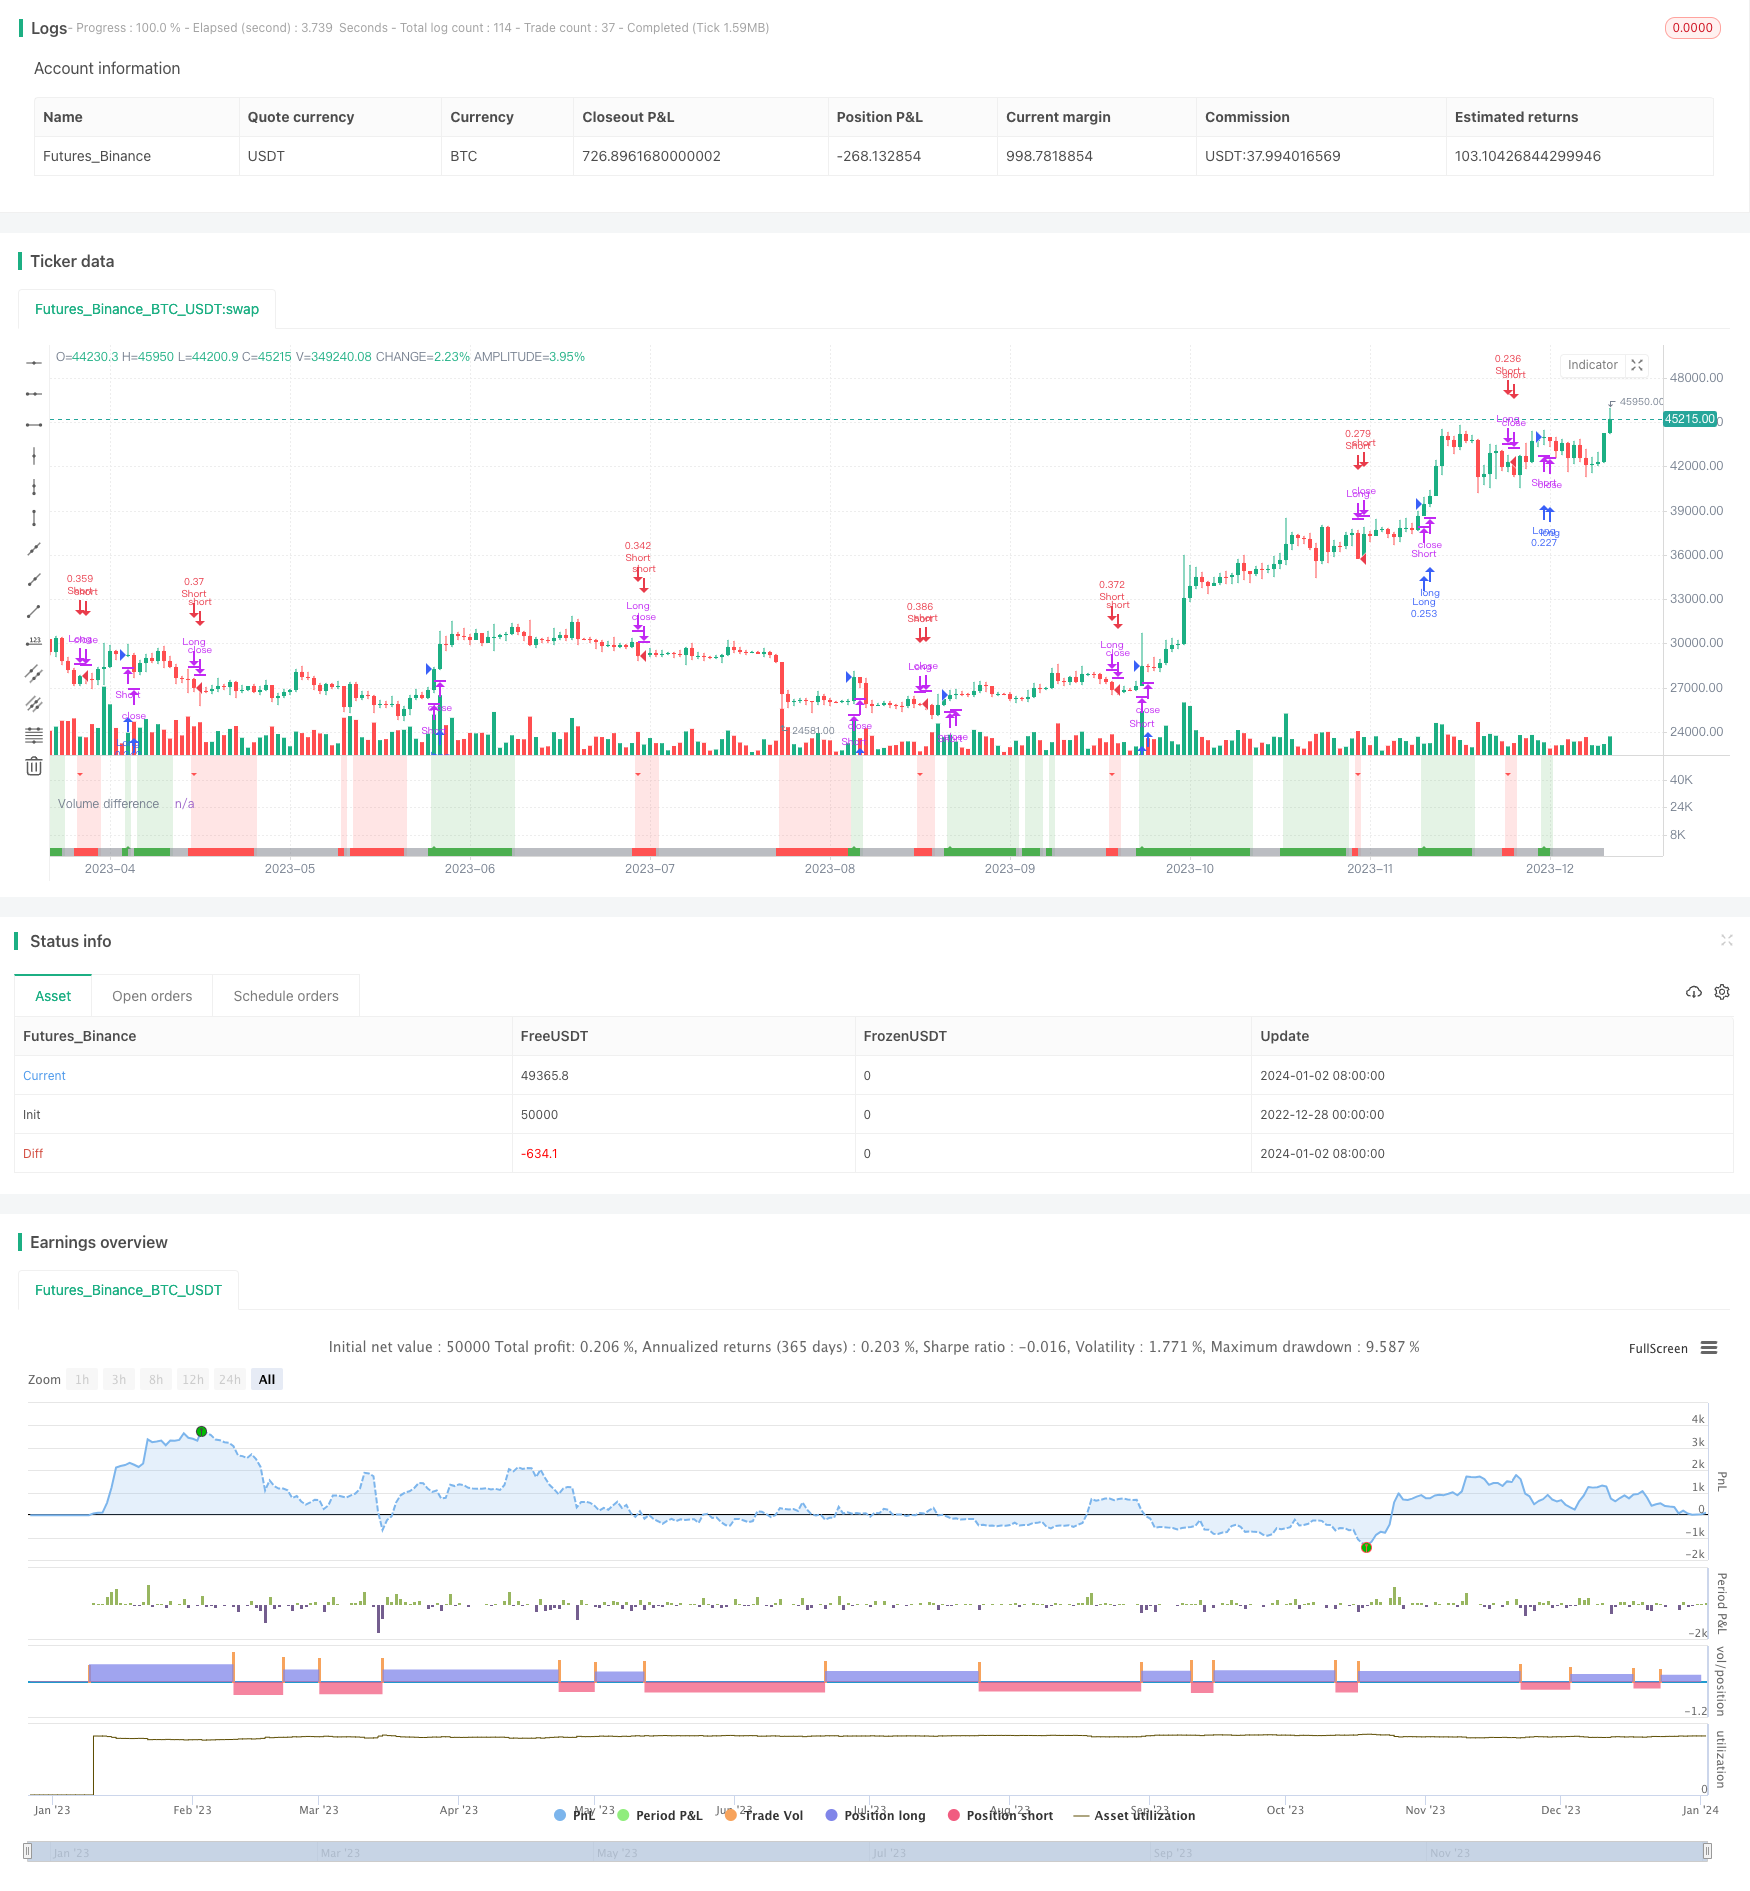
Die Quantitative-Driving-Strategie analysiert die Veränderung des Handelsvolumens und beurteilt die Verschiebung der Stimmung der Marktteilnehmer. Sie unterteilt das Handelsvolumen in mehrköpfige und leere Transaktionen und berechnet deren gewichtete Moving Averages. Sie erzeugt mehrköpfige Signale, wenn mehrköpfige Transaktionen im Vorteil sind, und leere Signale, wenn leere Transaktionen im Vorteil sind.
Strategieprinzip
Die Strategie teilt zunächst die Transaktionsmenge für jede K-Linie in mehrköpfige Transaktionsmenge und leere Transaktionsmenge, basierend auf der Beziehung zwischen dem Schlusskurs und dem Eröffnungskurs. Wenn der Schlusskurs größer als der Eröffnungskurs ist, ist die Transaktionsmenge der gesamten K-Linie mehrköpfig. Wenn der Schlusskurs kleiner als der Eröffnungskurs ist, wird die Mehrköpfigkeitsmenge der K-Linie im Verhältnis ((Höchster Preis - Eröffnungskurs) / ((Höchster Preis - Mindestpreis) berechnet, der Rest ist die Leerköpfigkeitsmenge).
Dann berechnet man den gewichteten Moving Average für den Mehrköpfertrag und den Leerköpfertrag der letzten n-Wurzel K-Linie. Wenn der Moving Average für den Mehrköpfertrag größer ist als der Moving Average für den Leerköpfertrag und die Differenz einen größeren Anteil des Mehrköpfertrags an der vorgegebenen Schwelle ausmacht, wird ein Mehrköpfertrag erzeugt. Die Regeln für die Erzeugung eines Leerköpfertrags sind ähnlich.
Es wurde auch ein Durchschnittswert für den Umsatz festgelegt, um die Bereiche zu identifizieren. Wenn der überflüssige Umsatz keine deutlichen Unterschiede aufweist, wird angedeutet, dass der Umsatz derzeit in der Berechnung ist.
Analyse der Stärken
- Die Verwendung von Handelsvolumeninformationen, um die Stimmung der Marktteilnehmer zu beurteilen, erzeugt theoretisch fundierte Signale.
- Automatische Identifizierung von Berechnungsbereichen, um wichtige Signale nicht zu verpassen
- Anpassbare Parameter für verschiedene Handelsarten und Zeiträume
- Mehrkopf- und Leerkopfsignale können einzeln beurteilt werden oder nur einseitige Signale verfolgt werden
Risikoanalyse
- Es besteht die Gefahr, dass die Transaktionsdaten manipuliert werden
- Standardparameter sind möglicherweise nicht für alle Sorten geeignet und müssen optimiert werden
- Fehl eingestellte Identifikationsparameter können das Signal verpassen
- Kurzzeitfehler möglich
Risiken können durch Optimierung von Parametern und Kombination anderer Indikatoren verringert werden.
Optimierungsrichtung
- Verschiedene Methoden zur Berechnung des Transaktionsvolumens testen
- Versuchen Sie es mit verschiedenen Moving Average-Typen, wie EMA, SMMA, etc.
- Optimierung der Periodenparameter für die Berechnung des Durchschnitts
- Optimierung der Identifizierung von Differenzparametern für die aufbereitete Transaktionsmenge
- Filtersignale in Kombination mit anderen technischen Indikatoren
Zusammenfassen
Quantity-Driven Strategien können allein oder in Kombination mit anderen Strategien eingesetzt werden, indem sie die Mehrraumverteilung des Handelsvolumens intelligent beurteilen und automatisch Marktgefühl und Trendänderungen beurteilen. Parameteroptimierung und eine Kombination von Indikatoren können die Stabilität und Profitabilität der Strategie weiter verbessern.
/*backtest
start: 2022-12-28 00:00:00
end: 2024-01-03 00:00:00
period: 1d
basePeriod: 1h
exchanges: [{"eid":"Futures_Binance","currency":"BTC_USDT"}]
*/

// This source code is subject to the terms of the Mozilla Public License 2.0 at https://mozilla.org/MPL/2.0/
// © Shuttle_Club
//@version=5

strategy('Volume fight strategy', default_qty_type=strategy.cash, default_qty_value=10000, currency='USD', commission_value=0.04, calc_on_order_fills=false, calc_on_every_tick=false, initial_capital=10000)

direction = input.string('ANY', 'Direction', options=['LONG', 'SHORT', 'ANY'], tooltip='Select the direction of trade.\n\nВыберите направление торговли.')
ma = input.int(11, 'Search_range', minval=1, tooltip='The range of estimation of the predominance of bullish or bearish volume (quantity bars). The smaller the TF, the higher the range value should be used to filter out false signals.\n\nДиапазон оценки преобладания бычьего или медвежьего объема (количество баров). Чем меньше ТФ, тем выше следует использовать значение диапазона, чтобы отфильтровать ложные сигналы.')
delta = input.float(15, 'Smoothing_for_flat,%', step=0.5, minval=0, tooltip='Smoothing to reduce false signals and highlight the flat zone. If you set the percentage to zero, the flat zones will not be highlighted, but there will be much more false signals, since the indicator becomes very sensitive when the smoothing percentage decreases.\n\nСглаживание для уменьшения ложных сигналов и выделения зоны флета. Если выставить процент равным нулю, то зоны флета выделяться не будут, но будет гораздо больше ложных сигналов, так как индикатор становится очень чувствительным при снижении процента сглаживания')
bgshow = input.bool(true, 'Show background zones', tooltip='Show the color background of the current trading zone.\n\nПоказывать цветовой фон текущей торговой зоны.')
all_signal_show = input.bool(false, 'Show each setup in zone', tooltip='Show every signals into trading zone.\n\nПоказывать каждый сигнал внутри торговой зоны.')

/////   CALCULATION
bull_vol = open < close ? volume : volume * (high - open) / (high - low)  //determine the share of bullish volume
bear_vol = open > close ? volume : volume * (open - low) / (high - low)  //determine the share of bearish volume
avg_bull_vol = ta.vwma(bull_vol, ma)  //determine vwma
avg_bear_vol = ta.vwma(bear_vol, ma)
diff_vol = ta.sma(avg_bull_vol / volume - 1 - (avg_bear_vol / volume - 1), ma)  //normalize and smooth the values
vol_flat = math.abs(avg_bull_vol + avg_bear_vol) / 2  //determine average value for calculation flat-filter

/////   SIGNALS
up = int(na), up := nz(up[1])
dn = int(na), dn := nz(dn[1])
bull = avg_bull_vol > avg_bear_vol and vol_flat / avg_bull_vol < 1 - delta / 100  //determine up zones
bear = avg_bull_vol < avg_bear_vol and vol_flat / avg_bear_vol < 1 - delta / 100  //determine dn zones

if bull
    up += 1, dn := 0
    dn
if bear
    dn += 1, up := 0
    up
if not bull and not bear and all_signal_show
    up := 0, dn := 0
    dn

/////   PLOTTING
plotshape(bull and up == 1, 'UP', location=location.bottom, style=shape.triangleup, color=color.new(color.green, 0), size=size.tiny)
plotshape(bear and dn == 1, 'DN', location=location.top, style=shape.triangledown, color=color.new(color.red, 0), size=size.tiny)
bgcolor(title='Trading zones', color=bgshow and avg_bull_vol > avg_bear_vol and vol_flat / avg_bull_vol < 1 - delta / 100 ? color.new(color.green, 85) : bgshow and avg_bull_vol < avg_bear_vol and vol_flat / avg_bear_vol < 1 - delta / 100 ? color.new(color.red, 85) : na)
plot(diff_vol, 'Volume difference', style=plot.style_area, color=avg_bull_vol > avg_bear_vol and vol_flat / avg_bull_vol < 1 - delta / 100 ? color.new(color.green, 0) : avg_bull_vol < avg_bear_vol and vol_flat / avg_bear_vol < 1 - delta / 100 ? color.new(color.red, 0) : color.new(color.gray, 50))

strategy.close('Short', comment='close', when=bull and up == 1)
strategy.close('Long', comment='close', when=bear and dn == 1)
strategy.entry('Long', strategy.long, when=direction != 'SHORT' and bull and up == 1)
strategy.entry('Short', strategy.short, when=direction != 'LONG' and bear and dn == 1)

if bull and up==1
    alert('Bullish movement! LONG trading zone', alert.freq_once_per_bar_close)
if bear and dn==1
    alert('Bearish movement! SHORT trading zone', alert.freq_once_per_bar_close)