Quantitative Handelsstrategie basierend auf Bollinger Bands und VWAP
Überblick
Die Strategie kombiniert zwei Indikatoren, die Brin-Band (BB) und die typische Preis-Wert-Durchschnittslinie (VWAP), um Kauf- und Verkaufsentscheidungen zu treffen. Sie kann kurzfristige Preisanomalien entdecken und dann handeln, die für einen kurzen Handel geeignet sind.
Strategieprinzip
Die Strategie basiert auf den folgenden Regeln:
Die schnelle EMA-Linie ist höher als die langsame EMA-Linie als Voraussetzung für die Beurteilung des Trends
Wenn der Schlusskurs höher als VWAP ist, wird er als Preisanstieg beurteilt und gekauft
Wenn eine der vorherigen 10 K-Linien einen Schlusskurs unter dem Brin-Unterlauf hat, wird dies als außergewöhnlicher Kauf bewertet
Wenn der Schlusskurs höher als der Brin-Kurs ist, wird der Kurs umgekehrt und verkauft.
Die Strategie beurteilt zunächst die 50-Tage-EMA höher als die 200-Tage-EMA und verwendet die schnelle EMA, um den Trend zu beurteilen. Dann wird in Kombination mit dem VWAP beurteilt, ob der Preis in der kurzen Zeit in einer aufsteigenden Tendenz ist.
Die Exit-Regel ist einfacher: Wenn der Preis höher ist als der Bollinger Band-Rhythmus, wird der Preis als umgekehrt bezeichnet und ausgetreten.
Analyse der Stärken
Die Strategie kombiniert mehrere Indikatoren, um Ausnahmen bei der Preisbeurteilung zu ermitteln, was die Wirksamkeit des Eintrittssignals erhöht. Die Verwendung von EMAs, um große Trends zu beurteilen, verhindert Rückwärtsoperationen. In Kombination mit VWAPs können kurzfristige Preiserhöhungschancen erfasst werden.
Risikoanalyse
- Die EMA entscheidet, dass ein Trendbeurteil nicht zu einer Gegenbewegung führen darf
- VWAP-Indikatoren sind am besten für Stunden- oder Tagesdaten geeignet, bei Tageszeiten gibt es einen Rabatt
- Die Brin-Band-Parameter sind nicht korrekt eingestellt, und zu breite oder zu schmale Up-and-Down-Streckenbeschränkungen führen zu Signalfehlern.
Angesichts dieser Risiken kann man die EMA-Zyklusparameter entsprechend anpassen oder andere Trend-Beschätzungs-Indikatoren ausprobieren. Die VWAP-Parameter werden für Intra-Tagesdaten verwendet oder für andere Short-Line-Indikatoren angepasst. Die Brin-Band-Parameter werden angepasst, um die optimale Bandbreite zu finden.
Optimierungsrichtung
- Versuchen Sie es mit anderen Indikatoren wie MACD
- Optimierung der EMA- und Brin-Band-Parameter für eine optimale Konfiguration
- Erhöhung der Stop-Loss-Mechanismen
- In Kombination mit anderen Indikatoren filtern falsche Signale
- Verschiedene Sorten und Zyklusdaten testen
Zusammenfassen
Die Strategie kombiniert die beiden Indikatoren Brin-Band und VWAP, um kurzfristige Preisunregelmäßigkeiten als Einstiegsmomente zu beurteilen. Die Verwendung von EMAs, um große Trends zu beurteilen, um Rückschläge zu vermeiden.
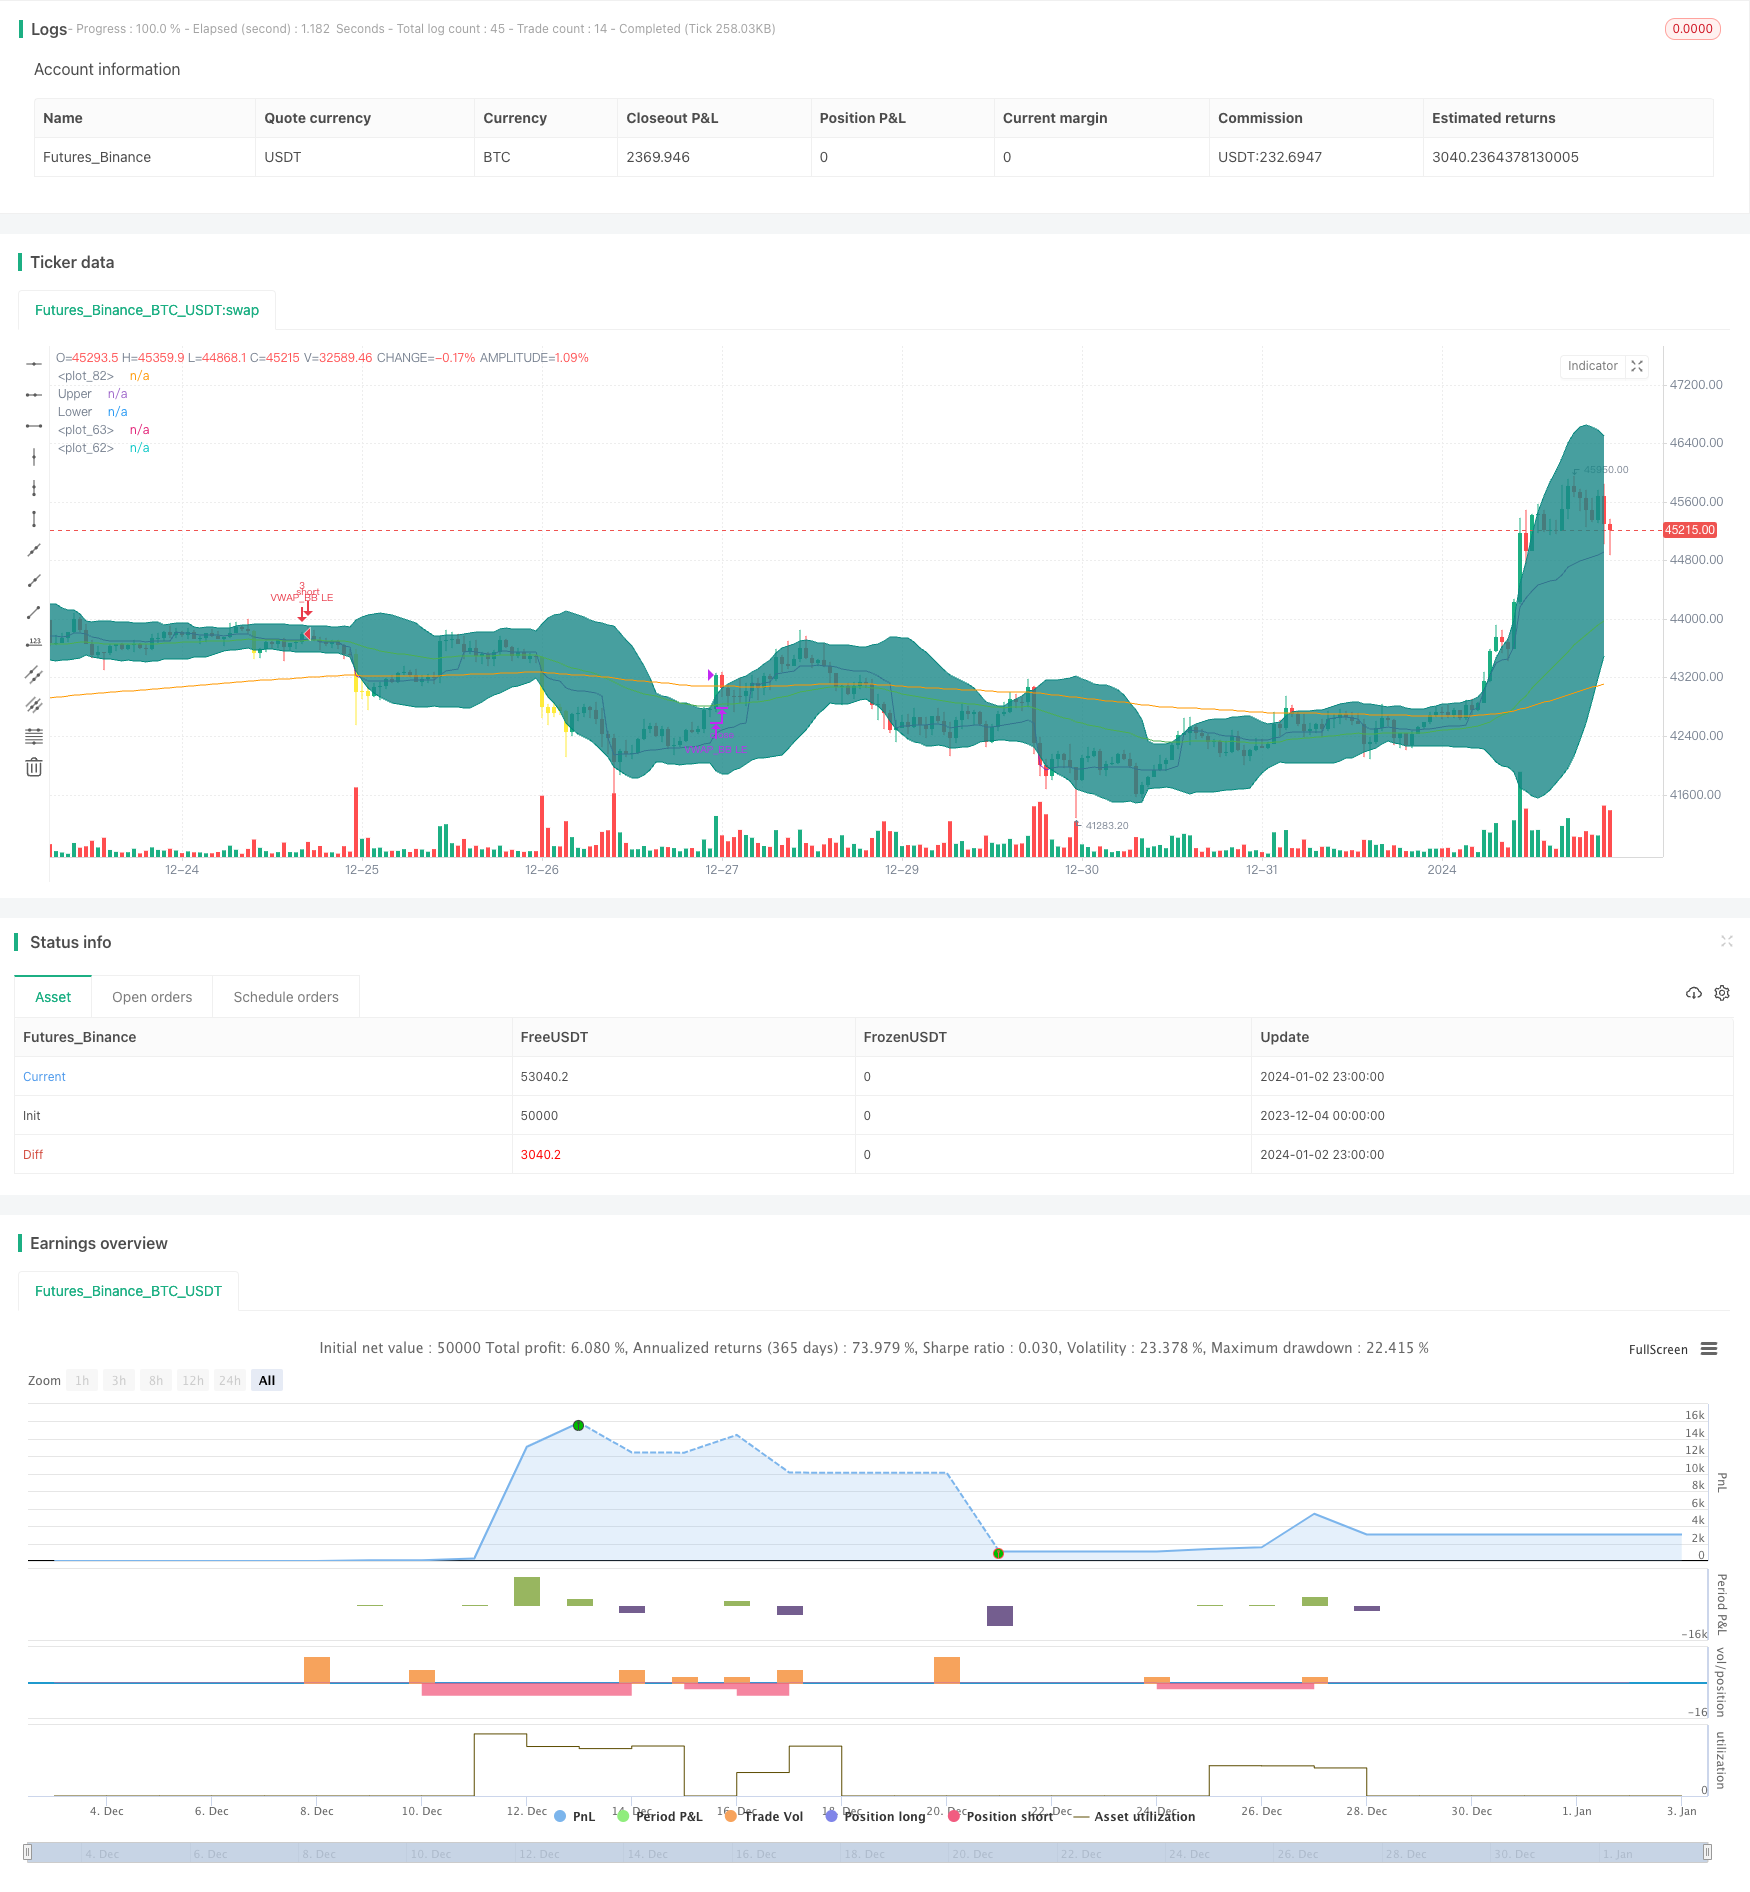
/*backtest
start: 2023-12-04 00:00:00
end: 2024-01-03 00:00:00
period: 1h
basePeriod: 15m
exchanges: [{"eid":"Futures_Binance","currency":"BTC_USDT"}]
*/

// This source code is subject to the terms of the Mozilla Public License 2.0 at https://mozilla.org/MPL/2.0/
// © mohanee

//@version=4
strategy(title="VWAP and BB strategy [EEMANI]", overlay=true,pyramiding=2, default_qty_value=3, default_qty_type=strategy.fixed,    initial_capital=10000, currency=currency.USD)
//This strategy combines VWAP and BB indicators
//BUY RULE
//1. EMA50 > EMA 200
//2. if current close > vwap session  value
//3. check if  price dipped BB lower band for any of last 10 candles
//EXIT RULE
//1. price closes above BB upper band
//STOP LOSS EXIT
//1. As configured --- default is set to 5%

is_price_dipped_bb(pds,source1) =>
    t_bbDipped=false
    for i=1 to pds
        t_bbDipped:=  (t_bbDipped   or  close[i]<source1) ? true : false
        if t_bbDipped==true
            break
        else
            continue

    t_bbDipped

// variables  BEGIN
shortEMA = input(50, title="fast EMA", minval=1)
longEMA = input(200, title="slow EMA", minval=1)

//BB

smaLength = input(20, title="BB SMA Length", minval=1)
bbsrc = input(close, title="BB Source")


//addOnDivergence = input(true,title="Add to existing on Divergence")
//exitOption = input(title="exit on RSI or BB", type=input.string, options=["RSI", "BB"],      defval="BB")

//bbSource = input(title="BB  source", type=input.string, options=["close", "vwap"],      defval="close")

//vwap_res = input(title="VWAP Resolution", type=input.resolution, defval="session")
stopLoss = input(title="Stop Loss%", defval=5, minval=1)

//variables  END


longEMAval= ema(close, longEMA)
shortEMAval= ema(close, shortEMA)


vwapVal=vwap(close)


// Drawings

//plot emas
plot(longEMAval, color = color.orange, linewidth = 1, transp=0)
plot(shortEMAval, color = color.green, linewidth = 1, transp=0)


//bollinger calculation
mult = input(2.0, minval=0.001, maxval=50, title="StdDev")
basis = sma(bbsrc, smaLength)
dev = mult * stdev(bbsrc, smaLength)
upperBand = basis + dev
lowerBand = basis - dev
offset = input(0, "Offset", type = input.integer, minval = -500, maxval = 500)
//bollinger calculation

//plot bb
//plot(basis, "Basis", color=#872323, offset = offset)
p1 = plot(upperBand, "Upper", color=color.teal, offset = offset)
p2 = plot(lowerBand, "Lower", color=color.teal, offset = offset)
fill(p1, p2, title = "Background", color=#198787, transp=95)


plot(vwapVal, color = color.purple, linewidth = 1, transp=0)


// Colour background

barcolor(shortEMAval>longEMAval and close<=lowerBand ? color.yellow: na)


//longCondition=  shortEMAval > longEMAval and  close>open and  close>vwapVal
longCondition= shortEMAval >= longEMAval  and  close>=vwapVal and close>open  //      close>vwapVal   and


//Entry
strategy.entry(id="VWAP_BB LE", comment="VB LE" , long=true,  when= longCondition and  is_price_dipped_bb(10,lowerBand) )  //and strategy.position_size<1

//add to the existing position
//strategy.entry(id="VWAP_RSI LE", comment="VR LE Add" , long=true,  when= addOnDivergence==true and strategy.position_size>=1 and close<strategy.position_avg_price   and (close<lowerBand or  low<lowerBand) and rsiVal>rsi_buy_line)

barcolor(strategy.position_size>=1  ? color.blue: na)


strategy.close(id="VWAP_BB LE", comment="TP Exit VB LE",   when=crossover(close,upperBand) )

//stoploss
stopLossVal =   strategy.position_avg_price * (1-(stopLoss*0.01) )
strategy.close(id="VB LE", comment="SL Exit",   when= close < stopLossVal)