Trendfolgestrategie basierend auf Average True Range
Überblick
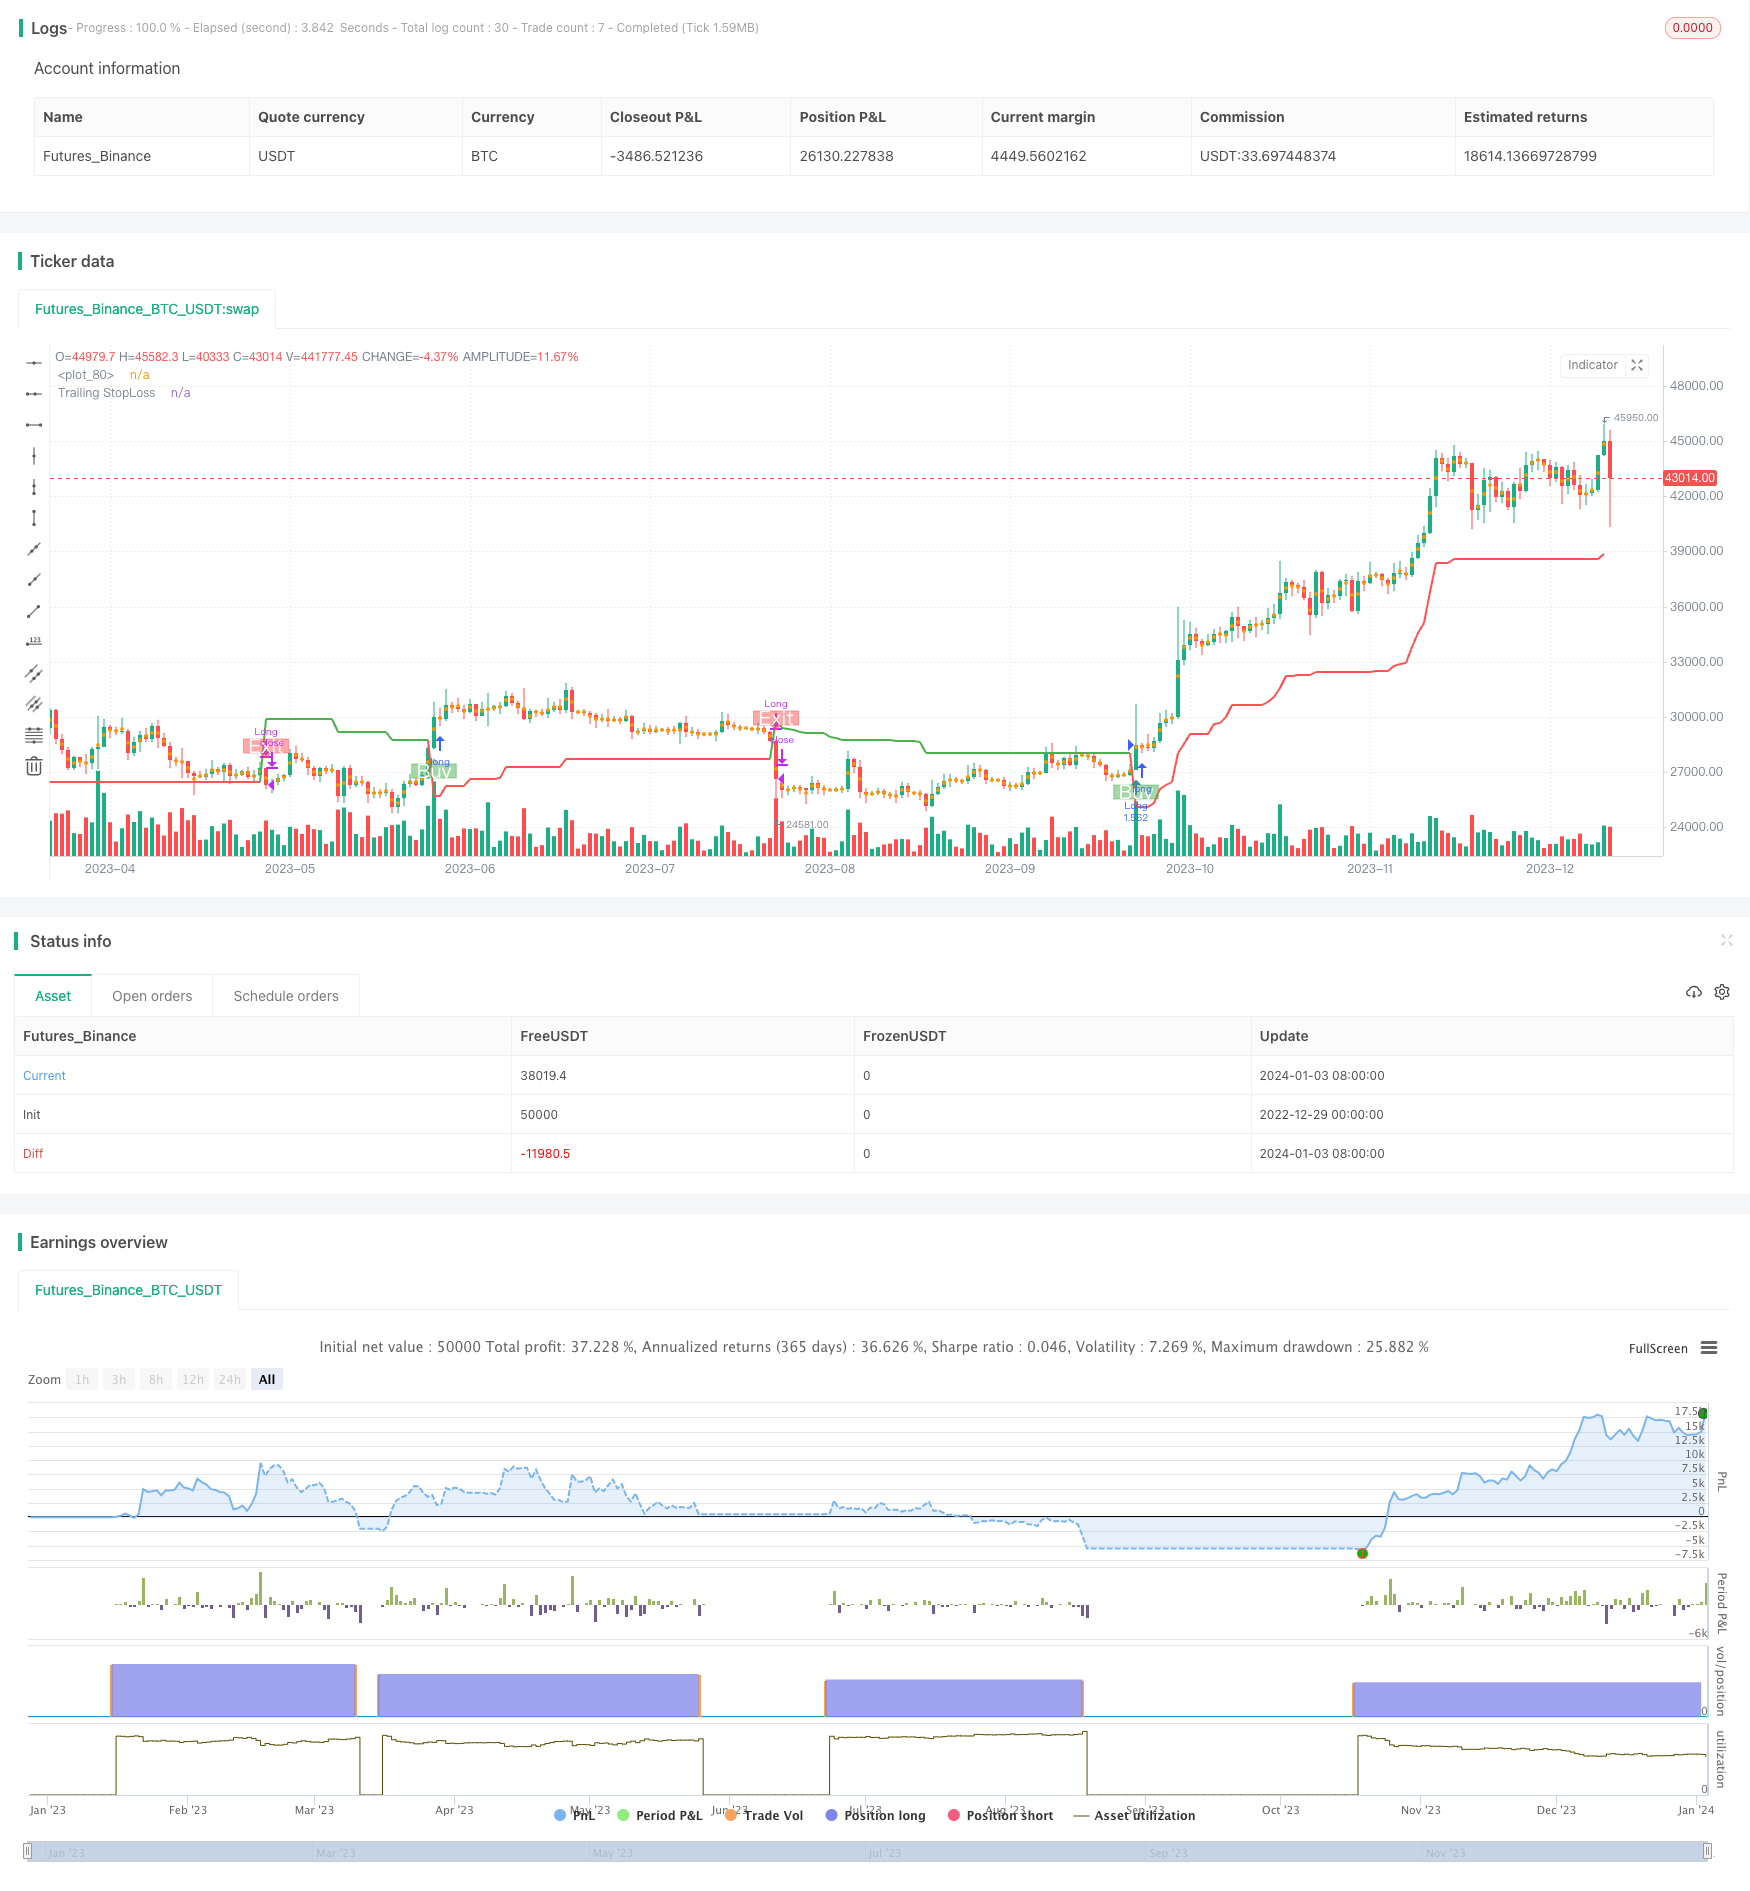
Die Strategie ist eine Trend-Tracking-Strategie, die auf der durchschnittlichen realen Breite der Wellen (ATR) basiert. Sie verwendet die ATR, um den Indikatorwert zu berechnen, um die Richtung der Preisentwicklung zu bestimmen. Die Strategie bietet gleichzeitig einen Stop-Loss-Mechanismus zur Risikokontrolle.
Strategieprinzip
Die Strategie verwendet drei Hauptparameter: Period, Multiplikator und Entry/Exit Point. Die Standardparameter sind 14-Zyklus-ATR und 4-fach Multiplikator.
Die Strategie berechnet zunächst den Mehrkopf-Mittelwert (buyavg) und den Leerkopf-Mittelwert (sellavg) und vergleicht dann die Beziehung zwischen den Preisen und diesen beiden Leerkopf-Mittelwerten, um die aktuelle Trendrichtung zu bestimmen. Wenn der Preis höher als der Leerkopf-Mittelwert ist, wird er als Mehrkopf beurteilt; wenn der Preis niedriger als der Mehrkopf-Mittelwert ist, wird er als Leerkopf beurteilt.
Darüber hinaus wird die Strategie in Kombination mit ATR eingesetzt, um einen Trailing Stop Loss zu erstellen. Konkret wird der 14-Zyklus-gewichtete Moving Average von ATR mit einem Multiplikator multipliziert mit dem Default (4) als Stop-Distance. So kann der Stop-Distance je nach Marktschwankungen angepasst werden.
Wenn ein Stop-Loss ausgelöst wird, wird die Strategie ausgeglichen und Gewinne erzielt.
Strategische Vorteile
- Das Unternehmen ist in der Lage, auf Basis von Trends zu handeln und nachhaltig zu profitieren.
- Mit ATR kann die Stoppdistanz dynamisch angepasst werden, um das Risiko effektiv zu kontrollieren
- Die Berechnung von Kauf- und Verkaufspunkten ist einfach, unkompliziert und leicht verständlich.
Risiken und Gegenmaßnahmen
- Wenn sich der Trend ändert, kann es zu größeren Verlusten kommen.
- ATR-Zyklen und Multiplikationen angepasst, um die Stop-Loss-Distanz zu optimieren
- WILL verursachte mehrere kleine Verluste während der Erschütterung.
- Mehr Filterbedingungen, um die Marktschwankungen zu vermeiden
- Fehlende Parameter können zu schlechten Effekten führen
- Optimierungstests mit mehreren Kombinationsparametern, um die optimalen Parameter zu finden
Richtung der Strategieoptimierung
- Hinzufügen von anderen Kennzahlen, um das Filtersignal zu beurteilen und den Einstieg in den Schaukel zu vermeiden
- Optimierung der ATR-Zyklen und der Multiplikatorparameter, um die Stop-Loss-Distanz zu optimieren
- Einführung von Positionskontrollen für die Eröffnung von Positionen, um die Größe der Positionen an die Marktlage anzupassen
Zusammenfassen
Die Strategie ist insgesamt eine einfache und praktische Trend-Tracking-Strategie. Sie erfordert nur wenige Parameter und kann durch ATR dynamisch angepasste Stop-Loss-Systeme implementiert werden, um das Risiko wirksam zu kontrollieren. Wenn sie mit anderen Hilfsmessgrößen kombiniert wird, kann sie weiter optimiert werden, um einige Geräusche zu filtern.
/*backtest
start: 2022-12-29 00:00:00
end: 2024-01-04 00:00:00
period: 1d
basePeriod: 1h
exchanges: [{"eid":"Futures_Binance","currency":"BTC_USDT"}]
*/

//@version=5
strategy('Trend Strategy by zdmre', shorttitle='Trend Strategy', overlay=true, pyramiding=0, currency=currency.USD, default_qty_type=strategy.percent_of_equity, initial_capital=10000, default_qty_value=100, commission_type=strategy.commission.percent, commission_value=0.005)
show_STOPLOSSprice = input(true, title='Show TrailingSTOP Prices')
src = input(close, title='Source')
out2 = ta.ema(src, 20)

buyavg = (close + high) / 2.02 - high * (1 - open / close) * (1 - low * open / (high * close))
sellavg = ((low + close) / 1.99 + low * (1 - low / open) * (1 - low * open / (close * high)) / 1.1 + out2 )/ 2

// === INPUT BACKTEST RANGE ===
fromMonth = input.int(defval=1, title='From Month', minval=1, maxval=12)
fromDay = input.int(defval=1, title='From Day', minval=1, maxval=31)
fromYear = input.int(defval=2021, title='From Year', minval=1970)
thruMonth = input.int(defval=1, title='Thru Month', minval=1, maxval=12)
thruDay = input.int(defval=1, title='Thru Day', minval=1, maxval=31)
thruYear = input.int(defval=2100, title='Thru Year', minval=1970)

// === INPUT SHOW PLOT ===
showDate = input(defval=true, title='Show Date Range')

// === FUNCTION EXAMPLE ===
start = timestamp(fromYear, fromMonth, fromDay, 00, 00)  // backtest start window
finish = timestamp(thruYear, thruMonth, thruDay, 23, 59)  // backtest finish window
window() => true


// === TRAILING STOP LOSS === //

ATR_Period = input(14)
ATR_Mult = input(4.0)
var float ATR_TrailSL = na
var int pos = na
atr = ta.rma (ta.tr(true), 14)
xATR = ta.atr(ATR_Period)
nLoss = ATR_Mult * xATR

iff_1 = close > nz(ATR_TrailSL[1], 0) ? close - nLoss : close + nLoss
iff_2 = close < nz(ATR_TrailSL[1], 0) and close[1] < nz(ATR_TrailSL[1], 0) ? math.min(nz(ATR_TrailSL[1]), close + nLoss) : iff_1
ATR_TrailSL := close > nz(ATR_TrailSL[1], 0) and close[1] > nz(ATR_TrailSL[1], 0) ? math.max(nz(ATR_TrailSL[1]), close - nLoss) : iff_2

iff_3 = close[1] > nz(ATR_TrailSL[1], 0) and close < nz(ATR_TrailSL[1], 0) ? -1 : nz(pos[1], 0)
pos := close[1] < nz(ATR_TrailSL[1], 0) and close > nz(ATR_TrailSL[1], 0) ? 1 : iff_3

atr_color = pos == -1 ? color.green : pos == 1 ? color.red : color.aqua
atrtrend = plot(ATR_TrailSL, 'Trailing StopLoss', atr_color, linewidth=2)

// ===  Stop Loss === //
slGroup = 'Stop Loss'
useSL = input.bool(false, title='╔══════   Enable   ══════╗', group=slGroup, tooltip='If you are using this strategy for Scalping or Futures market, we do not recommend using Stop Loss.')
SLbased = input.string(title='Based on', defval='Percent', options=['ATR', 'Percent'], group=slGroup, tooltip='ATR: Average True Range\nPercent: eg. 5%.')
multiATR = input.float(10.0, title='ATR   Mult', group=slGroup, inline='atr')
lengthATR = input.int(14, title='Length', group=slGroup, inline='atr')
SLPercent = input.float(5, title='Percent', group=slGroup) * 0.01
Shortposenter = input.bool(false, title='ShortPosition')

longStop = 0.0
shortStop = 0.0

if SLbased == 'ATR'
    longStop := ta.valuewhen(pos == 1, low, 0) - ta.valuewhen(pos == 1, ta.rma(ta.tr(true), lengthATR), 0) * multiATR
    longStopPrev = nz(longStop[1], longStop)
    longStop := close[1] > longStopPrev ? math.max(longStop, longStopPrev) : longStop

    shortStop := ta.valuewhen(pos == -1, ta.rma(ta.tr(true), lengthATR), 0) * multiATR + ta.valuewhen(pos == -1, high, 0)
    shortStopPrev = nz(shortStop[1], shortStop)
    shortStop := close[1] > shortStopPrev ? math.max(shortStop, shortStopPrev) : shortStop
    shortStop
if SLbased == 'Percent'
    longStop := strategy.position_avg_price * (1 - SLPercent)
    shortStop := strategy.position_avg_price * (1 + SLPercent)
    shortStop
exitLong  = pos == -1

// === PlotColor === //
buySignal = pos == 1 and pos[1] == -1
plotshape(buySignal, title="Long", location=location.belowbar, style=shape.labelup, size=size.normal, color=color.new(color.green,50), text='Buy', textcolor=color.white)
exitSignal = pos == -1 and pos[1] == 1
plotshape(exitSignal, title="Exit", location=location.abovebar, style=shape.labeldown, size=size.normal, color=color.new(color.red,50), text='Exit', textcolor=color.white)

hPlot = plot(ohlc4, title="", style=plot.style_circles, linewidth=0, editable = false)
longFill = (pos == 1 ? color.new(color.green,80) : na)
shortFill = (pos == -1 ? color.new(color.red,80) : na)
fill(hPlot, atrtrend,color=longFill)
fill(hPlot,atrtrend, color=shortFill)

// === Strategy === //
strategy.entry('Long', strategy.long,limit = buyavg, when=window() and pos == 1,comment="Entry: "+str.tostring(buyavg))
strategy.close('Long', when=window() and exitLong , comment='Exit: '+str.tostring(sellavg) )

if Shortposenter
    strategy.entry('Short', strategy.short, when=window() and pos== -1,comment="Entry: "+str.tostring(close))
    strategy.close('Short', when=window() and pos == 1 , comment='Exit: ')

if useSL
    strategy.exit('Stop Loss', 'Long', stop=longStop)

// === Show StopLoss Price === //
if show_STOPLOSSprice
    if pos == -1
        label ShortStop = label.new(bar_index, na, 'SL: ' + str.tostring(ATR_TrailSL), color=color.green, textcolor=color.white, style=label.style_none, yloc=yloc.abovebar, size=size.small)
        label.delete(ShortStop[1])

    if pos == 1
        label LongStop = label.new(bar_index, na, 'SL: ' + str.tostring(ATR_TrailSL), color=color.red, textcolor=color.white, style=label.style_none, yloc=yloc.belowbar, size=size.small)
        label.delete(LongStop[1])