Signalstrategie für gleitende Durchschnitte mit Überkreuzung
Erstellungsdatum:
2024-01-08 15:54:32
zuletzt geändert:
2024-01-08 15:54:32
Kopie:
0
Klicks:
799
1
konzentrieren Sie sich auf
1750
Anhänger
Überblick
Die Strategie ermöglicht die Kreuzung von Moving Averages durch die Berechnung und Abbildung verschiedener Arten von Moving Averages, die als Kauf- und Verkaufssignale verwendet werden.
Strategieprinzip
- Die Strategie erlaubt die Auswahl verschiedener Arten von Moving Averages, darunter SMA, EMA, WMA, etc.
- Die Strategie berechnet den primären Moving Average und erlaubt auch die Auswahl des zweiten Moving Averages.
- Der Markt wird durch die Kreuzung des Haupt- und des Zweit-Bewegungs-Durchschnitts beurteilt.
- Ein Kaufsignal wird erzeugt, wenn ein Moving Average, der seinen eigenen bestimmten Zeitraum über dem Hauptbeweglichen Durchschnitt durchläuft, ein Kaufsignal erzeugt; ein Verkaufsignal wird erzeugt, wenn ein Moving Average, der seinen eigenen bestimmten Zeitraum unter dem Hauptbeweglichen Durchschnitt durchläuft.
- Auf diese Weise kann man durch die Kreuzung von Moving Averages einen klareren Einblick in die hohe Leerheit des Marktes erhalten.
Strategische Vorteile
- Die Art der Moving Average kann für verschiedene Bedürfnisse angepasst werden.
- Ein zweiter Moving Average kann hinzugefügt werden, um das Signal klarer zu machen.
- Anpassbare Moving Average-Perioden für verschiedene Zeiträume.
- Die Farbgebung kann geschliffen werden, um die Grafik zu verbessern.
- Die Verwendung eines Kreuzsignalmechanismus ermöglicht eine genaue Bestimmung der Luftlage.
Strategische Risiken und Optimierungen
- Bewegliche Durchschnittswerte sind rückläufig und können falsche Signale verursachen. Die Kurve kann entsprechend dem Beweglichen Durchschnitt angepasst werden.
- Unkorrekt eingestellte Moving Average-Perioden können zu verpassten Handelschancen führen. Weitere Kombinationen können getestet werden, um die besten Parameter zu finden.
- Es wird empfohlen, die Verifizierung in Verbindung mit anderen Indikatoren, wie z. B. der Energieindicator, durchzuführen, um das Risiko zu verringern.
- Es kann in Erwägung gezogen werden, den Moving Average des Signals in einen Curl Average umzuwandeln, um die Signalgenauigkeit zu verbessern.
- Strategische Optimierungen können mit Deep Learning-Modellen wie LSTM kombiniert werden.
Zusammenfassen
Die Strategie ist überwiegend übersichtlich, nutzt das Moving Average-Cross-Prinzip zur Beurteilung von Markttrennungen und kann mit individuellen Parametern für unterschiedliche Bedürfnisse angepasst werden. Es gibt jedoch einige Probleme, die jedoch durch Optimierung der Modelle und Parameter verbessert werden können. Insgesamt ist die Strategie ein typisches Beispiel für eine Handelsstrategie auf Basis von Moving Averages.
Strategiequellcode
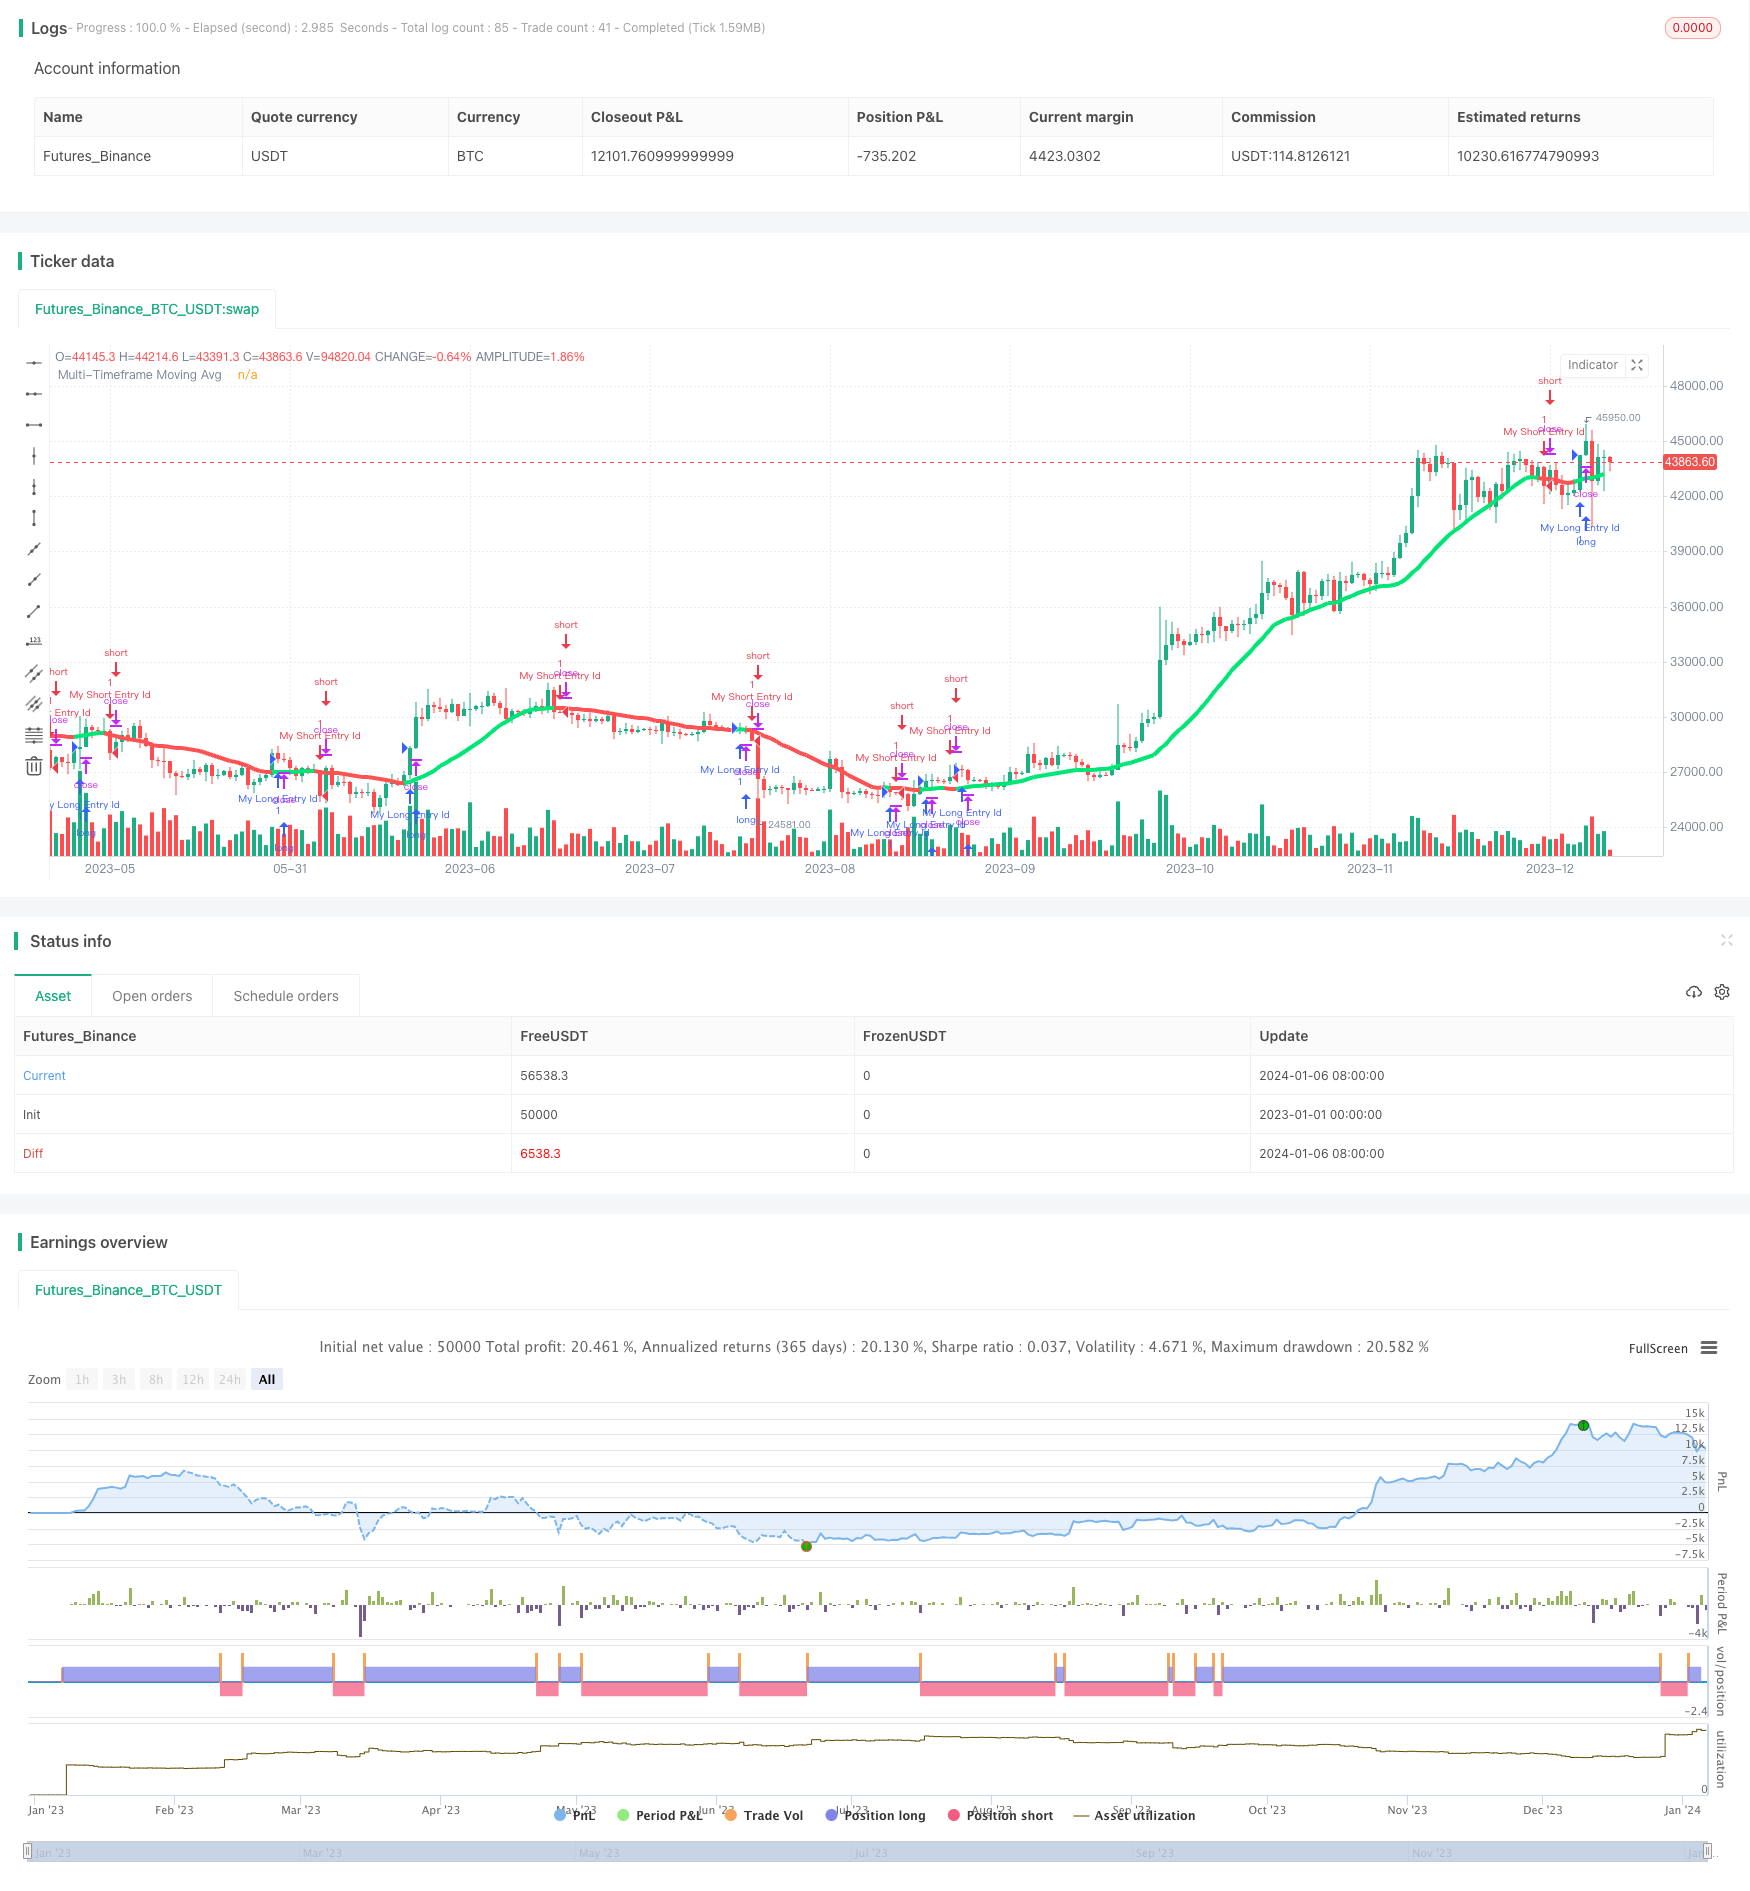
/*backtest
start: 2023-01-01 00:00:00
end: 2024-01-07 00:00:00
period: 1d
basePeriod: 1h
exchanges: [{"eid":"Futures_Binance","currency":"BTC_USDT"}]
*/

//@version=3
strategy("Moving averages-Strategy", overlay=true)
//Created by user ChrisMoody 4-24-2014
//Plots The Majority of Moving Averages
//Defaults to Current Chart Time Frame --- But Can Be Changed to Higher Or Lower Time Frames
//2nd MA Capability with Show Crosses Feature

//inputs
src = close
useCurrentRes = input(true, title="Use Current Chart Resolution?")
resCustom = input(title="Use Different Timeframe? Uncheck Box Above",defval="D")
len = input(20, title="Moving Average Length - LookBack Period")
atype = input(1,minval=1,maxval=7,title="1=SMA, 2=EMA, 3=WMA, 4=HullMA, 5=VWMA, 6=RMA, 7=TEMA")
cc = input(true,title="Change Color Based On Direction?")
smoothe = input(2, minval=1, maxval=10, title="Color Smoothing - 1 = No Smoothing")
doma2 = input(false, title="Optional 2nd Moving Average")
len2 = input(50, title="Moving Average Length - Optional 2nd MA")
atype2 = input(1,minval=1,maxval=7,title="1=SMA, 2=EMA, 3=WMA, 4=HullMA, 5=VWMA, 6=RMA, 7=TEMA")
cc2 = input(true,title="Change Color Based On Direction 2nd MA?")
warn = input(false, title="***You Can Turn On The Show Dots Parameter Below Without Plotting 2nd MA to See Crosses***")
warn2 = input(false, title="***If Using Cross Feature W/O Plotting 2ndMA - Make Sure 2ndMA Parameters are Set Correctly***")
sd = input(false, title="Show Dots on Cross of Both MA's")


res = useCurrentRes ? timeframe.period : resCustom
//hull ma definition
hullma = wma(2*wma(src, len/2)-wma(src, len), round(sqrt(len)))
//TEMA definition
ema1 = ema(src, len)
ema2 = ema(ema1, len)
ema3 = ema(ema2, len)
tema = 3 * (ema1 - ema2) + ema3

avg = atype == 1 ? sma(src,len) : atype == 2 ? ema(src,len) : atype == 3 ? wma(src,len) : atype == 4 ? hullma : atype == 5 ? vwma(src, len) : atype == 6 ? rma(src,len) : tema
//2nd Ma - hull ma definition
hullma2 = wma(2*wma(src, len2/2)-wma(src, len2), round(sqrt(len2)))
//2nd MA TEMA definition
sema1 = ema(src, len2)
sema2 = ema(sema1, len2)
sema3 = ema(sema2, len2)
stema = 3 * (sema1 - sema2) + sema3

avg2 = atype2 == 1 ? sma(src,len2) : atype2 == 2 ? ema(src,len2) : atype2 == 3 ? wma(src,len2) : atype2 == 4 ? hullma2 : atype2 == 5 ? vwma(src, len2) : atype2 == 6 ? rma(src,len2) : tema

out = avg
out_two = avg2

out1 = request.security(syminfo.tickerid, res, out)
out2 = request.security(syminfo.tickerid, res, out_two)

ma_up = out1 >= out1[smoothe]
ma_down = out1 < out1[smoothe]

col = cc ? ma_up ? lime : ma_down ? red : aqua : aqua
col2 = cc2 ? ma_up ? lime : ma_down ? red : aqua : aqua

circleYPosition = out2

plot(out1, title="Multi-Timeframe Moving Avg", style=line, linewidth=4, color = col)
plot(doma2 and out2 ? out2 : na, title="2nd Multi-TimeFrame Moving Average", style=circles, linewidth=4, color=col2)
plot(sd and cross(out1, out2) ? circleYPosition : na,style=cross, linewidth=5, color=yellow)


longCondition = crossover(out1, out1[smoothe])
if (longCondition)
    strategy.entry("My Long Entry Id", strategy.long)

shortCondition = crossunder(out1, out1[smoothe])
if (shortCondition)
    strategy.entry("My Short Entry Id", strategy.short)