Dynamische Trailing-Stop-Loss-Strategie
Überblick
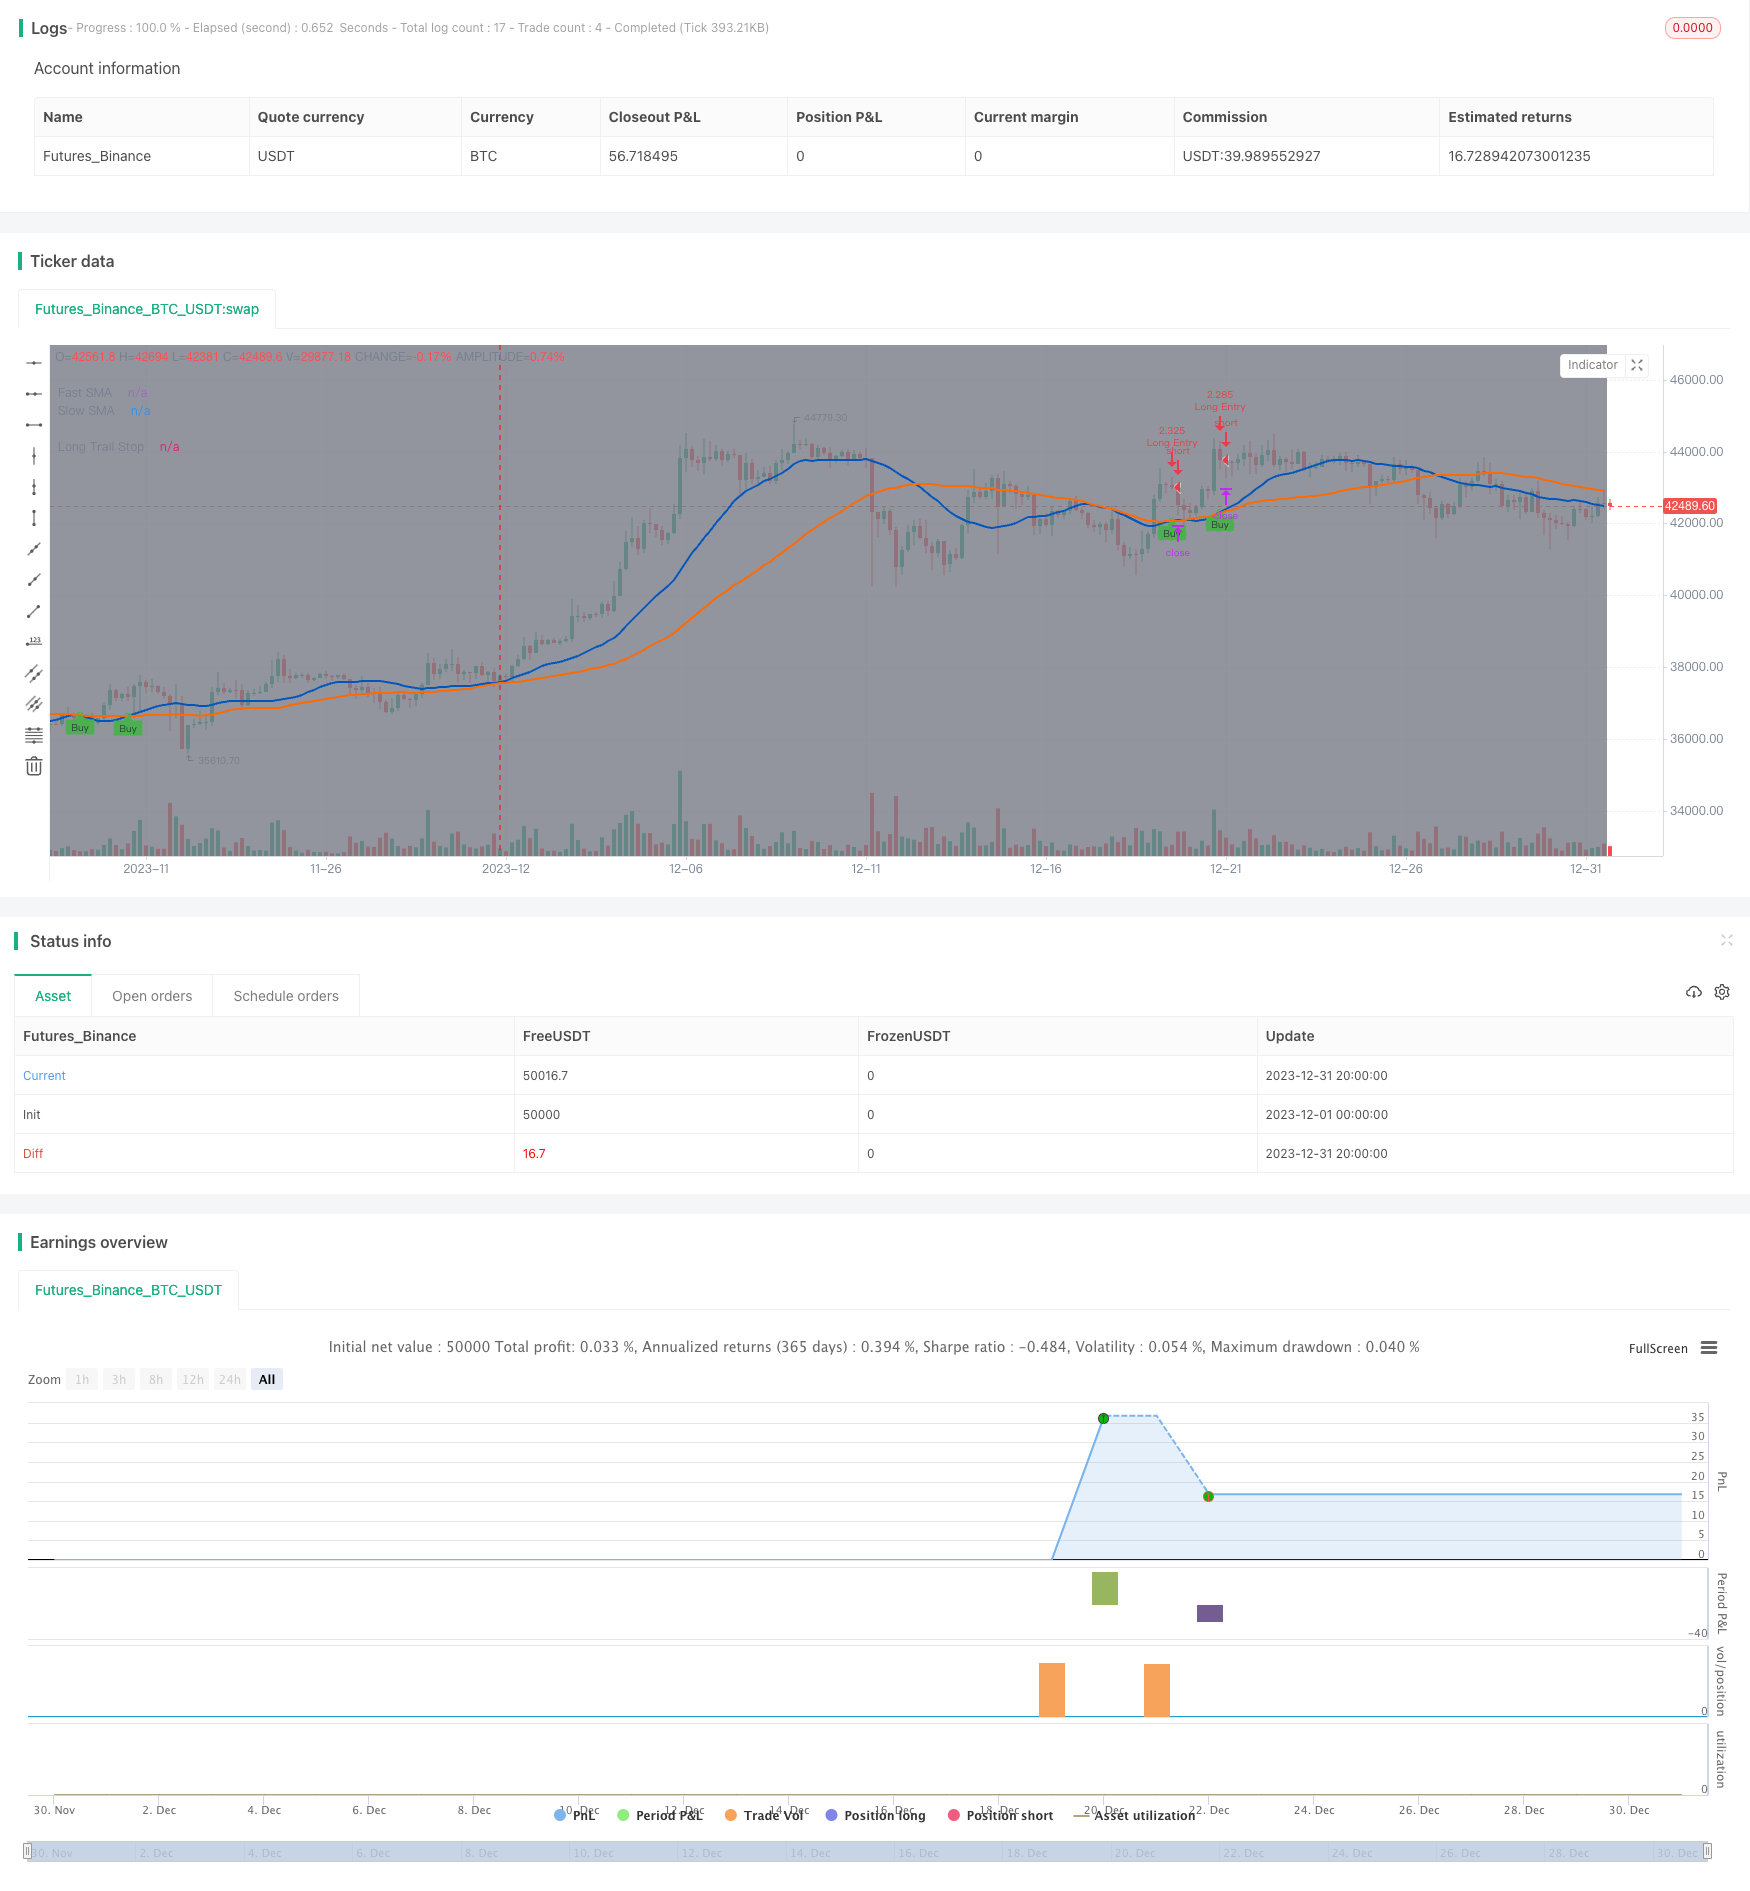
Diese Strategie beurteilt Trends durch die Berechnung einer Kreuzung zwischen einem schnellen und einem langsamen Moving Average, macht einen Plus bei der Durchquerung eines langsamen Moving Average auf einem schnellen Moving Average und setzt eine dynamisch verfolgte Stop-Loss-Linie ein, um Gewinne abzuschließen und bei einem bestimmten Prozentsatz der Preisänderung einen Stop-Loss-Ausgang vorzunehmen.
Strategieprinzip
Die Strategie verwendet eine Goldforke aus schnellen und langsamen Moving Averages, um den Beginn eines mehrköpfigen Trends zu bestimmen. Konkret handelt es sich um einen einfachen Moving Average, der den Schlusskurs innerhalb eines bestimmten Zeitraums berechnet und die Werte des schnellen Durchschnitts und des langsamen Durchschnitts vergleicht.
Die Strategie setzt keinen festen Stop-Loss, sondern nutzt eine Stop-Line, die dynamisch verfolgt wird, um die Gewinne zu sperren. Die Einstellung dieser Stop-Line ist:*Die Stop-Line kann mit steigenden Preisen erhöht werden und bei einem bestimmten Prozentsatz des Rückgangs kann der Stop-Loss ausgeschaltet werden.
Der Vorteil dieser Methode ist, dass sie unbegrenzt zurückgefordert werden kann und dass sie nach Erreichen eines bestimmten Niveaus durch einen Stop-Loss gesperrt werden kann.
Analyse der Stärken
Die wichtigsten Vorteile einer Stop-Loss-Strategie mit dynamischer Verfolgung sind:
Es gibt eine unbegrenzte Anzahl von Spielen, die nicht ausfallen können. Die Verwendung von Fixed Stop-Loss ist leicht, wenn der Verlust nach Beginn des Spiels eingestellt wird.
Ein Stop-Loss-Prozentsatz kann verwendet werden, um Gewinne zu sperren. Wenn nur die Verluste verfolgt werden, kann ein Verlust am Ende des gesamten Geschäfts möglich sein. Ein Stop-Loss-Satz kann den Gewinn sperren.
Es ist flexibler als ein fester Stop. Ein fester Stop kann nur auf einen Preis gesetzt werden, der sich nach dem höchsten Preis ändert.
Das Rücknahmerisiko ist geringer. Bei einem festen Stop-Loss ist der Stop-Loss-Preis weit von dem Höchstpreis entfernt und kann bei einer normalen Rücknahme eingestellt werden.
Risikoanalyse
Die Strategie birgt auch einige Risiken:
Die Indikatoren für das Eingangssignal sind instabil und können zu falschen Signalen führen.
Ein einziger Stop-Loss-Methode ohne Berücksichtigung anderer Faktoren.
Es gibt keine Stop-Loss-Begrenzung, die auf Stop-Loss angewiesen ist. Wenn die Stop-Loss-Begrenzung nicht wirksam ist, kann dies zu größeren Verlusten führen.
Die Datensätze müssen optimiert werden. Parameter wie die Moving-Average-Periode müssen optimiert werden.
Optimierungsrichtung
Die Strategie kann auch in folgenden Bereichen optimiert werden:
Es werden weitere Kennzahlen hinzugefügt, um die Zulassung zu bestätigen und falsche Signale zu vermeiden.
Erhöhung der Stop-Einstellungen. Stoppt, wenn ein bestimmter Prozentsatz erreicht ist.
Steigerung der Stop-Loss-Sicherheit. Große Anpassung der Stop-Loss-Distanz bei Marktausfällen.
Optimierte Anpassung der Handelsvarianten, der Handelszeiten usw. Die Parameter für verschiedene Handelsvarianten und Handelszeiten müssen angepasst werden.
Die Dynamik der Parameter wird mit Hilfe von maschinellem Lernen angepasst. So können die Modelle automatisch die Urteilsindikatoren und die Stop-Loss-Werte optimieren.
Zusammenfassen
Die Strategie hat eine klare Gesamtkonzeption. Die Verwendung von schnellen und mittleren Trendbeurteilungen ist eine eher klassische Methode und die Anwendung von dynamischen Stop-Loss-Methoden kann die Gewinne effektiv sperren und die Risiken senken. Diese Indikatoren und Parameter müssen jedoch ständig getestet und optimiert werden, um die Strategie stabil und profitabel zu machen.
/*backtest
start: 2023-12-01 00:00:00
end: 2023-12-31 23:59:59
period: 4h
basePeriod: 15m
exchanges: [{"eid":"Futures_Binance","currency":"BTC_USDT"}]
*/

//@version=4
//
// ▒▒▒▒▒▒▒▒▒▒▒▒▒▒▒▒▒▒▒▒▒▒▒▒▒▒▒▒▒▒▒▒▒▒▒▒▒▒▒▒▒▒▒▒▒▒▒▒▒▒▒▒▒▒▒▒▒▒▒▒▒▒▒▒▒▒▒▒▒▒▒▒▒▒▒▒▒▒▒▒▒▒▒▒▒▒▒▒▒▒▒▒▒▒▒▒▒▒▒▒▒▒▒▒▒▒▒▒▒▒▒▒▒▒
//  -----------------------------------------------------------------------------
//  Copyright 2021 Iason Nikolas | jason5480
//  Trainiling Take Profit Trailing Stop Loss script may be freely distributed under the MIT license.
//
//  Permission is hereby granted, free of charge,
//  to any person obtaining a copy of this software and associated documentation files (the "Software"),
//  to deal in the Software without restriction, including without limitation the rights to use, copy, modify, merge,
//  publish, distribute, sublicense, and/or sell copies of the Software, and to permit persons to whom the Software is furnished to do so,
//  subject to the following conditions:
//
//  The above copyright notice and this permission notice shall be included in all copies or substantial portions of the Software.
//
//  THE SOFTWARE IS PROVIDED "AS IS", WITHOUT WARRANTY OF ANY KIND,
//  EXPRESS OR IMPLIED, INCLUDING BUT NOT LIMITED TO THE WARRANTIES OF MERCHANTABILITY,
//  FITNESS FOR A PARTICULAR PURPOSE AND NONINFRINGEMENT. IN NO EVENT SHALL THE AUTHORS OR COPYRIGHT HOLDERS BE LIABLE FOR ANY CLAIM,
//  DAMAGES OR OTHER LIABILITY, WHETHER IN AN ACTION OF CONTRACT, TORT OR OTHERWISE, ARISING FROM,
//  OUT OF OR IN CONNECTION WITH THE SOFTWARE OR THE USE OR OTHER DEALINGS IN THE SOFTWARE.
//
//  -----------------------------------------------------------------------------
//
//  Authors:  @jason5480
//  Revision: v1.0.0
//  Date:     05-May-2021
//
//  Description
//  =============================================================================
//  This strategy will go long if fast MA crosses over slow MA.
//  The strategy will exit from long position when the price increases by a fixed percentage.
//  If the trailing take profit is checked then the strategy instead of setting a limit order in a predefined price (based on the percentage)
//  it will follow the price with small steps (percentagewise)
//  If the price drops by this percentage then the exit order will be executed
//
//  The strategy has the following parameters:
//
//  Fast SMA Length - How many candles back to calculte the fast SMA.
//  Slow SMA Length - How many candles back to calculte the slow SMA.
//  Enable Trailing - Enable or disable the trailing.
//  Stop Loss % - The percentage of the price decrease to set the stop loss price target for long positions.
//
//  -----------------------------------------------------------------------------
//  Disclaimer:
//    1. I am not licensed financial advisors or broker dealer. I do not tell you
//       when or what to buy or sell. I developed this software which enables you
//       execute manual or automated trades using TradingView. The
//       software allows you to set the criteria you want for entering and exiting
//       trades.
//    2. Do not trade with money you cannot afford to lose.
//    3. I do not guarantee consistent profits or that anyone can make money with no
//       effort. And I am not selling the holy grail.
//    4. Every system can have winning and losing streaks.
//    5. Money management plays a large role in the results of your trading. For
//       example: lot size, account size, broker leverage, and broker margin call
//       rules all have an effect on results. Also, your Take Profit and Stop Loss
//       settings for individual pair trades and for overall account equity have a
//       major impact on results. If you are new to trading and do not understand
//       these items, then I recommend you seek education materials to further your
//       knowledge.
//
//    YOU NEED TO FIND AND USE THE TRADING SYSTEM THAT WORKS BEST FOR YOU AND YOUR
//    TRADING TOLERANCE.
//
//    I HAVE PROVIDED NOTHING MORE THAN A TOOL WITH OPTIONS FOR YOU TO TRADE WITH THIS PROGRAM ON TRADINGVIEW.
//
//    I accept suggestions to improve the script.
//    If you encounter any problems I will be happy to share with me.
//  -----------------------------------------------------------------------------
//
// ▒▒▒▒▒▒▒▒▒▒▒▒▒▒▒▒▒▒▒▒▒▒▒▒▒▒▒▒▒▒▒▒▒▒▒▒▒▒▒▒▒▒▒▒▒▒▒▒▒▒▒▒▒▒▒▒▒▒▒▒▒▒▒▒▒▒▒▒▒▒▒▒▒▒▒▒▒▒▒▒▒▒▒▒▒▒▒▒▒▒▒▒▒▒▒▒▒▒▒▒▒▒▒▒▒▒▒▒▒▒▒▒▒▒
// SETUP ============================================================================================================
strategy(title = "Trailing Stop Loss",
         shorttitle = "TSL",
         overlay = true,
         pyramiding = 0,
         calc_on_every_tick = true,
         default_qty_type = strategy.cash,
         default_qty_value = 100000,
         initial_capital = 100000)

//
// ▒▒▒▒▒▒▒▒▒▒▒▒▒▒▒▒▒▒▒▒▒▒▒▒▒▒▒▒▒▒▒▒▒▒▒▒▒▒▒▒▒▒▒▒▒▒▒▒▒▒▒▒▒▒▒▒▒▒▒▒▒▒▒▒▒▒▒▒▒▒▒▒▒▒▒▒▒▒▒▒▒▒▒▒▒▒▒▒▒▒▒▒▒▒▒▒▒▒▒▒▒▒▒▒▒▒▒▒▒▒▒▒▒▒
// INPUTS ===========================================================================================================

// STRATEGY INPUT ===================================================================================================
fastMALen = input(defval = 21, title = "Fast SMA Length", type = input.integer, group = "Strategy", tooltip = "How many candles back to calculte the fast SMA.")
slowMALen = input(defval = 49, title = "Slow SMA Length", type = input.integer, group = "Strategy", tooltip = "How many candles back to calculte the slow SMA.")

enableStopLossTrailing = input(defval = true, title = "Enable Trailing", type = input.bool, group = "Strategy", tooltip = "Enable or disable the trailing for stop loss.")
longTrailingStopLossPerc = input(defval = 7.5, title = 'Long Stop Loss %', type = input.float, minval = 0.1, maxval = 100, step = 0.1, inline = "Trailing Stop Loss Perc", group = "Strategy") / 100

// BACKTEST PERIOD INPUT ============================================================================================
fromDate = input(defval = timestamp("01 Jan 2021 00:00 UTC"), title = "From Date", type = input.time, minval = timestamp("01 Jan 1970 00:00 UTC"), group = "Backtest Period") // backtest start date
toDate   = input(defval = timestamp("31 Dec 2121 23:59 UTC"), title = "To Date",   type = input.time, minval = timestamp("01 Jan 1970 00:00 UTC"), group = "Backtest Period") // backtest finish date

isWithinBacktestPeriod() => true

// SHOW PLOT INPUT ==================================================================================================
showDate = input(defval = true, title = "Show Backtest Range", type = input.bool, group = "Plot", tooltip = "Gray out the backround of the backtest period.")

//
// ▒▒▒▒▒▒▒▒▒▒▒▒▒▒▒▒▒▒▒▒▒▒▒▒▒▒▒▒▒▒▒▒▒▒▒▒▒▒▒▒▒▒▒▒▒▒▒▒▒▒▒▒▒▒▒▒▒▒▒▒▒▒▒▒▒▒▒▒▒▒▒▒▒▒▒▒▒▒▒▒▒▒▒▒▒▒▒▒▒▒▒▒▒▒▒▒▒▒▒▒▒▒▒▒▒▒▒▒▒▒▒▒▒▒
// STRATEGY LOGIC ===================================================================================================

fastMA = sma(close, fastMALen)
slowMA = sma(close, slowMALen)

bool startLongDeal = crossover(fastMA, slowMA)

bool longIsActive = startLongDeal or strategy.position_size > 0

// determine trailing stop loss price
float longTrailingStopLossPrice = na
longTrailingStopLossPrice := if (longIsActive)
    stopValue = high * (1 - longTrailingStopLossPerc)
    max(stopValue, nz(longTrailingStopLossPrice[1]))
else
    na

//
// ▒▒▒▒▒▒▒▒▒▒▒▒▒▒▒▒▒▒▒▒▒▒▒▒▒▒▒▒▒▒▒▒▒▒▒▒▒▒▒▒▒▒▒▒▒▒▒▒▒▒▒▒▒▒▒▒▒▒▒▒▒▒▒▒▒▒▒▒▒▒▒▒▒▒▒▒▒▒▒▒▒▒▒▒▒▒▒▒▒▒▒▒▒▒▒▒▒▒▒▒▒▒▒▒▒▒▒▒▒▒▒▒▒▒
// STRATEGY EXECUTION ===============================================================================================

if (isWithinBacktestPeriod())
    // getting into LONG position
    strategy.entry(id = "Long Entry", long = strategy.long, when = startLongDeal, alert_message = "Long(" + syminfo.ticker + "): Started")
    // submit exit orders for trailing stop loss price
    strategy.exit(id = "Long Stop Loss", from_entry = "Long Entry", stop = longTrailingStopLossPrice, when = longIsActive, alert_message = "Long(" + syminfo.ticker + "): Stop Loss activated")


//
// ▒▒▒▒▒▒▒▒▒▒▒▒▒▒▒▒▒▒▒▒▒▒▒▒▒▒▒▒▒▒▒▒▒▒▒▒▒▒▒▒▒▒▒▒▒▒▒▒▒▒▒▒▒▒▒▒▒▒▒▒▒▒▒▒▒▒▒▒▒▒▒▒▒▒▒▒▒▒▒▒▒▒▒▒▒▒▒▒▒▒▒▒▒▒▒▒▒▒▒▒▒▒▒▒▒▒▒▒▒▒▒▒▒▒
// PLOT DATE POSITION MA AND TRAILING TAKE PROFIT STOP LOSS =========================================================

bgcolor(color = showDate and isWithinBacktestPeriod() ? color.gray : na, transp = 90)

plot(series = fastMA, title = "Fast SMA", color = #0056BD, linewidth = 2, style = plot.style_line)
plot(series = slowMA, title = "Slow SMA", color = #FF6A00, linewidth = 2, style = plot.style_line)
plotshape(series = isWithinBacktestPeriod() and startLongDeal and strategy.position_size <= 0 ? fastMA : na, title = "UpTrend Begins", style = shape.circle, location = location.absolute, color = color.green, transp = 0, size = size.tiny)
plotshape(series = isWithinBacktestPeriod() and startLongDeal and strategy.position_size <= 0 ? fastMA : na, title = "Buy", text = "Buy", style = shape.labelup, location = location.absolute, color = color.green, textcolor = color.black, transp = 0, size = size.tiny)

plot(series = strategy.position_avg_price, title = "Position", color = color.blue, linewidth = 2, style = plot.style_linebr, offset = 1)
plot(series = longTrailingStopLossPrice, title = "Long Trail Stop", color = color.fuchsia, linewidth = 2, style = plot.style_linebr, offset = 1)

// ==================================================================================================================