Solide Trendfolgestrategie
Überblick
Die Hauptidee dieser Strategie ist die Kombination von 123 Reverse-Formen und dem Smart Money-Flow-Index (SMI), um einen stabilen Trend-Tracking-Handel zu erreichen. Die Strategie erstellt eine entsprechende Mehrkopf- oder Leerkopf-Position, wenn zwei Signale gleichzeitig ein Kauf- oder Verkaufssignal senden.
Strategieprinzip
Die Strategie besteht aus zwei Teilen:
123 Umkehrstrategie: Die Strategie basiert auf dem Schlusskurs der Aktie und dem 9-Tage-Stoch-Index, um einen Umkehrhandel zu erzielen. Insbesondere, wenn die Schlusskursbeziehung zwei Tage in Folge umgekehrt ist (d. h. der Schlusskurs des Vortages ist höher als der der Vortags und der Schlusskurs des folgenden Tages ist niedriger als der des Vortags), und die Schnelllinie des Stochs ist höher als die Schnelllinie des Vortags, machen Sie eine Lücke; wenn die Schlusskursbeziehung zwei Tage in Folge umgekehrt ist (d. h. der Schlusskurs des Vortags ist niedriger als der der Vortags und der Schlusskurs des folgenden Tages ist höher als der des Vortags), und die Schnelllinie des Stochs ist niedriger als die Schnelllinie des Vortags, machen Sie mehr.
SMI-Strategie: Die Strategie basiert auf dem intelligenten Cashflow-Index, um Trends zu verfolgen. Der SMI-Indikator kann das Spiel zwischen institutionellem Kapital und Retail-Fonds widerspiegeln. Ein Anstieg des SMI signalisiert, dass das Geld der Institution aufgenommen wird, was im Gegensatz dazu signalisiert, dass das Geld der Institution verkauft wird.
Die Strategie nimmt eine Mehrkopfposition ein, wenn die 123 Umkehrform und der SMI-Index gleichzeitig ein Kaufsignal senden. Die Strategie nimmt eine Leerkopfposition ein, wenn beide gleichzeitig ein Verkaufssignal senden.
Strategische Vorteile
Die Strategie kombiniert Umkehrmuster und Trend-Tracking-Indikatoren, um effektiv zu identifizieren, Markt-Umkehrpunkte und Trend-Tracking, um stabile Gewinne. Die konkreten Vorteile sind:
123 Umkehrformen haben eine hohe Gewinn- und Verlustrate und können kurzfristige Umkehrmöglichkeiten effektiv erkennen.
Der SMI-Indikator spiegelt den Kapitalfluss der Einrichtung wider und verfolgt die Stabilität der Erträge, die die Einrichtung mit ihrem Kapital erzielt.
In Kombination mit der Verwendung von Umkehrformeln und Trend-Tracking-Indikatoren kann die Signalqualität verbessert, unnötige Transaktionen reduziert und das Risiko effektiv kontrolliert werden.
Strategisches Risiko
Die Strategie birgt auch Risiken, die sich auf folgende Bereiche konzentrieren:
123 Bei der Umkehrform besteht ein gewisses Risiko für falsche Signale, und es ist nicht möglich, einen verlustreichen Handel vollständig zu vermeiden.
Die SMI-Indikatoren haben eine gewisse Verzögerung und können nicht vollständig den Geldfluss in Echtzeit widerspiegeln. Sie können in Verbindung mit anderen Indikatoren überprüft werden, um die Genauigkeit zu verbessern.
Bei doppelten Signalen gibt es die Problematik, dass sie zu konservativ sind und eine stärkere einseitige Tendenz verpassen. Sie können die Signalbedingungen entsprechend lockern und die Filterstandards senken.
Optimierungsrichtung
Die Strategie kann in folgenden Bereichen weiter optimiert werden:
Optimierung von Parametern, Suche nach der optimalen Kombination von Parametern, Steigerung der Profitabilität der Strategie.
Die Einführung von Stop-Loss-Mechanismen zur wirksamen Kontrolle von Einzelschäden.
In Kombination mit anderen Indikatoren oder Formen zur weiteren Verifizierung der Signalqualität und zur Verbesserung der Signalgenauigkeit.
Optimierung der Parameter für verschiedene Sorten und Verbesserung der Anpassungsfähigkeit der Strategie.
Zusammenfassen
Die Strategie hat eine klare Gesamtkonzeption, die in Kombination mit Umkehrformen und Trend-Tracking-Indikatoren eine stabile Identifizierung von kurzfristigen Umkehrmöglichkeiten und die Verfolgung von mittleren und langfristigen Trends ermöglicht. Durch die Optimierung der Parameter und die Verbesserung der Mechanismus-Design können die Profitabilität und die Risikokontrolle der Strategie weiter verbessert werden.
Overview
The main idea of this strategy is to combine the 123 reversal pattern and the Smart Money Index (SMI) indicator to achieve stable trend tracking trading. The strategy will only establish corresponding long or short positions when both signals issue buy or sell signals at the same time.
Strategy Principle
The strategy consists of two parts:
123 reversal strategy: This strategy implements reversal trading based on the closing price of the stock and the 9-day Stoch indicator. Specifically, go short when the closing price relationship reverses for two consecutive days (i.e. the previous closing price is higher than the one before the previous day, and the next closing price is lower than the previous day), and Stoch fast line is above slow line; go long when the closing price relationship reverses for two consecutive days (i.e. the previous closing price is lower than the one before the previous day, and the next closing price is higher than the previous day), and Stoch fast line is below slow line.
SMI strategy: This strategy implements trend tracking based on the Smart Money Index. The SMI indicator can reflect the game between institutional funds and retail funds. The rise of SMI indicates that institutional funds are absorbing funds, while the fall indicates that institutional funds are selling out. Go long when SMI rises and go short when SMI falls.
The strategy will only take a long position when both the 123 reversal pattern and the SMI indicator issue a buy signal at the same time. It will only take a short position when both issue a sell signal at the same time.
Strategy Advantages
The strategy combines reversal patterns and trend tracking indicators to effectively identify market reversal points and track trends for steady profits. The specific advantages are as follows:
The 123 reversal pattern has a relatively high win rate and profit rate, which can effectively identify short-term reversal opportunities.
The SMI indicator can reflect the direction of institutional funds. Tracking institutional funds can obtain more steady profits.
The combined use of reversal patterns and trend tracking indicators can improve the quality of signals, reduce unnecessary trading, and effectively control risks.
Strategy Risks
The strategy also has some risks, mainly concentrated in the following areas:
The 123 reversal pattern has a certain risk of false signals and cannot completely avoid losing trades. Parameters can be optimized appropriately to improve signal quality.
The SMI indicator has a certain lag and cannot completely reflect the direction of funds in real time. Other indicators can be combined for verification to improve accuracy.
Double signals can lead to over-conservative problems, possibly missing stronger one-sided trending opportunities. Signal conditions can be appropriately relaxed to reduce filtering criteria.
Optimization Directions
The strategy can also be further optimized in the following aspects:
Optimize parameters to find the optimal parameter combination and improve the profitability of the strategy.
Add stop loss mechanisms to effectively control single loss.
Combine other indicators or patterns to further verify signal quality and improve signal accuracy.
Optimize parameters separately for different varieties to improve the adaptability of the strategy.
Summary
The overall idea of the strategy is clear, effectively combining reversal patterns and trend tracking indicators to steadily identify short-term reversal opportunities and track medium-to-long term trends. By improving parameters optimization and mechanism design, the profitability and risk control capabilities of the strategy can be further enhanced.
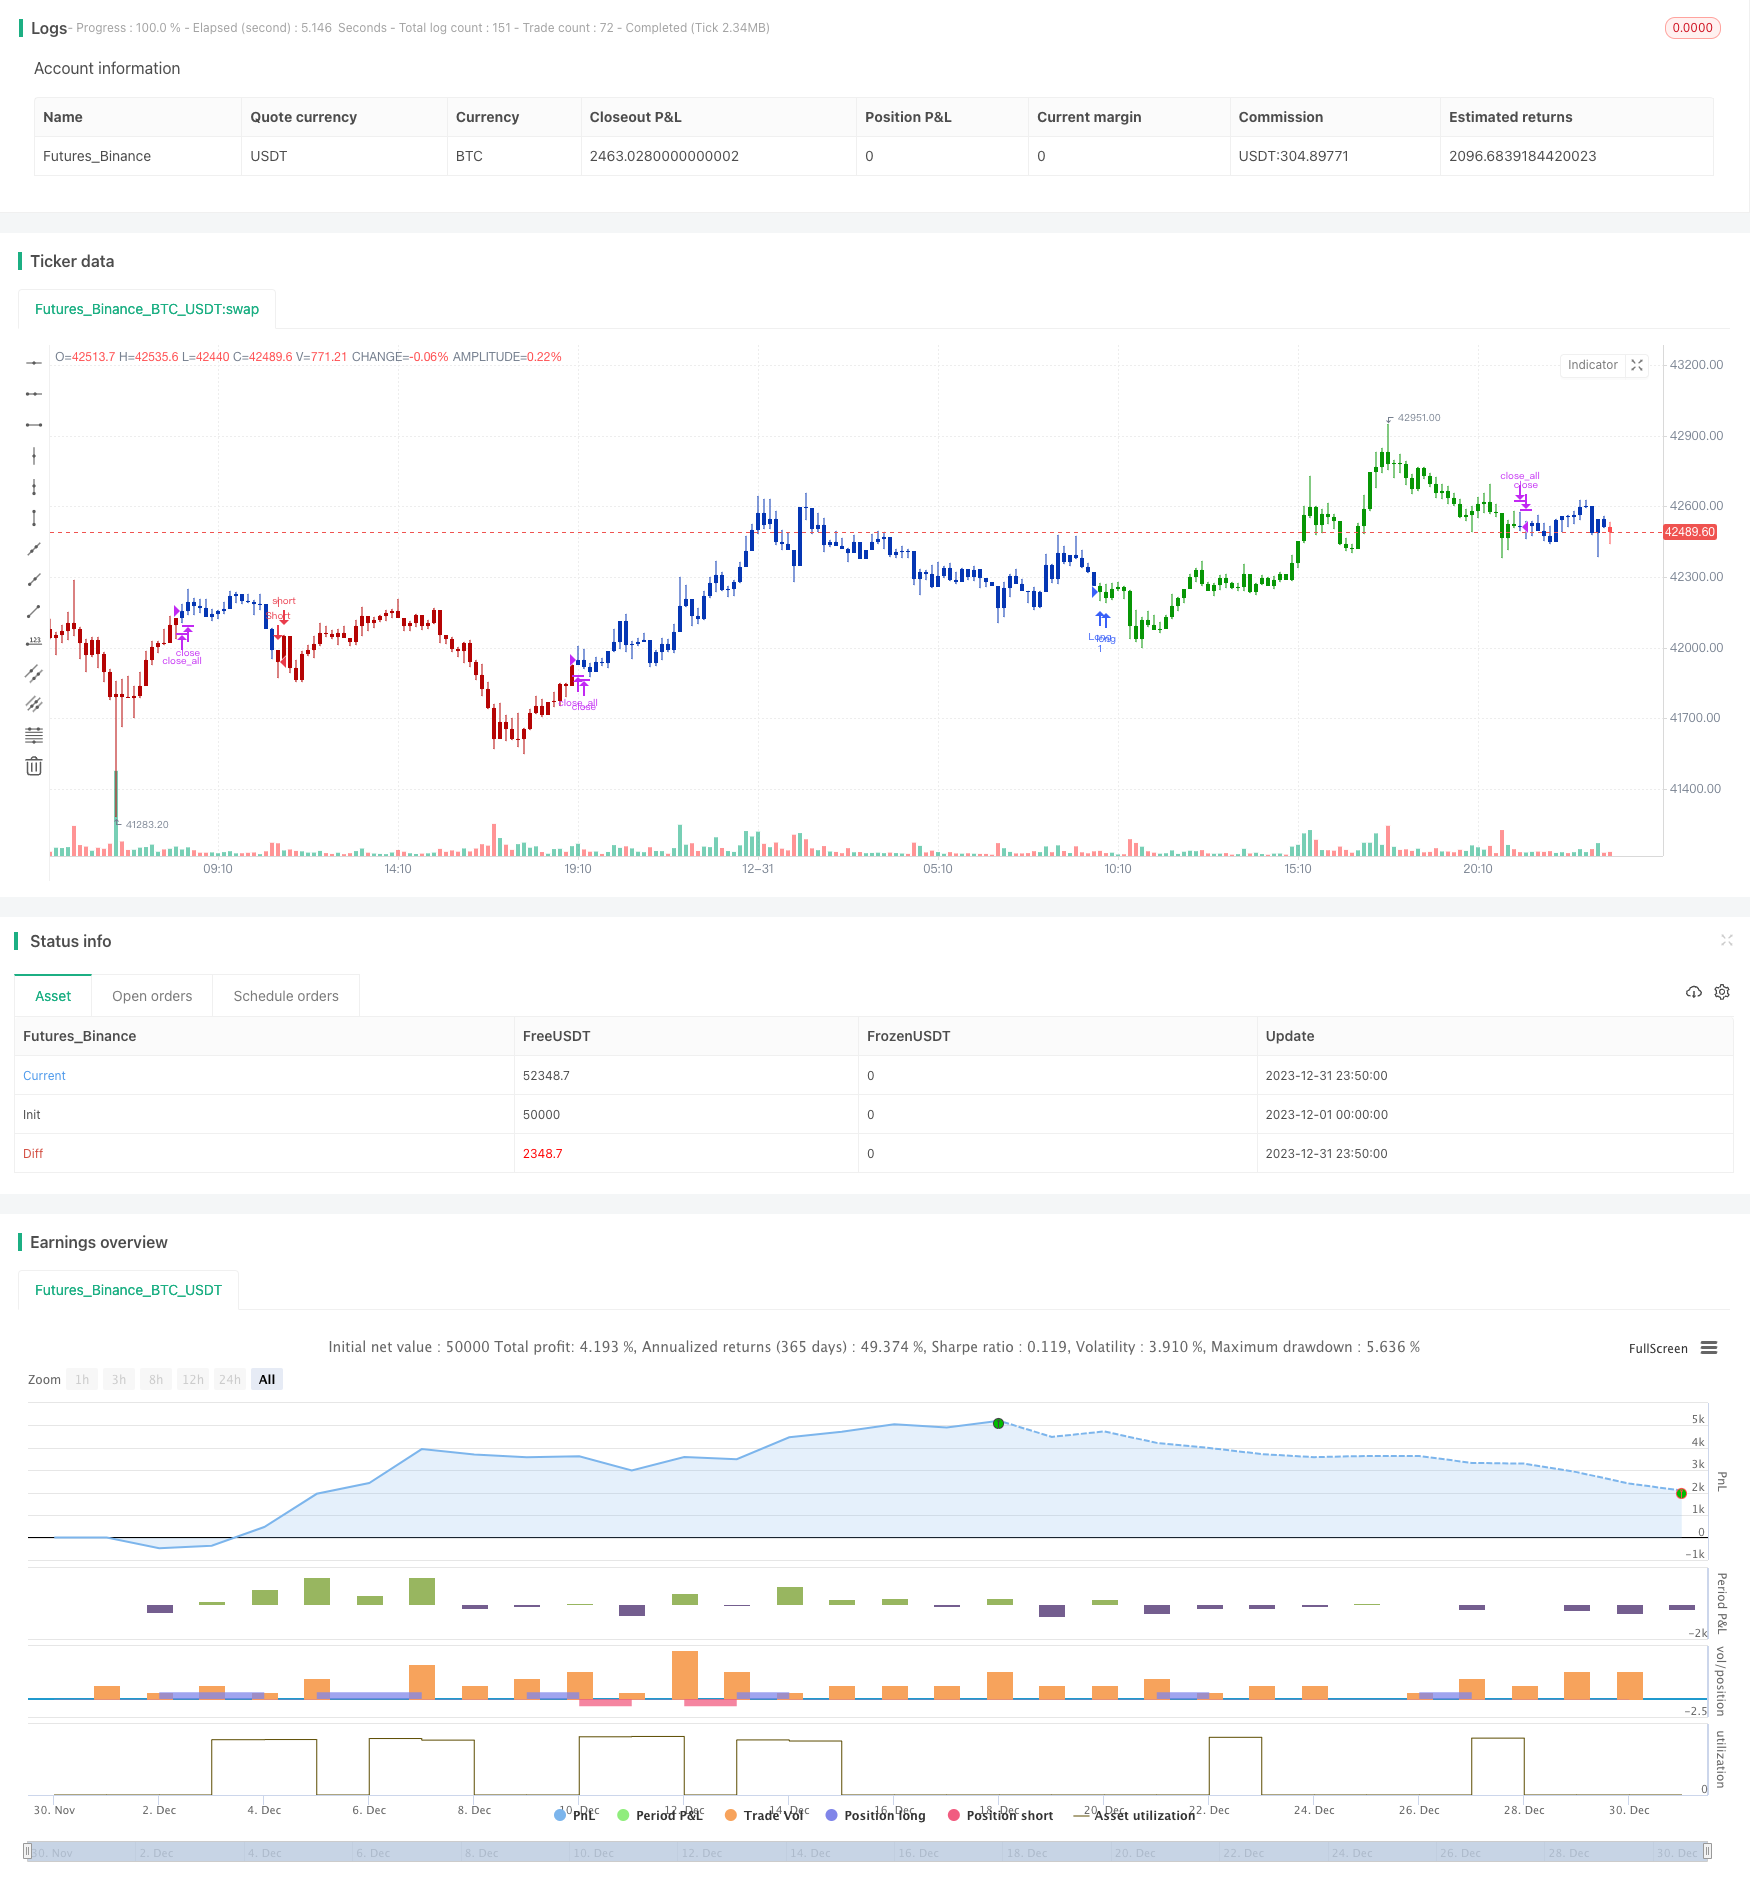
/*backtest
start: 2023-12-01 00:00:00
end: 2023-12-31 23:59:59
period: 10m
basePeriod: 1m
exchanges: [{"eid":"Futures_Binance","currency":"BTC_USDT"}]
*/

//@version=4
////////////////////////////////////////////////////////////
//  Copyright by HPotter v1.0 10/07/2021
// This is combo strategies for get a cumulative signal.
//
// First strategy
// This System was created from the Book "How I Tripled My Money In The
// Futures Market" by Ulf Jensen, Page 183. This is reverse type of strategies.
// The strategy buys at market, if close price is higher than the previous close
// during 2 days and the meaning of 9-days Stochastic Slow Oscillator is lower than 50.
// The strategy sells at market, if close price is lower than the previous close price
// during 2 days and the meaning of 9-days Stochastic Fast Oscillator is higher than 50.
//
// Second strategy
// Smart money index (SMI) or smart money flow index is a technical analysis indicator demonstrating investors sentiment.
// The index was invented and popularized by money manager Don Hays.[1] The indicator is based on intra-day price patterns.
// The main idea is that the majority of traders (emotional, news-driven) overreact at the beginning of the trading day
// because of the overnight news and economic data. There is also a lot of buying on market orders and short covering at the opening.
// Smart, experienced investors start trading closer to the end of the day having the opportunity to evaluate market performance.
// Therefore, the basic strategy is to bet against the morning price trend and bet with the evening price trend. The SMI may be calculated
// for many markets and market indices (S&P 500, DJIA, etc.)
//
// The SMI sends no clear signal whether the market is bullish or bearish. There are also no fixed absolute or relative readings signaling
// about the trend. Traders need to look at the SMI dynamics relative to that of the market. If, for example, SMI rises sharply when the
// market falls, this fact would mean that smart money is buying, and the market is to revert to an uptrend soon. The opposite situation
// is also true. A rapidly falling SMI during a bullish market means that smart money is selling and that market is to revert to a downtrend
// soon. The SMI is, therefore, a trend-based indicator.
// Some analysts use the smart money index to claim that precious metals such as gold will continually maintain value in the future.
//
// WARNING:
// - For purpose educate only
// - This script to change bars colors.
////////////////////////////////////////////////////////////
Reversal123(Length, KSmoothing, DLength, Level) =>
    vFast = sma(stoch(close, high, low, Length), KSmoothing)
    vSlow = sma(vFast, DLength)
    pos = 0.0
    pos := iff(close[2] < close[1] and close > close[1] and vFast < vSlow and vFast > Level, 1,
	         iff(close[2] > close[1] and close < close[1] and vFast > vSlow and vFast < Level, -1, nz(pos[1], 0)))
	pos


SMI(Length, tf) =>
    pos = 0.0
    nRes = 0.0
    xcloseH1 = security(syminfo.tickerid, tf, close[1])
    xopenH1 =  security(syminfo.tickerid, tf, open[1])
    nRes := nz(nRes[1], 1) - (open - close) + (xopenH1 - xcloseH1)
    xSmaRes = sma(nRes, Length)
    pos:= iff(xSmaRes > nRes, 1,
           iff(xSmaRes < nRes, -1, nz(pos[1], 0)))
    pos

strategy(title="Combo Backtest 123 Reversal & Smart Money Index (SMI)", shorttitle="Combo", overlay = true)
line1 = input(true, "---- 123 Reversal ----")
Length = input(14, minval=1)
KSmoothing = input(1, minval=1)
DLength = input(3, minval=1)
Level = input(50, minval=1)
//-------------------------
line2 = input(true, "---- Smart Money Index (SMI) ----")
LengthSMI = input(18, minval=1)
res = input(title="Resolution", type=input.resolution, defval="D")
reverse = input(false, title="Trade reverse")
posReversal123 = Reversal123(Length, KSmoothing, DLength, Level)
posSMI = SMI(LengthSMI, res)
pos = iff(posReversal123 == 1 and posSMI == 1 , 1,
	   iff(posReversal123 == -1 and posSMI == -1, -1, 0))
possig = iff(reverse and pos == 1, -1,
          iff(reverse and pos == -1 , 1, pos))
if (possig == 1 )
    strategy.entry("Long", strategy.long)
if (possig == -1 )
    strategy.entry("Short", strategy.short)
if (possig == 0)
    strategy.close_all()
barcolor(possig == -1 ? #b50404: possig == 1 ? #079605 : #0536b3 )