Gleitende Durchschnittstrendfolgestrategie basierend auf SSL
Überblick
Die Strategie ist eine Strategie, bei der die Markttrends anhand von SSL-Kanalindikatoren beurteilt und die Trends auf der mittleren und langen 4-Stunden- und Tageslinie als Basis verwendet werden.
Strategieprinzip
Der SSL-Kanal besteht aus der Kelter-Mittellinie und der realen Amplitude. Es kann die Richtung der Markttrend bestimmen. Wenn der Preis übertragen wird, ist es ein bullish Signal, wenn er übertragen wird, ist es ein bearish Signal.
Die Strategie berechnet eine Referenz-Mittellinie aus EMA-Gleichgewichtsindikatoren. Diese Gleichgewichtslinie kann einige falsche Durchbrüche filtern.
Die Strategie macht mehr, wenn der Preis die SSL-Oberbahnlinie durchbricht, und macht eine Lücke, wenn der Preis die SSL-Unterbahnlinie durchbricht.
Die Stop-Loss-Methode beinhaltet den Prozentsatz des Stop-Losses, den ATR-Stop und die Rückschau auf den Minimal-/Hochstopp. Der Stop-Loss ist das N-fache des Stop-Losses. Die Parameter werden vom Benutzer festgelegt.
Analyse der Stärken
Der SSL-Kanal beurteilt die Trendrichtung genau und reduziert die Falschsignale. Die Zusammenarbeit mit der Gleichschleife dient als Grundlage für die Markteinführung und verhindert die Rückführung.
Es gibt eine flexible Auswahl an verschiedenen Arten von Mittellinien, die sich an eine breitere Palette von Marktbedingungen anpassen.
Die Stop-Loss-Methoden sind flexibel und die Risiken sind kontrollierbar. Die Stop-Loss-Modalitäten können auch flexibel eingestellt werden, um unterschiedliche Vorlieben zu erfüllen.
Es gibt viele Möglichkeiten, die sich aus dem Markt ergeben, indem man gleichzeitig mehr Leerlauf macht.
Risikoanalyse
Die mittleren Indikatoren sind nachlässig und es kann zu einer Verlustakkumulation kommen.
In der Schwingung gibt es eine Umkehrung, wenn man die Bahn auf- und abreißt.
ATR und Rückblick-Stopps können bei außergewöhnlichen Durchbrüchen zu locker sein und die Verluste ausweiten.
Risikomanagement:
- Richten Sie die Parameter der Mittellinie entsprechend an oder wählen Sie andere Typen von Mittellinien.
- Das ist eine sehr gute Idee, um die Verluste zu erhöhen.
- Hinzufügen von Multiplikatoren in den ATR oder Anpassung der Rückblickphase.
Optimierungsrichtung
- Versuchen Sie, mehr Arten von Mittellinien zu testen, um die besten Parameter zu finden.
- Optimierung der ATR-Periodenparameter für die Stop-Loss.
- Verschiedene Stop-Loss-Multiplikator-Parameter werden getestet.
- Verschiedene Risikofaktoren für die Entzündung werden getestet.
Zusammenfassen
Die Strategie kombiniert die Verwendung von SSL-Trendbeurteilungen und Gleichgewichtsindikatoren zur Markterkennung und ermöglicht eine effiziente Trendbeobachtung. Sie bietet eine flexible Stop-Loss- und Stop-Stop-Methode, um höhere Gewinne zu erzielen, während das Risiko kontrolliert wird. Durch ständige Prüfung und Optimierung der Parameter können bessere Handelsperformance erzielt werden.
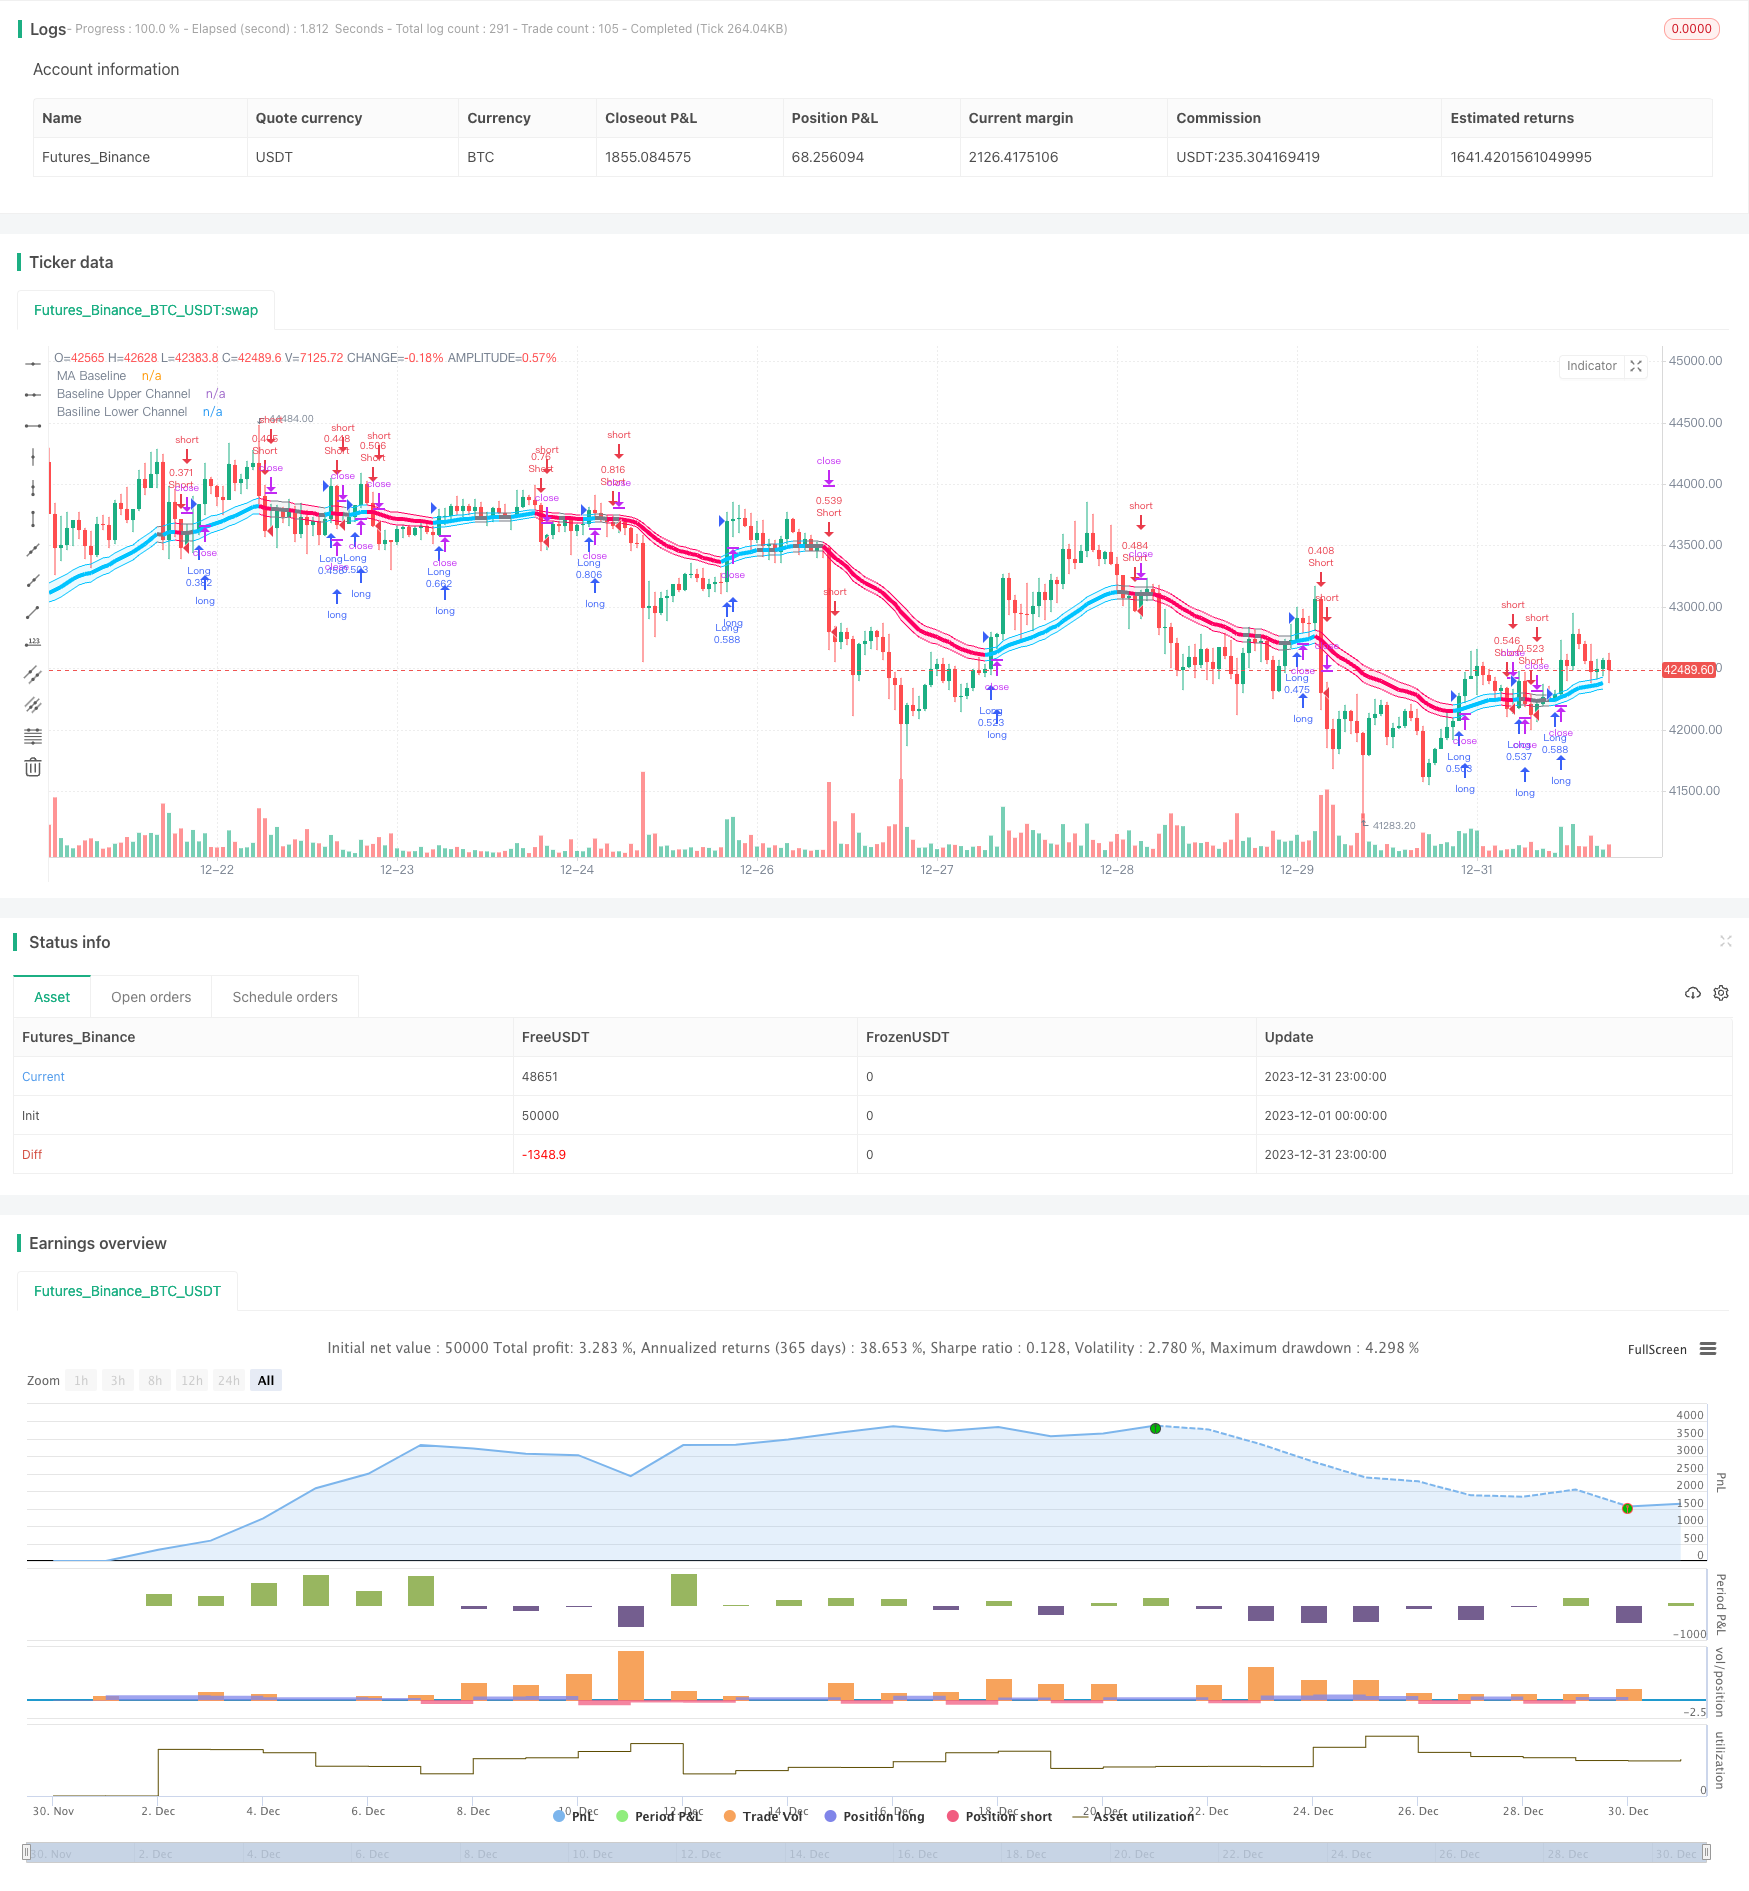
/*backtest
start: 2023-12-01 00:00:00
end: 2023-12-31 23:59:59
period: 1h
basePeriod: 15m
exchanges: [{"eid":"Futures_Binance","currency":"BTC_USDT"}]
*/

// This source code is subject to the terms of the Mozilla Public License 2.0 at https://mozilla.org/MPL/2.0/
// Thanks to @kevinmck100 for opensource strategy template and @Mihkel00 for SSL Hybrid
// @fpemehd
// @version=5
strategy(title = '[fpemehd] SSL Baseline Strategy',
      shorttitle = '[f] SSL',
      overlay = true)

// # ========================================================================= #
// #                                Inputs
// # ========================================================================= #

// 1. Time
i_start                 = input (defval = timestamp("20 Jan 1990 00:00 +0900"), title = "Start Date", tooltip = "Choose Backtest Start Date", inline = "Start Date", group = "Time" )
i_end                   = input (defval = timestamp("20 Dec 2030 00:00 +0900"), title = "End Date", tooltip = "Choose Backtest End Date", inline = "End Date", group = "Time" )
inDateRange             = true


// 2. Inputs for direction: Long? Short? Both?
// i_longEnabled           = input.bool(defval = true , title = "Long?", tooltip = "Enable Long Position Trade?", inline = "1", group = "Long / Short" )
// i_shortEnabled          = input.bool(defval = true , title = "Short?", tooltip = "Enable Short Position Trade?", inline = "1", group = "Long / Short" )

// 3. Shared inputs for Long and Short
//// 3-1. Inputs for Stop Loss Type: ATR or Percent?
i_slType                = input.string (defval = "ATR", title = "SL Type ", group = "Strategy: Stop Loss Conditions", options = ["Percent", "ATR", "Previous LL / HH"], tooltip = "Stop Loss based on %? ATR?", inline = "1")
i_slPercent             = input.float (defval = 3, title = "SL % ",             group = "Strategy: Stop Loss Conditions", inline = "2")
i_slAtrLength           = input.int (14, "SL ATR Length ",                      group = "Strategy: Stop Loss Conditions", inline = "3", minval = 0, maxval = 10000)
i_slAtrMultiplier       = input.float (4,    "SL ATR Multiplier",               group = "Strategy: Stop Loss Conditions",    inline = "3", minval = 0, step = 0.1,     tooltip = "Length of ATR used to calculate Stop Loss. \nSize of StopLoss is determined by multiplication of ATR value. Take Profit is derived from this also by multiplying the StopLoss value by the Risk:Reward multiplier.")
i_slLookBack            = input.int(30,   "Lowest Price Before Entry",          group = "Strategy: Stop Loss Conditions",    inline = "4", minval = 30, step = 1,     tooltip = "Lookback to find the Lowest Price. \nStopLoss is determined by the Lowest price of the look back period. Take Profit is derived from this also by multiplying the StopLoss value by the Risk:Reward multiplier.")

//// 3-2. Inputs for Quantity & Risk Manangement: Take Profit
i_riskReward            = input.float(2,    "Risk : Reward  Ratio ",            group = "Strategy: Risk Management",    inline = "1", minval = 0, step = 0.1,     tooltip = "Previous high or low (long/short dependant) is used to determine TP level. 'Risk : Reward' ratio is then used to calculate SL based of previous high/low level.\n\nIn short, the higher the R:R ratio, the smaller the SL since TP target is fixed by previous high/low price data.")
i_accountRiskPercent    = input.float(1,    "Portfolio Risk %",                 group = "Strategy: Risk Management",    inline = "1", minval = 0, step = 0.1,     tooltip = "Percentage of portfolio you lose if trade hits SL.\n\nYou then stand to gain\n  Portfolio Risk % * Risk : Reward\nif trade hits TP.")


// 4. Inputs for Drawings
i_showTpSlBoxes       = input.bool(false,  "Show TP / SL Boxes",               group = "Strategy: Drawings",           inline = "1",  tooltip = "Show or hide TP and SL position boxes.\n\nNote: TradingView limits the maximum number of boxes that can be displayed to 500 so they may not appear for all price data under test.")
i_showLabels          = input.bool(false, "Show Trade Exit Labels",            group = "Strategy: Drawings",           inline = "1",  tooltip = "Useful labels to identify Profit/Loss and cumulative portfolio capital after each trade closes.\n\nAlso note that TradingView limits the max number of 'boxes' that can be displayed on a chart (max 500). This means when you lookback far enough on the chart you will not see the TP/SL boxes. However you can check this option to identify where trades exited.")
i_showDashboard       = input.bool(false, "Show Dashboard",                    group = "Strategy: Drawings",           inline = "1",  tooltip = "Show Backtest Results")
i_show_color_bar      = input.bool(false , "Color Bars",                       group = "Strategy: Drawings",           inline = "1")
// 5. Inputs for Indicators
//// 5-1. Inputs for Indicator - 1: SSL Hybrid
i_useTrueRange = input.bool(defval = true , title = "use true range for Keltner Channel?", tooltip = "", inline = " ", group = "1: SSL Hybrid")
i_maType = input.string(defval='EMA', title='Baseline Type', options=['SMA', 'EMA', 'DEMA', 'TEMA', 'LSMA', 'WMA', 'MF', 'VAMA', 'TMA', 'HMA', 'JMA', 'Kijun v2', 'EDSMA', 'McGinley'],group = "1: SSL Hybrid")
i_len = input.int(defval=30,title='Baseline Length', group = "1: SSL Hybrid")
i_multy = input.float(0.2, step=0.05, title='Base Channel Multiplier', group = "1: SSL Hybrid")

// Input for Baseline
i_kidiv = input.int(defval=1, maxval=4, minval=0, title='Kijun MOD Divider',inline="Kijun v2", group="1: SSL Hybrid")
i_jurik_phase = input.int(defval=3, title='Baseline Type = JMA -> Jurik Phase', inline='JMA',group="1: SSL Hybrid")
i_jurik_power = input.int(defval=1, title='Baseline Type = JMA -> Jurik Power', inline='JMA',group="1: SSL Hybrid")
i_volatility_lookback = input.int(defval=10, title='Baseline Type = VAMA -> Volatility lookback length', inline='VAMA',group="1: SSL Hybrid")
// MF
i_beta = input.float(0.8, minval=0, maxval=1, step=0.1, title='Baseline Type = MF (Modular Filter, General Filter) ->Beta', inline='MF',group="1: SSL Hybrid")
i_feedback = input.bool(defval=false, title='Baseline Type = MF (Modular Filter) -> Use Feedback?', inline='MF',group="1: SSL Hybrid")
i_z = input.float(0.5, title='Baseline Type = MF (Modular Filter) ->  Feedback Weighting', step=0.1, minval=0, maxval=1, inline='MF',group="1: SSL Hybrid")
// EDSMA
i_ssfLength = input.int(title='EDSMA - Super Smoother Filter Length', minval=1, defval=20, inline='EDSMA',group="1: SSL Hybrid")
i_ssfPoles = input.int(title='EDSMA - Super Smoother Filter Poles', defval=2, options=[2, 3], inline='EDSMA',group="1: SSL Hybrid")

// # ========================================================================= #
// #               Functions for Stop Loss & Take Profit & Plots
// # ========================================================================= #

percentAsPoints(pcnt) =>
    math.round(pcnt / 100 * close / syminfo.mintick)

calcStopLossPrice(pointsOffset, isLong) =>
    priceOffset = pointsOffset * syminfo.mintick
    if isLong
        close - priceOffset
    else
        close + priceOffset

calcProfitTrgtPrice(pointsOffset, isLong) =>
    calcStopLossPrice(-pointsOffset, isLong)


printLabel(barIndex, msg) => label.new(barIndex, close, msg)

printTpSlHitBox(left, right, slHit, tpHit, entryPrice, slPrice, tpPrice) =>
    if i_showTpSlBoxes
        box.new (left = left,   top = entryPrice,   right = right,  bottom = slPrice,   bgcolor = slHit ? color.new(color.red, 60)   : color.new(color.gray, 90), border_width = 0)
        box.new (left = left,   top = entryPrice,   right = right,  bottom = tpPrice,   bgcolor = tpHit ? color.new(color.green, 60) : color.new(color.gray, 90), border_width = 0)
        line.new(x1 = left,     y1 = entryPrice,    x2 = right,     y2 = entryPrice,    color = color.new(color.yellow, 20))
        line.new(x1 = left,     y1 = slPrice,       x2 = right,     y2 = slPrice,       color = color.new(color.red, 20))
        line.new(x1 = left,     y1 = tpPrice,       x2 = right,     y2 = tpPrice,       color = color.new(color.green, 20))

printTpSlNotHitBox(left, right, entryPrice, slPrice, tpPrice) =>
    if i_showTpSlBoxes
        box.new (left = left,   top = entryPrice,   right = right,  bottom = slPrice,   bgcolor = color.new(color.gray, 90), border_width = 0)
        box.new (left = left,   top = entryPrice,   right = right,  bottom = tpPrice,   bgcolor = color.new(color.gray, 90), border_width = 0)
        line.new(x1 = left,     y1 = entryPrice,    x2 = right,     y2 = entryPrice,    color = color.new(color.yellow, 20))
        line.new(x1 = left,     y1 = slPrice,       x2 = right,     y2 = slPrice,       color = color.new(color.red, 20))
        line.new(x1 = left,     y1 = tpPrice,       x2 = right,     y2 = tpPrice,       color = color.new(color.green, 20))

printTradeExitLabel(x, y, posSize, entryPrice, pnl) =>
    if i_showLabels
        labelStr = "Position Size: " + str.tostring(math.abs(posSize), "#.##") + "\nPNL: " + str.tostring(pnl, "#.##") + "\nCapital: " + str.tostring(strategy.equity, "#.##") + "\nEntry Price: " + str.tostring(entryPrice, "#.##") + "\nExit Price: " + str.tostring(close,"#.##")
        label.new(x = x, y = y, text = labelStr, color = pnl > 0 ? color.new(color.green, 60) : color.new(color.red, 60), textcolor = color.white, style = label.style_label_down)

f_fillCell(_table, _column, _row, _title, _value, _bgcolor, _txtcolor) =>
    _cellText = _title + " " + _value
    table.cell(_table, _column, _row, _cellText, bgcolor=_bgcolor, text_color=_txtcolor, text_size=size.auto)

// # ========================================================================= #
// #                          Entry, Close Logic
// # ========================================================================= #
// 1. Calculate Indicators
//// 1-1. Calculate Indicators for SSL Hybrid Baseline
////// TEMA
tema(src, len) =>
    ema1 = ta.ema(src, len)
    ema2 = ta.ema(ema1, len)
    ema3 = ta.ema(ema2, len)
    3 * ema1 - 3 * ema2 + ema3
////// EDSMA
get2PoleSSF(src, length) =>
    PI = 2 * math.asin(1)
    arg = math.sqrt(2) * PI / length
    a1 = math.exp(-arg)
    b1 = 2 * a1 * math.cos(arg)
    c2 = b1
    c3 = -math.pow(a1, 2)
    c1 = 1 - c2 - c3

    ssf = 0.0
    ssf := c1 * src + c2 * nz(ssf[1]) + c3 * nz(ssf[2])
    ssf

get3PoleSSF(src, length) =>
    PI = 2 * math.asin(1)

    arg = PI / length
    a1 = math.exp(-arg)
    b1 = 2 * a1 * math.cos(1.738 * arg)
    c1 = math.pow(a1, 2)

    coef2 = b1 + c1
    coef3 = -(c1 + b1 * c1)
    coef4 = math.pow(c1, 2)
    coef1 = 1 - coef2 - coef3 - coef4

    ssf = 0.0
    ssf := coef1 * src + coef2 * nz(ssf[1]) + coef3 * nz(ssf[2]) + coef4 * nz(ssf[3])
    ssf

ma(type, src, len) =>
    float result = 0
    if type == 'TMA'
        result := ta.sma(ta.sma(src, math.ceil(len / 2)), math.floor(len / 2) + 1)
        result
    if type == 'MF'
        ts = 0.
        b = 0.
        c = 0.
        os = 0.
        //----
        alpha = 2 / (len + 1)
        a = i_feedback ? i_z * src + (1 - i_z) * nz(ts[1], src) : src
        //----
        b := a > alpha * a + (1 - alpha) * nz(b[1], a) ? a : alpha * a + (1 - alpha) * nz(b[1], a)
        c := a < alpha * a + (1 - alpha) * nz(c[1], a) ? a : alpha * a + (1 - alpha) * nz(c[1], a)
        os := a == b ? 1 : a == c ? 0 : os[1]
        //----
        upper = i_beta * b + (1 - i_beta) * c
        lower = i_beta * c + (1 - i_beta) * b
        ts := os * upper + (1 - os) * lower
        result := ts
        result
    if type == 'LSMA'
        result := ta.linreg(src, len, 0)
        result
    if type == 'SMA'  // Simple
        result := ta.sma(src, len)
        result
    if type == 'EMA'  // Exponential
        result := ta.ema(src, len)
        result
    if type == 'DEMA'  // Double Exponential
        e = ta.ema(src, len)
        result := 2 * e - ta.ema(e, len)
        result
    if type == 'TEMA'  // Triple Exponential
        e = ta.ema(src, len)
        result := 3 * (e - ta.ema(e, len)) + ta.ema(ta.ema(e, len), len)
        result
    if type == 'WMA'  // Weighted
        result := ta.wma(src, len)
        result
    if type == 'VAMA'  // Volatility Adjusted
        /// Copyright © 2019 to present, Joris Duyck (JD)
        mid = ta.ema(src, len)
        dev = src - mid
        vol_up = ta.highest(dev, i_volatility_lookback)
        vol_down = ta.lowest(dev, i_volatility_lookback)
        result := mid + math.avg(vol_up, vol_down)
        result
    if type == 'HMA'  // Hull
        result := ta.wma(2 * ta.wma(src, len / 2) - ta.wma(src, len), math.round(math.sqrt(len)))
        result
    if type == 'JMA'  // Jurik
        /// Copyright © 2018 Alex Orekhov (everget)
        /// Copyright © 2017 Jurik Research and Consulting.
        phaseRatio = i_jurik_phase < -100 ? 0.5 : i_jurik_phase > 100 ? 2.5 : i_jurik_phase / 100 + 1.5
        beta = 0.45 * (len - 1) / (0.45 * (len - 1) + 2)
        alpha = math.pow(beta, i_jurik_power)
        jma = 0.0
        e0 = 0.0
        e0 := (1 - alpha) * src + alpha * nz(e0[1])
        e1 = 0.0
        e1 := (src - e0) * (1 - beta) + beta * nz(e1[1])
        e2 = 0.0
        e2 := (e0 + phaseRatio * e1 - nz(jma[1])) * math.pow(1 - alpha, 2) + math.pow(alpha, 2) * nz(e2[1])
        jma := e2 + nz(jma[1])
        result := jma
        result
    if type == 'Kijun v2'
        kijun = math.avg(ta.lowest(len), ta.highest(len))  //, (open + close)/2)
        conversionLine = math.avg(ta.lowest(len / i_kidiv), ta.highest(len / i_kidiv))
        delta = (kijun + conversionLine) / 2
        result := delta
        result
    if type == 'McGinley'
        mg = 0.0
        mg := na(mg[1]) ? ta.ema(src, len) : mg[1] + (src - mg[1]) / (len * math.pow(src / mg[1], 4))
        result := mg
        result
    if type == 'EDSMA'
        zeros = src - nz(src[2])
        avgZeros = (zeros + zeros[1]) / 2

        // Ehlers Super Smoother Filter
        ssf = i_ssfPoles == 2 ? get2PoleSSF(avgZeros, i_ssfLength) : get3PoleSSF(avgZeros, i_ssfLength)

        // Rescale filter in terms of Standard Deviations
        stdev = ta.stdev(ssf, len)
        scaledFilter = stdev != 0 ? ssf / stdev : 0

        alpha = 5 * math.abs(scaledFilter) / len

        edsma = 0.0
        edsma := alpha * src + (1 - alpha) * nz(edsma[1])
        result := edsma
        result
    result

////// Keltner Baseline Channel (Baseline)
BBMC = ma(i_maType, close, i_len)
Keltma = ma(i_maType, close, i_len)
range_1 = i_useTrueRange ? ta.tr : high - low
rangema = ta.ema(range_1, i_len)
upperk = Keltma + rangema * i_multy
lowerk = Keltma - rangema * i_multy

// 2. Entry Condition for Long and Short
// Condition 1
bullSSL             = close > upperk
bearSSL             = close < lowerk
// Enter Position based on Condition 1
goLong              = inDateRange and bullSSL
goShort             = inDateRange and bearSSL
// # ========================================================================= #
// #                   Position Control Logic (Entry & Exit)
// # ========================================================================= #
// 1. Trade entry and exit variables
var tradeEntryBar   = bar_index
var profitPoints    = 0.
var lossPoints      = 0.
var slPrice         = 0.
var tpPrice         = 0.
var inLong          = false
var inShort         = false
// 2. Entry decisions
openLong            = (goLong and not inLong)                           // Long entry condition & not in long position
openShort           = (goShort and not inShort)                         // Short entry condition & not in short position
flippingSides       = (goLong and inShort) or (goShort and inLong)      // (Long entry condition & in short position) and the opposite
enteringTrade       = openLong or openShort                             // Entering Long or Short Condition
inTrade             = inLong or inShort
// 3. Stop Loss & Take Profit Percent
lowestLow           = ta.lowest(source = low, length = i_slLookBack)
highestHigh         = ta.highest(source = high, length = i_slLookBack)
llhhSLPercent       = openLong ? math.abs((close - lowestLow) / close) * 100 : openShort ? math.abs((highestHigh - close) / close) * 100 : na
atr                 = ta.atr(i_slAtrLength)
slAmount            = atr * i_slAtrMultiplier
slPercent           = i_slType == 'ATR' ? math.abs((1 - (close - slAmount) / close) * 100) : i_slType == 'Percent' ? i_slPercent : llhhSLPercent
tpPercent           = slPercent * i_riskReward
// 4. Risk calculations & Quantity Management
riskAmt             = strategy.equity * i_accountRiskPercent / 100
entryQty            = math.abs(riskAmt / slPercent * 100)  / close

// 5. Open Position
if openLong
    if strategy.position_size < 0
        printTpSlNotHitBox(tradeEntryBar + 1, bar_index + 1, strategy.position_avg_price, slPrice, tpPrice)
        printTradeExitLabel(bar_index + 1, math.max(tpPrice, slPrice), strategy.position_size, strategy.position_avg_price, strategy.openprofit)
    strategy.entry("Long", strategy.long, qty = entryQty, alert_message = "Long Entry")
    enteringTrade   := true
    inLong          := true
    inShort         := false

if openShort
    if strategy.position_size > 0
        printTpSlNotHitBox(tradeEntryBar + 1, bar_index + 1, strategy.position_avg_price, slPrice, tpPrice)
        printTradeExitLabel(bar_index + 1, math.max(tpPrice, slPrice), strategy.position_size, strategy.position_avg_price, strategy.openprofit)
    strategy.entry("Short", strategy.short, qty = entryQty, alert_message = "Short Entry")
    enteringTrade   := true
    inShort         := true
    inLong          := false

if enteringTrade
    profitPoints    := percentAsPoints(tpPercent)
    lossPoints      := percentAsPoints(slPercent)
    slPrice         := calcStopLossPrice(lossPoints, openLong)
    tpPrice         := calcProfitTrgtPrice(profitPoints, openLong)
    tradeEntryBar   := bar_index

// Can add more take profit Actions
strategy.exit("TP/SL", profit = profitPoints, loss = lossPoints, comment_profit = "TP Hit", comment_loss = "SL Hit", alert_profit = "TP Hit Alert", alert_loss = "SL Hit Alert")

// # ========================================================================= #
// #                    Plots (Bar Color, Plot, Label, Boxes)
// # ========================================================================= #

// 1. SSL Hybrid Baseline
longColor = #00c3ff
shortColor = #ff0062
color_bar = close > upperk ? longColor : close < lowerk ? shortColor : color.gray
p1 = plot(BBMC, color=color.new(color=color_bar, transp=0), linewidth=4, title='MA Baseline')

// 2. Bar color Based On SSL Hybrid Baseline
barcolor(i_show_color_bar ? color_bar : na)
up_channel = plot(upperk, color=color_bar, title='Baseline Upper Channel')
low_channel = plot(lowerk, color=color_bar, title='Basiline Lower Channel')
fill(up_channel, low_channel, color.new(color=color_bar, transp=90))


// 3. Stoploss Boxes
slHit           = (inShort and high >= slPrice) or (inLong  and low <= slPrice)
tpHit           = (inLong  and high >= tpPrice) or (inShort and low <= tpPrice)
exitTriggered   = slHit or tpHit
entryPrice      = strategy.closedtrades.entry_price (strategy.closedtrades - 1)
pnl             = strategy.closedtrades.profit      (strategy.closedtrades - 1)
posSize         = strategy.closedtrades.size        (strategy.closedtrades - 1)

if (inTrade and exitTriggered)
    inShort    := false
    inLong     := false
    printTpSlHitBox(tradeEntryBar + 1, bar_index, slHit, tpHit, entryPrice, slPrice, tpPrice)
    printTradeExitLabel(bar_index, math.max(tpPrice, slPrice), posSize, entryPrice, pnl)

if barstate.islastconfirmedhistory and strategy.position_size != 0
    printTpSlNotHitBox(tradeEntryBar + 1, bar_index + 1, strategy.position_avg_price, slPrice, tpPrice)


// 4. Data Windows
plotchar(slPrice,    "Stop Loss Price",     "")
plotchar(tpPrice,    "Take Profit Price",   "")

// 5. Showing Labels
plotDebugLabels = false
if plotDebugLabels
    if bar_index == tradeEntryBar
        printLabel(bar_index, "Position size: " + str.tostring(entryQty * close, "#.##"))

// 6. Showing Dashboard
if i_showDashboard
    var bgcolor = color.new(color.black,0)

    // Keep track of Wins/Losses streaks
    newWin  = (strategy.wintrades  > strategy.wintrades[1]) and (strategy.losstrades == strategy.losstrades[1]) and (strategy.eventrades == strategy.eventrades[1])
    newLoss = (strategy.wintrades == strategy.wintrades[1]) and (strategy.losstrades  > strategy.losstrades[1]) and (strategy.eventrades == strategy.eventrades[1])

    varip int winRow     = 0
    varip int lossRow    = 0
    varip int maxWinRow  = 0
    varip int maxLossRow = 0

    if newWin
        lossRow := 0
        winRow := winRow + 1
    if winRow > maxWinRow
        maxWinRow := winRow

    if newLoss
        winRow := 0
        lossRow := lossRow + 1
    if lossRow > maxLossRow
        maxLossRow := lossRow


    // Prepare stats table
    var table dashTable = table.new(position.bottom_right, 1, 15, border_width=1)


    if barstate.islastconfirmedhistory
        // Update table
        dollarReturn = strategy.netprofit
        f_fillCell(dashTable, 0, 0, "Start:", str.format("{0,date,long}", strategy.closedtrades.entry_time(0)) , bgcolor, color.white) // + str.format(" {0,time,HH:mm}", strategy.closedtrades.entry_time(0))
        f_fillCell(dashTable, 0, 1, "End:", str.format("{0,date,long}", strategy.opentrades.entry_time(0)) , bgcolor, color.white) // + str.format(" {0,time,HH:mm}", strategy.opentrades.entry_time(0))
        _profit = (strategy.netprofit / strategy.initial_capital) * 100
        f_fillCell(dashTable, 0, 2, "Net Profit:", str.tostring(_profit, '##.##') + "%", _profit > 0 ? color.green : color.red, color.white)
        _numOfDaysInStrategy = (strategy.opentrades.entry_time(0) - strategy.closedtrades.entry_time(0)) / (1000 * 3600 * 24)
        f_fillCell(dashTable, 0, 3, "Percent Per Day", str.tostring(_profit / _numOfDaysInStrategy, '#########################.#####')+"%", _profit > 0 ? color.green : color.red, color.white)
        _winRate = ( strategy.wintrades / strategy.closedtrades ) * 100
        f_fillCell(dashTable, 0, 4, "Percent Profitable:", str.tostring(_winRate, '##.##') + "%", _winRate < 50 ? color.red : _winRate < 75 ? #999900 : color.green, color.white)
        f_fillCell(dashTable, 0, 5, "Profit Factor:", str.tostring(strategy.grossprofit / strategy.grossloss,  '##.###'), strategy.grossprofit > strategy.grossloss ? color.green : color.red, color.white)
        f_fillCell(dashTable, 0, 6, "Total Trades:", str.tostring(strategy.closedtrades), bgcolor, color.white)
        f_fillCell(dashTable, 0, 8, "Max Wins In A Row:", str.tostring(maxWinRow, '######') , bgcolor, color.white)
        f_fillCell(dashTable, 0, 9, "Max Losses In A Row:", str.tostring(maxLossRow, '######') , bgcolor, color.white)