Kurzfristige Handelsstrategie basierend auf dem RSI-Indikator
Überblick
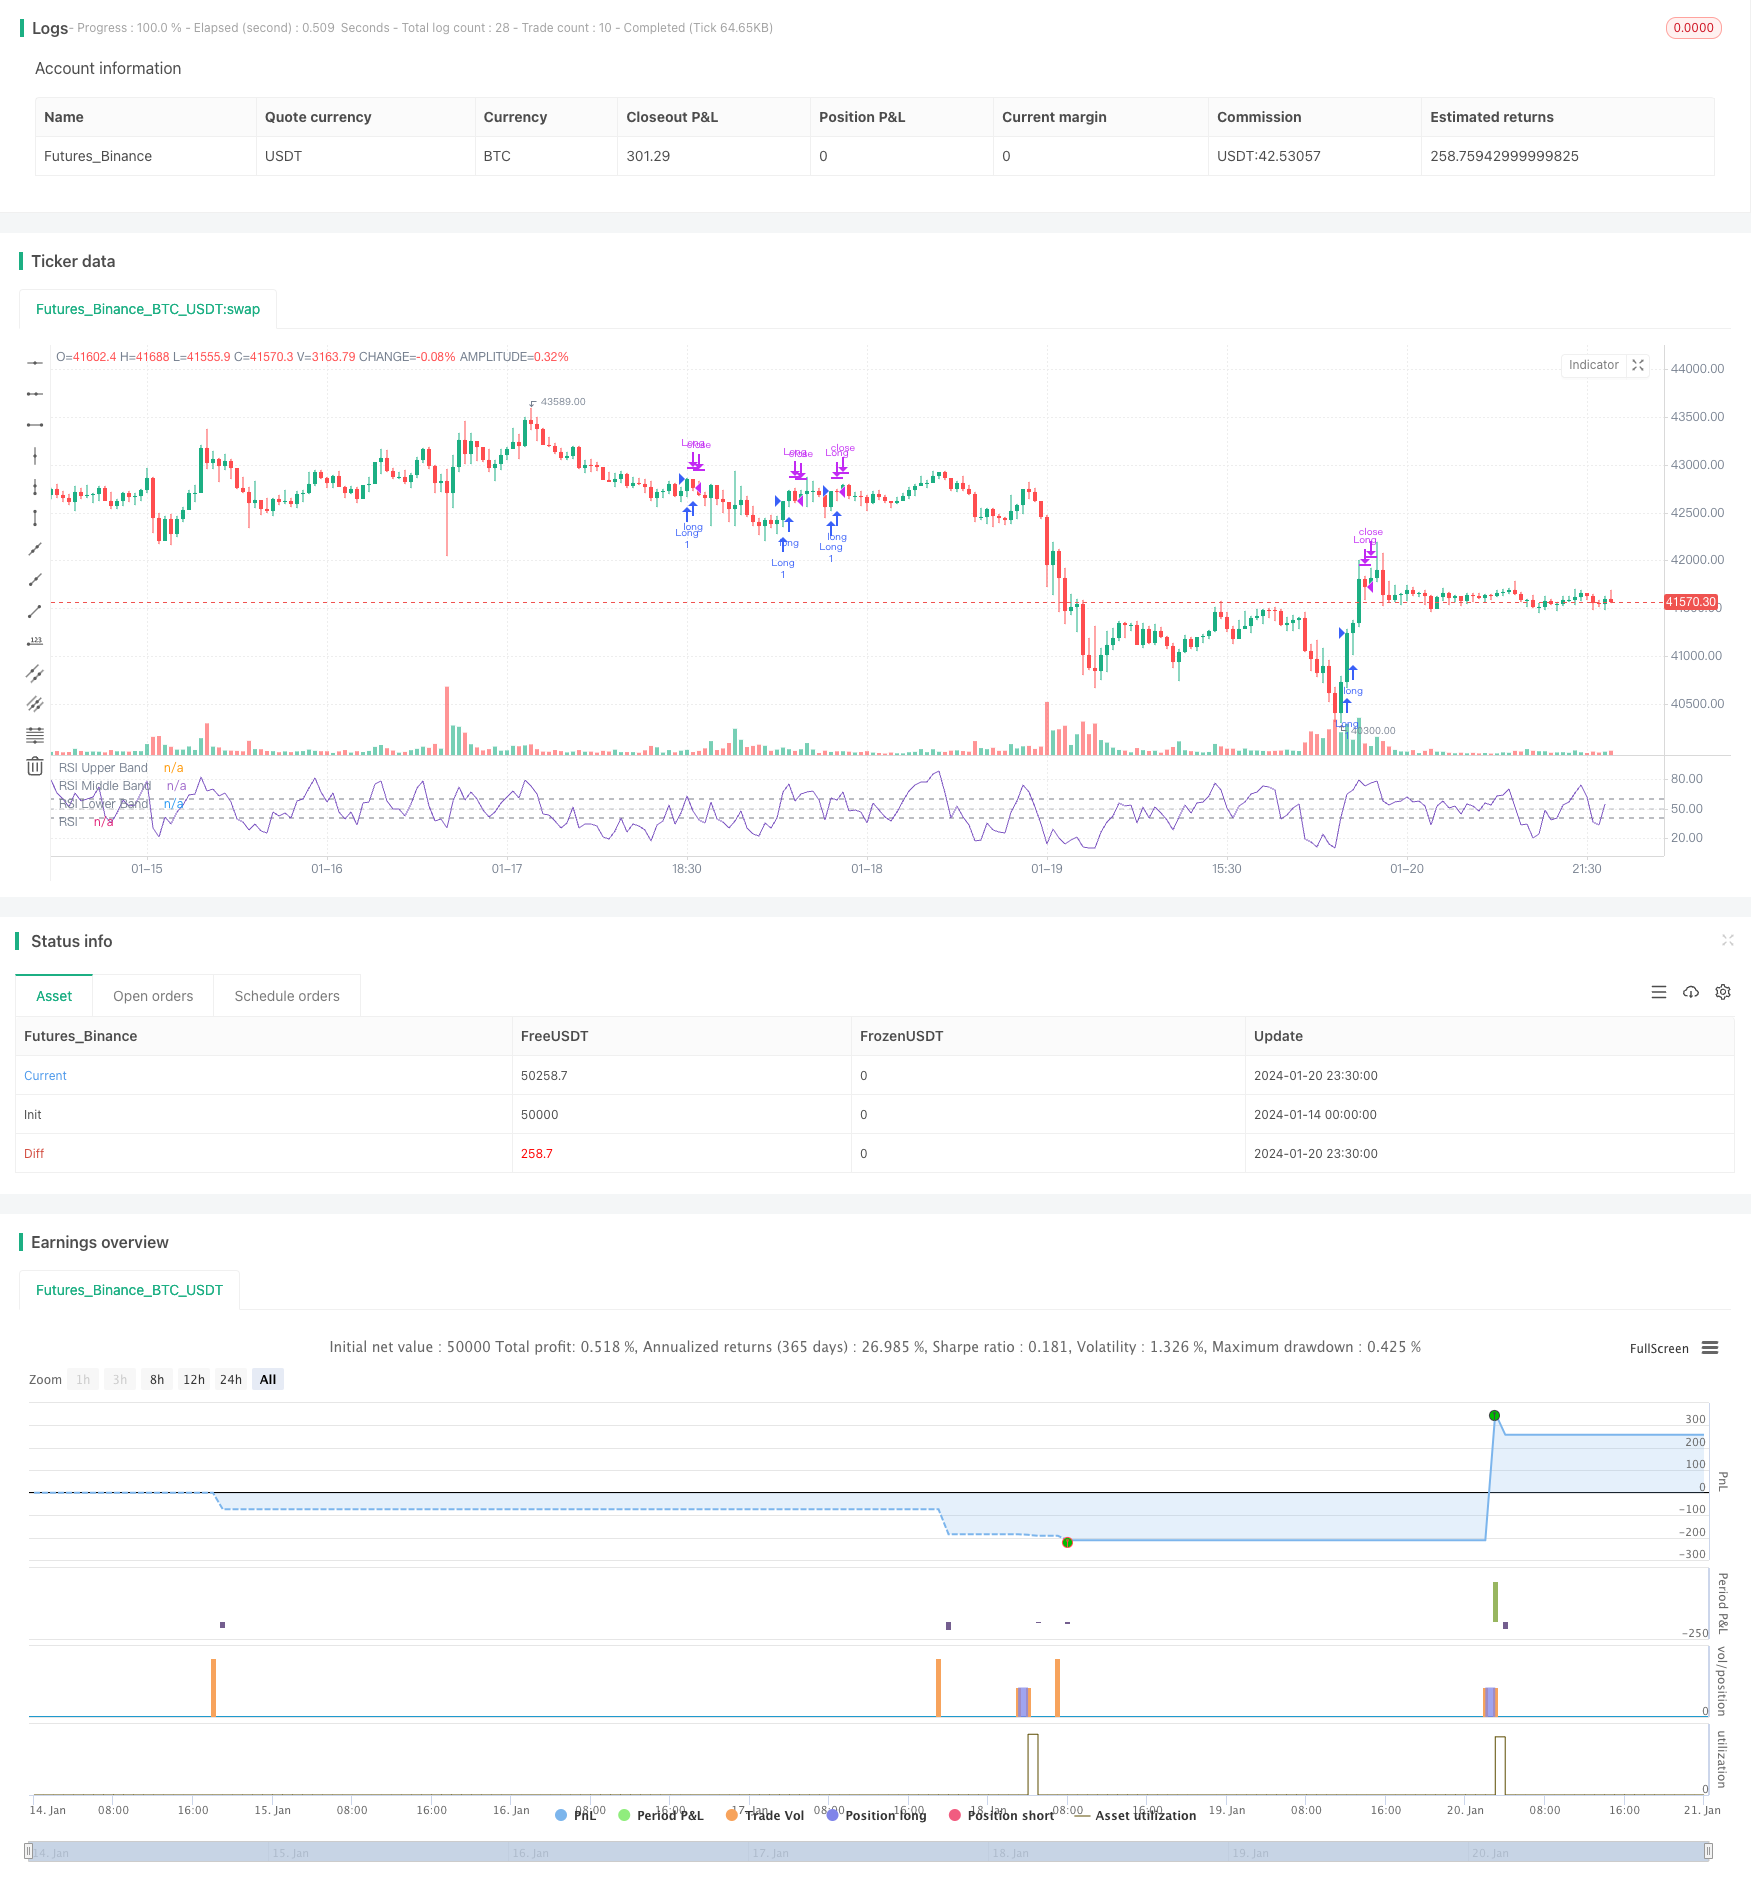
Die Strategie ist eine Short-Line-Trading-Strategie, die auf dem RSI basiert. Sie nutzt den RSI-Indikator, um potenzielle starke oder schwache Zustände des Marktes zu identifizieren und so die Handelsentscheidungen zu unterstützen.
Die Strategie nutzt den RSI-Indikator mit 5 Zyklen, um die kurze Kursbewegung zu erfassen. Sie beurteilt die Zeit der Ein- und Ausstiegszeit anhand der Höhen und Tiefen der RSI-Kurve.
Strategieprinzip
Die Bedingungen für den Eintritt in eine Multiposition sind: Der RSI-Wert der vorherigen K-Linie ist niedriger als 50; der RSI-Wert der aktuellen K-Linie ist höher als 60.
Die Ausgleichsbedingungen sind: Wenn die RSI-Kurve einen niedrigeren Tiefpunkt aufweist, um eine Trendwende zu signalisieren, werden die Mehrkopfpositionen ausgeglichen.
Analyse der Stärken
- Die Verwendung des RSI-Indikators ermöglicht die effektive Identifizierung von Preiswendepunkten in einem Markt. Die Kombination von Kurven mit hohen und niedrigen RSI-Punkten ist eine starke Indikation.
- Der 5-Perioden-RSI ist in der Lage, schnelle Veränderungen der Kurzlinie zu erfassen und eignet sich für den Kurzstreckenhandel.
- Die Regeln für strategische Entscheidungen sind klar, einfach und leicht umzusetzen.
Risikoanalyse
- Der RSI kann zu Fehlschlägen führen, die zu Stop Losses führen.
- Kurzstrecken können die Häufigkeit der Transaktionen erhöhen und die Kosten für die Gleitpunkte erhöhen.
- In der Realität ist es notwendig, die Parameter wie die Anzahl der RSI-Zyklen, die Höhe und die Tiefe des Tiefstwerts zu korrigieren.
Optimierungsmethoden:
- In Kombination mit anderen Indikatoren filtern Sie die Signale, um die Fehlerrate zu senken.
- Die Stop-Line sollte entsprechend gelockert werden, um eine Überempfindlichkeit zu vermeiden.
- Anpassung der RSI-Parameter auf die optimale Kombination der Parameter.
Zusammenfassen
Die Strategie nutzt die Wende von Höhen und Tiefen des RSI-Indikators und enthält klare Mehrkopf-Ein- und Stop-Loss-Regeln. Ein einfacher, praktischer Handelsgedanke, aber auch eine gewisse Instabilität. Die Strategie kann durch Optimierung von Parametern und Kombinationen von Indikatoren zur Steigerung der Strategiestabilität verwendet werden.
/*backtest
start: 2024-01-14 00:00:00
end: 2024-01-21 00:00:00
period: 30m
basePeriod: 15m
exchanges: [{"eid":"Futures_Binance","currency":"BTC_USDT"}]
*/

//@version=5
strategy("*RSI 5 - Long only- Daily charts & above*", overlay = false)

// Define inputs
rsi_length = input(5, "RSI Length")

// Calculate indicators
rsi = ta.rsi(close, rsi_length)

// Entry conditions
long = rsi[1] < 50 and rsi > 60

// Exit conditions
longExit = rsi < rsi[1]


// Execute trade with adjusted position size
if (long)
    strategy.entry("Long", strategy.long)


if  (longExit)
	strategy.close("LongExit")


// Close long position if long exit condition is met
if (longExit)
    strategy.close("Long", comment="Long exit")

rsiPlot = plot(rsi, "RSI", color=#7E57C2)
rsiUpperBand = hline(60, "RSI Upper Band", color=#787B86)
midline = hline(50, "RSI Middle Band", color=color.new(#787B86, 50))
rsiLowerBand = hline(40, "RSI Lower Band", color=#787B86)
fill(rsiUpperBand, rsiLowerBand, color=color.rgb(126, 87, 194, 90), title="RSI Background Fill")