Multi-Indikator-Entscheidungsbaum-Strategie: IMACD, EMA und Ichimoku Kinko Hyo
Überblick
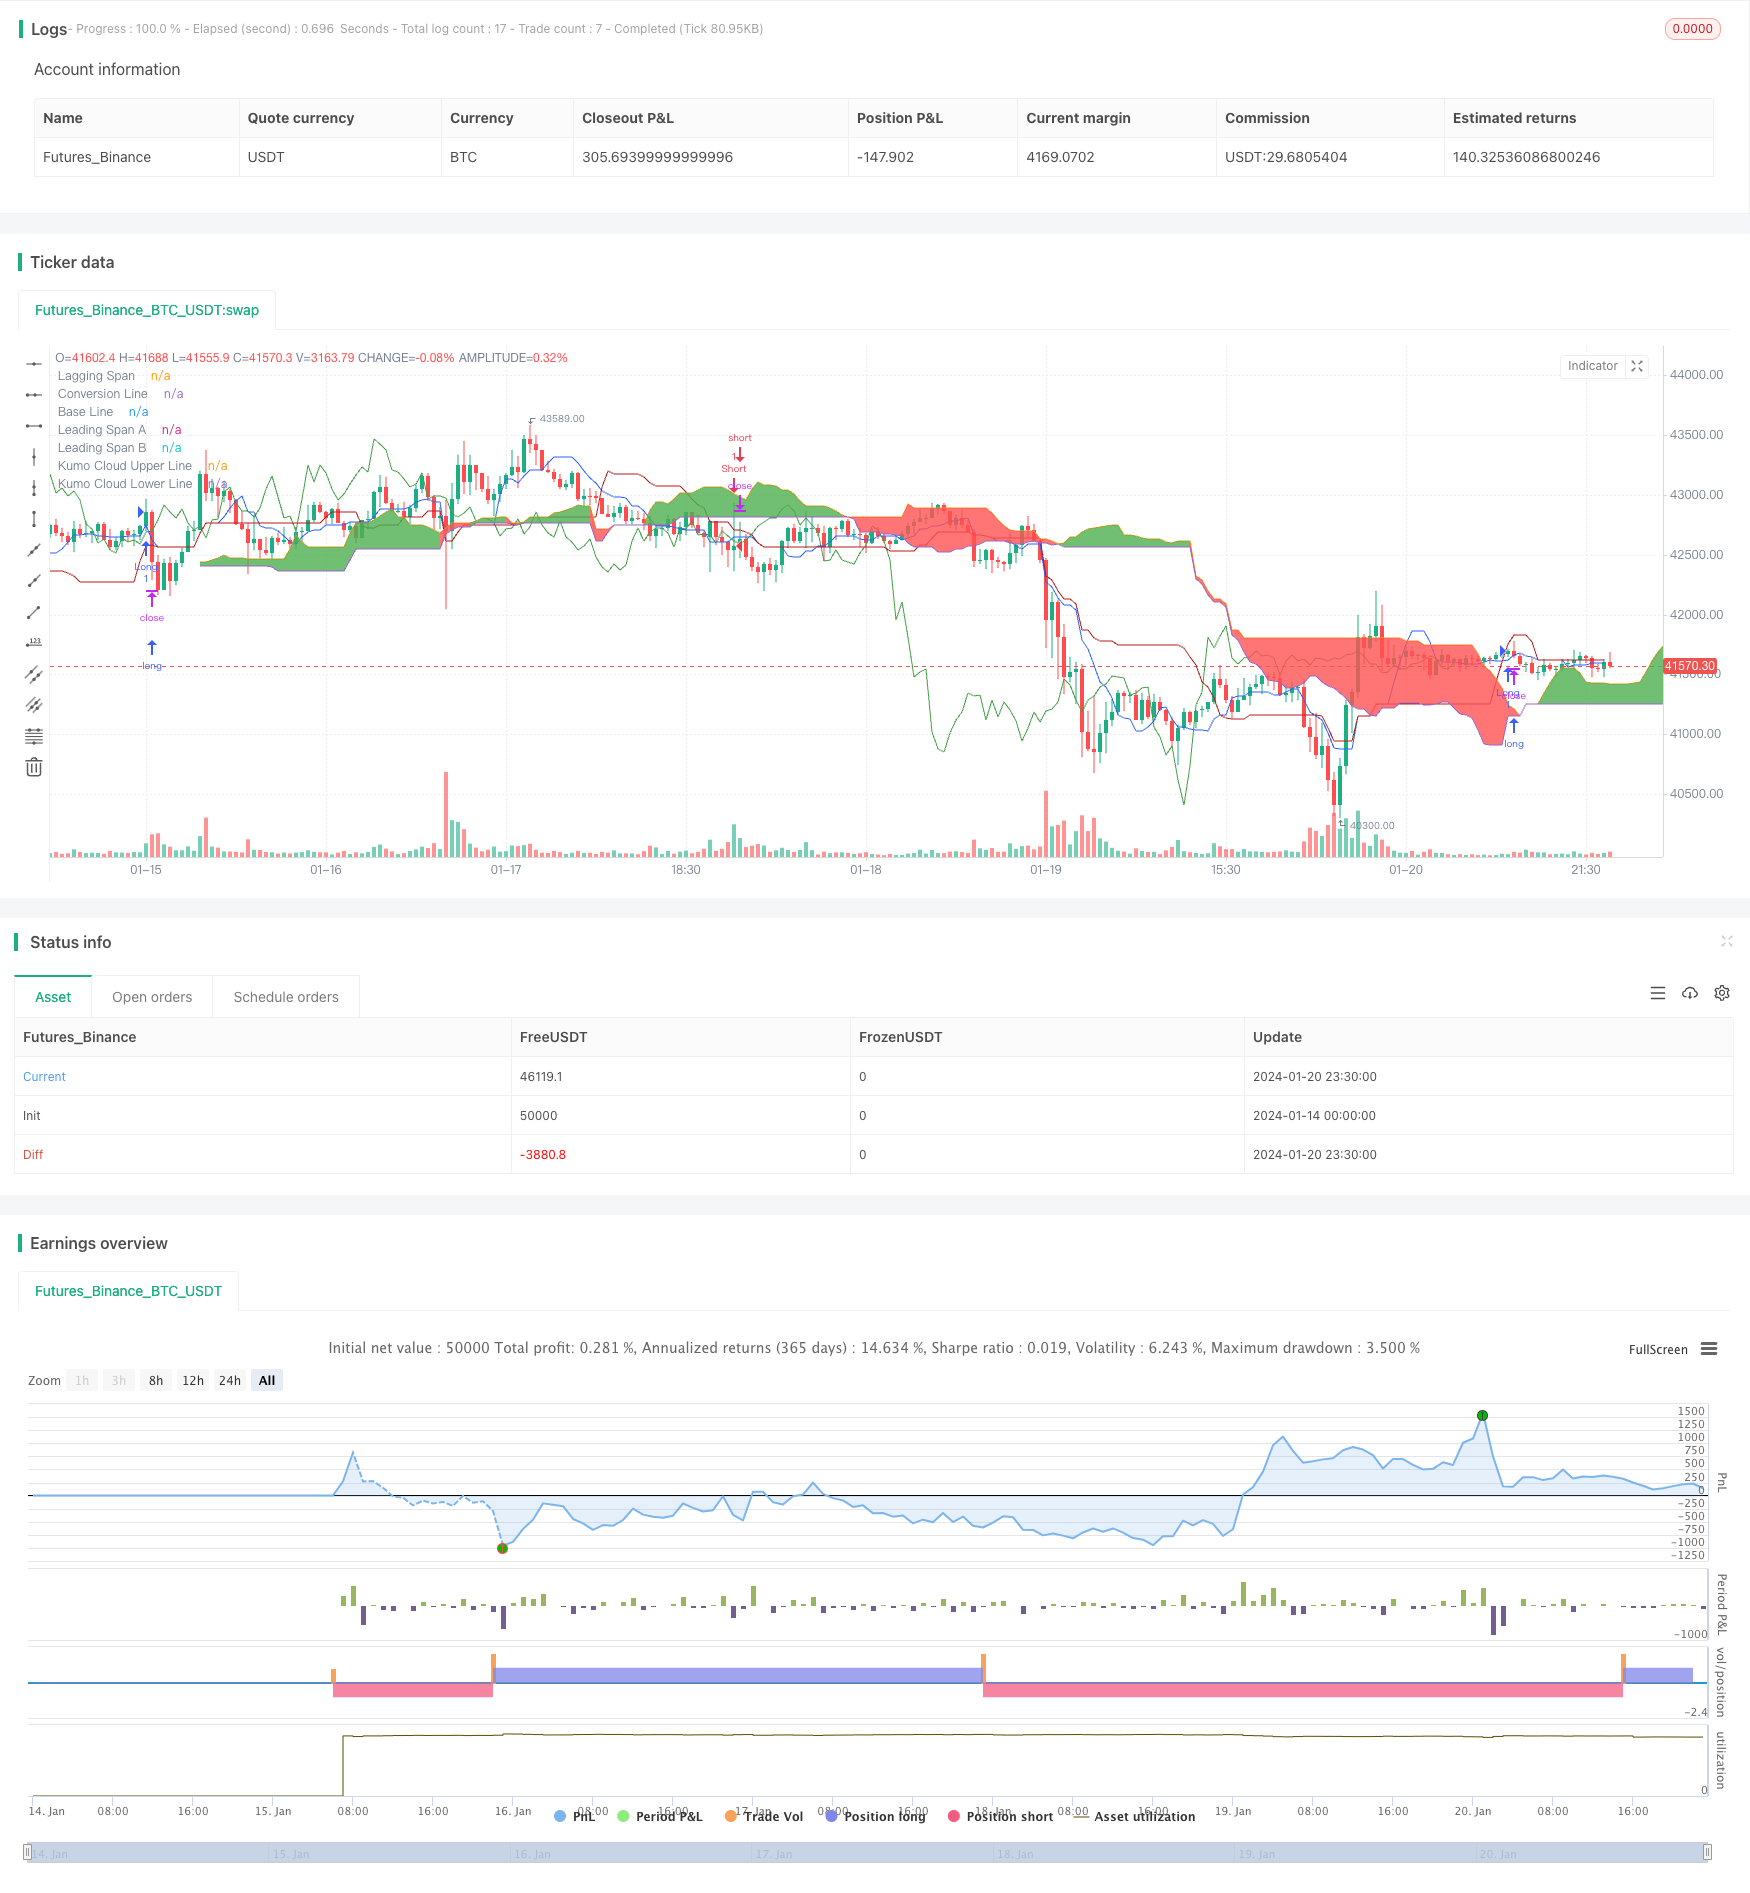
Die Strategie verwendet verschiedene technische Indikatoren wie IMACD, EMA und die Gleichgewichtstabelle, um ein umfassendes Entscheidungsbaummodell für Kauf- und Verkaufssignale zu erstellen.
Strategieprinzip
- IMACD: Erweiterte MACD, um Markttrends durch ImpulseMACD und ImpulseHisto besser zu erfassen
- Gleichgewichtstabelle: Zeichnung von Wechsellinien, Referenzlinien, Vorreiterlinien A, Vorreiterlinien B usw. zur Erfassung von Unterstützungs- und Widerstandspositionen
- EMA 40: Hilfsmittel zur Beurteilung der Trendrichtung
- Über- und Abbruchsignale, basierend auf der spezifischen Beziehung zwischen IMACD, Cloud Graphik-Komponenten und EMA 40
Mehrmachen: Mehrmachen, wenn die IMACD für bestimmte Konditionsfarben und die EMA 40 höher als die Oberbahn des Wolkenbildes ist
Freigeben: Freigeben, wenn der IMACD rot ist und die EMA 40 unterhalb der Unterbahn des Wolkenbildes liegt
Analyse der Stärken
- Mehrindikator-Palette, um die Markttrends zu analysieren und die Entscheidungsgenauigkeit zu verbessern
- Entscheidungsbaummodelle sind eindeutig klassifiziert, Handelssignale werden klar erzeugt
- Die EMA ist flexibel in der Länge und bietet mehr Flexibilität bei der Beurteilung
- In Kombination mit Cloud Charts und Trend Indicatoren, um Unterstützung und Widerstand besser zu erkennen
Risikoanalyse
- Mehrfache Kombination mit komplizierter Parameter-Einstellung
- Unkorrekt eingestellte EMA-Längen können zu falschen Handelssignalen führen
- Es ist schwierig, mehrere Indikatoren gleichzeitig zu beobachten.
Risikolösung: Optimierung der Parameter-Einstellungen, Anpassung der EMA-Länge, Vereinfachung der Bedienungsprozesse.
Optimierungsrichtung
- Optimierung der Parameter-Einstellungen zur Steigerung der Strategie-Stabilität
- Erhöhung der Stop-Loss-Strategie und Kontrolle von Einzelschäden
- Die Messung basiert auf riesigen Datenmengen und verbessert die Signalqualität.
- Die Entwicklung von Adaptive Decision Trees in Kombination mit Machine Learning Algorithmen
Zusammenfassen
Die Strategie verwendet eine Kombination aus verschiedenen Indikatoren, um Trends zu identifizieren und ein Entscheidungsbaummodell zu erstellen, um Handelssignale zu erzeugen. Der Vorteil ist, dass die Signalqualität hoch ist, die Genauigkeit hoch ist und für eine schrittweise Optimierung geeignet ist.
/*backtest
start: 2024-01-14 00:00:00
end: 2024-01-21 00:00:00
period: 30m
basePeriod: 15m
exchanges: [{"eid":"Futures_Binance","currency":"BTC_USDT"}]
*/

//@version=5
strategy("Decision Tree Strategy: IMACD, EMA and Ichimoku [cryptoonchain]", overlay=true)

lengthMA = input(34, title="Length MA")
lengthSignal = input(9, title="Length Signal")
conversionPeriods = input.int(9, minval=1, title="Conversion Line Length")
basePeriods = input.int(26, minval=1, title="Base Line Length")
laggingSpan2Periods = input.int(52, minval=1, title="Leading Span B Length")
displacement = input.int(26, minval=1, title="Lagging Span")
emaLength = input(40, title="EMA Length")  // Added user-configurable EMA length

calc_smma(src, len) =>
    smma = float(na)
    smma := na(smma[1]) ? ta.sma(src, len) : (smma[1] * (len - 1) + src) / len
    smma

calc_zlema(src, length) =>
    ema1 = ta.ema(src, length)
    ema2 = ta.ema(ema1, length)
    d = ema1 - ema2
    ema1 + d

src = ohlc4
hi = calc_smma(high, lengthMA)
lo = calc_smma(low, lengthMA)
mi = calc_zlema(src, lengthMA)

md = (mi > hi) ? (mi - hi) : (mi < lo) ? (mi - lo) : 0
sb = ta.sma(md, lengthSignal)
sh = md - sb
mdc = src > mi ? (src > hi ? color.rgb(128, 255, 0, 26) : color.green) : (src < lo ? color.red : color.orange)

colorCondition = color.rgb(128, 255, 0, 26)

conversionLine = math.avg(ta.lowest(conversionPeriods), ta.highest(conversionPeriods))
baseLine = math.avg(ta.lowest(basePeriods), ta.highest(basePeriods))
leadLine1 = math.avg(conversionLine, baseLine)
leadLine2 = math.avg(ta.lowest(laggingSpan2Periods), ta.highest(laggingSpan2Periods))

// Use user-configurable length for EMA
ema40 = ta.ema(close, emaLength)

ebc = input(false, title="Enable bar colors")
barcolor(ebc ? mdc : na)

conversionLinePlot = plot(conversionLine, color=#2962FF, title="Conversion Line", display=display.none)
baseLinePlot = plot(baseLine, color=#B71C1C, title="Base Line", display=display.none)
laggingSpanPlot = plot(close, offset=-displacement + 1, color=#43A047, title="Lagging Span", display=display.none)
leadLine1Plot = plot(leadLine1, offset=displacement - 1, color=#A5D6A7, title="Leading Span A", display=display.none)
leadLine2Plot = plot(leadLine2, offset=displacement - 1, color=#EF9A9A, title="Leading Span B", display=display.none)
kumoCloudUpperLinePlot = plot(leadLine1 > leadLine2 ? leadLine1 : leadLine2, offset=displacement - 1, title="Kumo Cloud Upper Line", display=display.none)
kumoCloudLowerLinePlot = plot(leadLine1 < leadLine2 ? leadLine1 : leadLine2, offset=displacement - 1, title="Kumo Cloud Lower Line", display=display.none)
fill(kumoCloudUpperLinePlot, kumoCloudLowerLinePlot, color=leadLine1 > leadLine2 ? color.green : color.red)

a = (leadLine1 > leadLine2 ? leadLine1 : leadLine2)
b = (leadLine1 < leadLine2 ? leadLine1 : leadLine2)

if mdc == colorCondition and ema40 > a[displacement - 1]
    strategy.entry("Long", strategy.long)

if mdc == color.red and ema40 < b[displacement - 1]
    strategy.entry("Short", strategy.short)