Quantitative Handelsstrategie basierend auf Ichimoku Kinko Hyo und Average Directional Index
Überblick
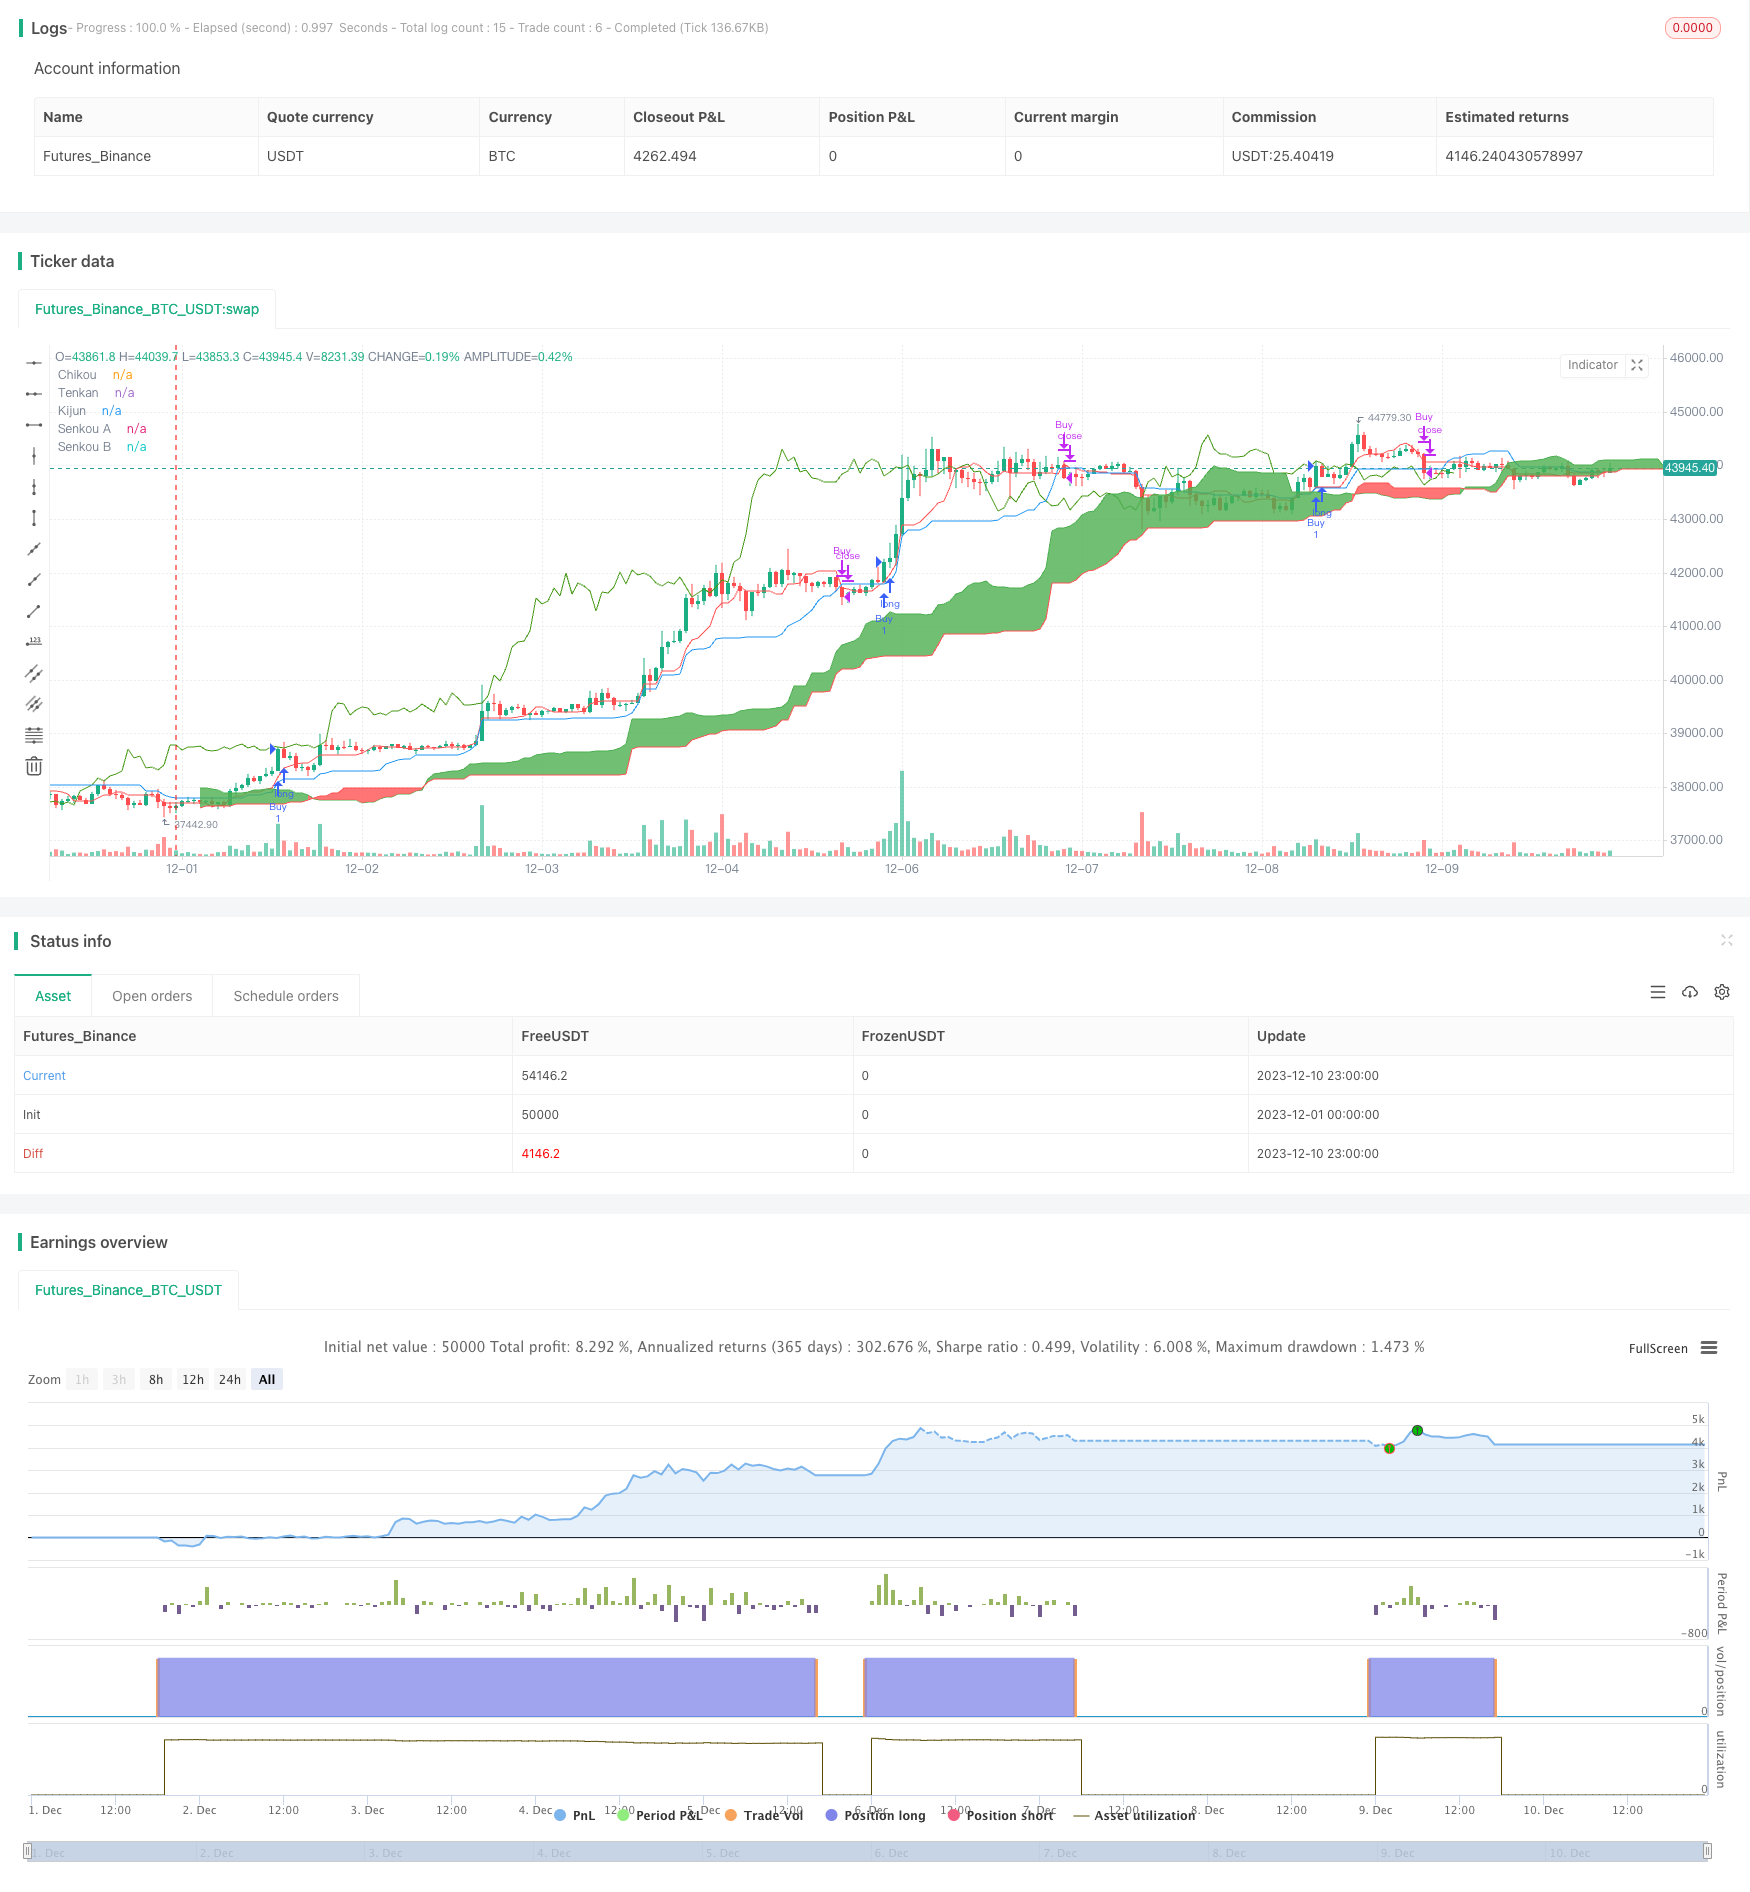
Die Strategie verwendet die Technik der Gleichgewichtstabelle und des Durchschnitts-Directional-Index (ADX) in Kombination, um Trends und wichtige Resistenzpunkte in den Aktienpreisen zu identifizieren und Kauf- und Verkaufssignale zu senden. Die Strategie zielt darauf ab, große Preisschwankungen in trendigen Situationen zu erfassen.
Strategieprinzip
Die erste Gleichgewichtstabelle enthält drei Moving Averages, die vorherige Umrechnungslinie, die Referenzlinie und die Verzögerungslinie. Wenn der Preis die vorherige Umrechnungslinie und die Referenzlinie überschreitet, wird ein Kaufsignal ausgegeben; wenn der Preis die beiden Linien unterhalb durchschreitet, wird ein Verkaufsignal ausgegeben. Darüber hinaus identifiziert die erste Gleichgewichtstabelle die wichtigen Unterstützungs- und Widerstandsbereiche über die Cloud-Diagramme.
Die ADX wird verwendet, um die Stärke der Preisentwicklung zu bestimmen. Wenn + DI und -DI deutlich voneinander getrennt sind, zeigt dies eine Trendentwicklung an. Wenn + DI und -DI nahe sind, zeigt dies eine Ausgleichsentwicklung.
Durch die Kombination von Trendbeurteilungen aus der Gleichgewichtstabelle und der Filterung der Trendstärke durch die ADX können Trendsegmente mit hoher Preisschwankung effektiv identifiziert werden.
Strategische Vorteile
- Die Verwendung einer Kombination aus zwei Indikatoren macht die Handelssignale zuverlässiger
- Der Einsatz von ADX verhindert Fehltransaktionen bei der Bilanzierung
- Gute Rückmeldung mit hohem Gewinn-Risiko-Verhältnis
Risikoanalyse
- Diese Strategie ist besser für Trend-Aktien geeignet, für Aktien, die sich ausgleichen, gibt es möglicherweise weniger Signale
- Die Gleichgewichtstabelle selbst hat Probleme mit der Rückständigkeit und könnte die Chance auf eine schnelle Umkehr verpassen.
- Die ADX-Bewertung ist unvollkommen und kann fehlerhaft sein.
Optimierungsrichtung
- Verschiedene Kombinationen von Parametern können getestet werden, wie z. B. die Anpassung der Umschalungslinie, der Basislinie oder der Periode.
- Weitere Optimierungen können in Kombination mit anderen Indikatoren wie MACD, KD usw. vorgenommen werden
- Verschiedene ADX-Filterregeln oder -bedingungen können untersucht werden
Zusammenfassen
Die Strategie ermöglicht eine effektive Erfassung von Trendbewegungen durch eine effektive Kombination von Gleichgewichtstabellen und ADX. Auf der Grundlage weiterer Parameter- und Regeloptimierungen kann die Strategie bessere Rückkopplungen und reale Performance erzielen. Die Strategie ist für Strategieinvestoren geeignet, die Trendaktien handeln.
/*backtest
start: 2023-12-01 00:00:00
end: 2023-12-10 23:59:59
period: 1h
basePeriod: 15m
exchanges: [{"eid":"Futures_Binance","currency":"BTC_USDT"}]
*/

//@version=4
strategy(title="Ichimoku + ADX", shorttitle="Ichimoku & ADX Backtest", overlay=true)

//------------------------------
//------------------------------
// ICHIMOKU
//------------------------------
//------------------------------

conversionPeriods = input(9, minval=1, title="Conversion Line Periods"),
basePeriods = input(26, minval=1, title="Base Line Periods")
laggingSpan2Periods = input(52, minval=1, title="Lagging Span 2 Periods"),
displacement = input(26, minval=1, title="Displacement")

donchian(len) => avg(lowest(len), highest(len))

Tenkan = donchian(conversionPeriods)
Kijun = donchian(basePeriods)
SSA = avg(Tenkan, Kijun)
SSB = donchian(laggingSpan2Periods)

SSAdisp = SSA[displacement]
SSBdisp = SSB[displacement]

// Plot Ichimoku
// --------------------

plot(Tenkan, color=color.red, title="Tenkan")
plot(Kijun, color=color.blue, title="Kijun")
plot(close, offset = -displacement + 1, color=#459915, title="Chikou")


p1 = plot(SSA, offset = displacement - 1, color=color.green,
 title="Senkou A")
p2 = plot(SSB, offset = displacement - 1, color=color.red,
 title="Senkou B")
fill(p1, p2, color = SSA > SSB ? color.green : color.red)

//------------------------------
//------------------------------
// ADX
//------------------------------
//------------------------------

adxlen = input(14, title="ADX Smoothing")
dilen = input(14, title="DI Length")
keyLevel = input(23, title="key level for ADX")
dirmov(len) =>
	up = change(high)
	down = -change(low)
	truerange = rma(tr, len)
	plus = fixnan(100 * rma(up > down and up > 0 ? up : 0, len) / truerange)
	minus = fixnan(100 * rma(down > up and down > 0 ? down : 0, len) / truerange)
	[plus, minus]

adx(dilen, adxlen) =>
	[plus, minus] = dirmov(dilen)
	sum = plus + minus
	adx = 100 * rma(abs(plus - minus) / (sum == 0 ? 1 : sum), adxlen)
	[adx, plus, minus]

[sig, up, down] = adx(dilen, adxlen)

// Plot ADX
// --------------------

//plot(sig, color=color.black, title="ADX")
//plot(up, color=color.green, title="+DI",linewidth=2, style=plot.style_columns, transp=40)
//plot(down, color=color.red, title="-DI",linewidth=2, style=plot.style_columns, transp=40)
//plot(keyLevel, color=color.white, title="Key Level")


//------------------------------
//------------------------------
// STRATEGY
//------------------------------
//------------------------------

// Buy & Sell Signals
// --------------------

// ADX
ABuy1 = up > keyLevel and up - down >5 and sig > down and sig < keyLevel * 2
ASell1 = down > keyLevel and down - up >5 and sig > up and sig < keyLevel * 2


// ICHIMOKU

Bull = close >= max(SSAdisp, SSBdisp)
Bear = close <= min(SSAdisp, SSBdisp)

//  1. Bull
Buy1 = (close >= max(SSAdisp, SSBdisp)) ? 1 : 0
Buy2 = (Tenkan - Kijun >= 0.001) ? 1 : 0
Buy3 = SSA > SSB ? 1 : 0
Buy4 = sig > 20 ? 1 : 0
Buy4a = close - close[displacement] >=0.001 ? 1:0
Buy5 = Buy1 and Buy2 and Buy3 and Buy4 and Buy4a and not(Buy1[1] and Buy2[1] and Buy3[1])

//  1. Bear
Sell1 = (close <= min(SSAdisp, SSBdisp)) ? 1 : 0
Sell2 = (Kijun - Tenkan >= 0.001) ? 1 : 0
Sell3 = SSA < SSB ? 1 : 0
Sell4 = sig > 20 ? 1 : 0
Sell4a = close <= close[displacement]
Sell5 = Sell1 and Sell2 and Sell3 and Sell4 and Sell4a and not(Sell1[1] and Sell2[1] and Sell3[1])


// CONSOLIDATED

buysignal = Buy5
buyexitsignal = crossunder(close,Kijun)

sellsignal = Sell5
sellexitsignal = crossover(close,Kijun)

longCondition = buysignal
shortCondition = sellsignal

// Plot Indicators
// --------------------

// ----- Buy & Sell

//plotshape(longCondition, title = "Buy Signal", text ="BUY", textcolor =#FFFFFF , style=shape.labelup, size = size.tiny, location=location.belowbar, color = #1B8112, transp = 0)
//plotshape(shortCondition, title = "Short Signal", text ="SHORT", textcolor =#FFFFFF , style=shape.labeldown, size = size.tiny, location=location.abovebar, color = #000000, transp = 0)

// ----- Ichimoku Signals

//plotshape(Sell2, title = "Sell Signal", text ="Kumo Twist", textcolor =#FFFFFF , style=shape.labelup, size = size.tiny, location=location.top, color = color.black, transp = 0)
//plotshape(Sell3, title = "Sell Signal", text ="TK/KJ", textcolor =#FFFFFF , style=shape.labelup, size = size.tiny, location=location.bottom, color = color.black, transp = 0)

//plotshape(Buy4, title = "Buy Signal", text ="Kumo Twist", textcolor =#FFFFFF , style=shape.diamond, size = size.tiny, location=location.belowbar, color = color.blue, transp = 0)
//plotshape(Buy3, title = "Buy Signal", text ="TK/KJ", textcolor =#FFFFFF , style=shape.circle, size = size.tiny, location=location.abovebar, color = color.green, transp = 0)
//plotshape(Buy4, title = "Buy Signal", text ="TK/KJ", textcolor =#FFFFFF , style=shape.circle, size = size.tiny, location=location.belowbar, color = color.red, transp = 0)


//plotshape(buyexitsignal, title = "Buy Exit", style=shape.triangledown, size = size.tiny, location=location.abovebar, color = color.green, transp = 0)
//plotshape(sellexitsignal, title = "Buy Exit", style=shape.triangleup, size = size.tiny, location=location.belowbar, color = color.black, transp = 0)

//------------------------------
//------------------------------
// EXECUTION
//------------------------------
//------------------------------


// Test Range
// --------------------

// === INPUT BACKTEST RANGE ===
FromMonth = input(defval = 2, title = "From Month", minval = 1, maxval = 12)
FromDay   = input(defval = 1, title = "From Day", minval = 1, maxval = 31)
FromYear  = input(defval = 2015, title = "From Year", minval = 2017)
ToMonth   = input(defval = 1, title = "To Month", minval = 1, maxval = 12)
ToDay     = input(defval = 1, title = "To Day", minval = 1, maxval = 31)
ToYear    = input(defval = 9999, title = "To Year", minval = 2017)

// === FUNCTION EXAMPLE ===
start     = timestamp(FromYear, FromMonth, FromDay, 00, 00)  // backtest start window
finish    = timestamp(ToYear, ToMonth, ToDay, 23, 59)        // backtest finish window
window()  => true // create function "within window of time"

// Orders
// --------------------


if longCondition
    strategy.entry("Buy", strategy.long, when=window())

if buyexitsignal
    strategy.close("Buy")

if shortCondition
    strategy.entry("Sell", strategy.short, when=window())

if sellexitsignal
    strategy.close("Sell")