Momentumindikator und Angstindex-Crossover-Strategie
Erstellungsdatum:
2024-01-23 14:27:23
zuletzt geändert:
2024-01-23 14:27:23
Kopie:
3
Klicks:
665
1
konzentrieren Sie sich auf
1750
Anhänger
Überblick
Die Strategie beurteilt die Marktentwicklung durch die Berechnung der Kreuzung von Dynamik- und Panik-Indikatoren und sendet ein Verkaufssignal bei einer bestimmten Kreuzung der beiden Indikatoren aus, um einen starken Rückgang zu erfassen.
Strategieprinzip
- Berechnen Sie den 50-Zyklus-Dynamik-Indikator. Es zeigt die Veränderung des Preises gegenüber dem Zeitraum vor 50 Zyklen.
- Berechnen Sie die Korrektur des Panik-Index für 22 Zyklen. Es zeigt die Panik-Stimmung des Marktes durch das Verhältnis von Höchst- und Tiefpreisen.
- Wenn der Dynamikindikator den Panikindex unterbricht, zeigt dies, dass der Markt unter Druck steht.
- Wenn die Dynamik weiter in die Gefahrenzone fällt (zwischen 5 und 5), gibt es ein starkes Verkaufssignal.
Analyse der Stärken
- Der Panic Index, ein Indikator für die Stimmung am Markt, ist ein guter Indikator für strukturelle Veränderungen am Markt.
- Die Dynamik-Indikatoren können die Geschwindigkeit und Stärke der Preisänderungen beurteilen und helfen, die Markttrends zu beurteilen.
- Durch die Kombination zweier verschiedener Arten von Indikatoren kann die Genauigkeit der Identifizierung von Notfällen verbessert werden.
- Durch die Anpassung der Parameter kann man sich flexibel an unterschiedliche Marktumstände anpassen.
Risikoanalyse
- Die Kreuzung von Panik- und Dynamik-Indikatoren garantiert nicht, dass jedes Mal ein starker Rückgang eintritt. Die endgültige Entscheidung muss durch die Kombination anderer Indikatoren getroffen werden.
- Es gibt keine Stop-Loss-Einstellungen für den Verkauf, so dass die Verluste nicht effektiv kontrolliert werden können.
- Umkehrungen und Wiedereingänge werden nicht berücksichtigt. Die Strategie ist nur geeignet, um einen plötzlichen Rückgang zu erfassen.
Optimierungsrichtung
- Setzen Sie nach dem Verkauf einen Stop-Loss, um den Verlust zu kontrollieren.
- Um andere Kennzahlen zu erhöhen, erhöht sich die Zuverlässigkeit des Signals. Wie Transaktionsvolumen, Brinline usw.
- Die Erhöhung der Marktrückmeldungen ermöglicht die vollständige Umsetzung der Strategie in den langfristigen Zyklen.
- Optimierung der Parameter, um die optimale Parameterkombination zu finden.
Zusammenfassen
Die Strategie sendet eine Warnung vor einem Marktsturz durch eine Kreuzung von Dynamik- und Panik-Indikatoren. Sie kann einen plötzlichen Marktsturz effektiv erfassen. Die Strategie ist jedoch nur für Short-Line-Anwendungen geeignet, ohne Ausstiegsmechanismen und Risikokontrollen.
Strategiequellcode
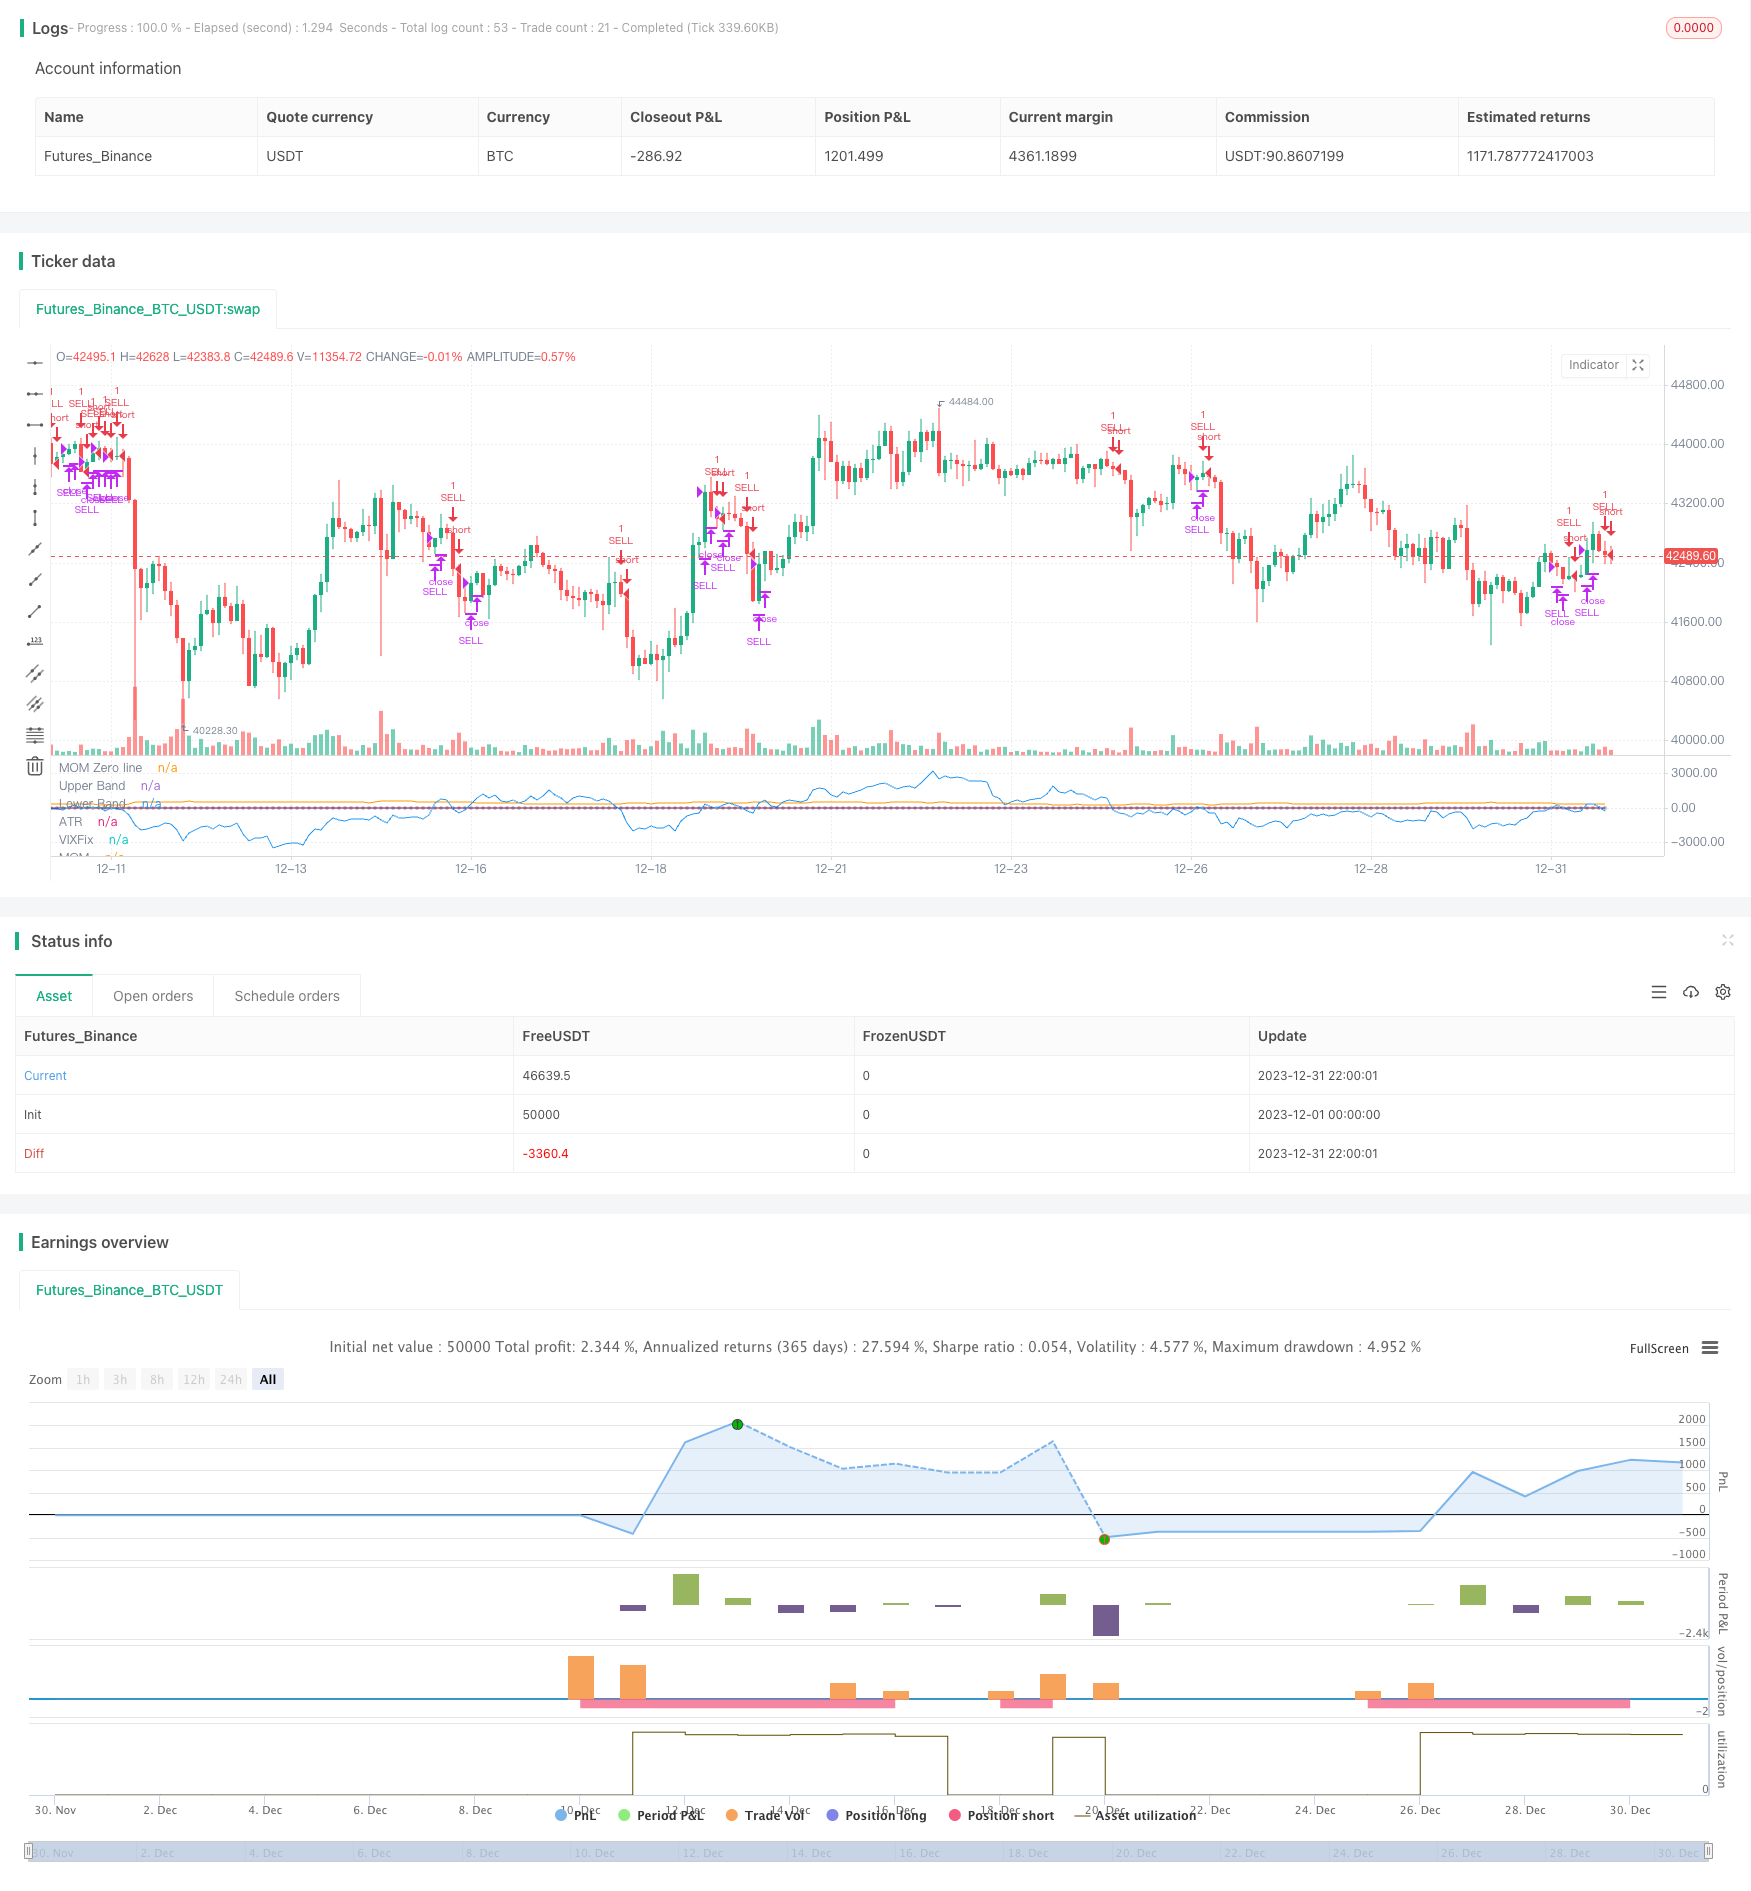
/*backtest
start: 2023-12-01 00:00:00
end: 2023-12-31 23:59:59
period: 2h
basePeriod: 15m
exchanges: [{"eid":"Futures_Binance","currency":"BTC_USDT"}]
*/

// This source code is subject to the terms of the Mozilla Public License 2.0 at https://mozilla.org/MPL/2.0/
// © gary_trades

//THIS SCRIPT HAS BEEN BUIL TO BE USED AS A S&P500 SPY CRASH INDICATOR (should not be used as a strategy).
//THIS SCRIPT HAS BEEN BUILT AS A STRATEGY FOR VISUALIZATION PURPOSES ONLY AND HAS NOT BEEN OPTIMISED FOR PROFIT.
//The script has been built to show as a lower indicator and also gives visual SELL signal on top when conditions are met. BARE IN MIND NO STOP LOSS, NOR ADVANCED EXIT STRATEGY HAS BEEN BUILT.
//As well as the chart SELL signal an alert has also been built into this script.
//The script utilizes a VIX indicator (marron line) and 50 period Momentum (blue line) and Danger/No trade zone(pink shading).
//When the Momentum line crosses down across the VIX this is a sell off but in order to only signal major sell offs the SELL signal only triggers if the momentum continues down through the danger zone.
//To use this indicator to identify ideal buying then you should only buy when Momentum line is crossed above the VIX and the Momentum line is above the Danger Zone.
//This is best used as a daily time frame indicator

//@version=4
strategy(title="S&P Bear Warning", shorttitle="Bear Warning" )

//Momentum
len = input(50, minval=1, title="Length")
src = input(close, title="Source")
bandUpper = input( 5)
bandLower = input(-5)
// ————— Control plotting of each signal. You could use the same technique to be able to turn acc/dist on/off.
showVixFix = input(true)
showMomentum = input(true)

mom = src - src[len]
myAtr = atr(14)
plot(showMomentum ? mom : na, color=color.blue, title="MOM")
plot(showMomentum ? 0 : na, color=color.silver, title="MOM Zero line", style=plot.style_circles, transp=100)
plot(showMomentum ? myAtr : na, color=color.orange, title="ATR", transp=90)

//VIX
VIXFixLength = input(22,title="VIX Fix Length")
VIXFix = (highest(close,VIXFixLength)-low)/(highest(close,VIXFixLength))*100
plot(showVixFix ? VIXFix : na, "VIXFix", color=color.maroon)

band1 = plot(showVixFix ? bandUpper : na, "Upper Band", color.red, 1, plot.style_line, transp=90)
band0 = plot(showVixFix ? bandLower : na, "Lower Band", color.red, 1, plot.style_line, transp=90)
fill(band1, band0, color=color.red, transp=85, title="Background")

//Identify Triggers
//Back Test Range
start = timestamp("America/New_York", 2000, 1, 1, 9,30)
end   = timestamp("America/New_York", 2020, 7, 1, 0, 0)

//Momentum
Long1 = mom > bandUpper
Short1 = mom < bandLower

//VIX
Long2  = crossover(mom, VIXFix)
Short2 = crossunder(mom, VIXFix)

//Warning Alert
SellAlert = Short1
alertcondition(SellAlert, title="Sell SPY", message="Warning Selling off {{ticker}}, price= {{close}}")

//Entry and Exit
if true
    strategy.entry("SELL", false, when = Short1)

strategy.close("SELL", when = Long2)