Quantitative Handelsstrategie basierend auf schnellem und langsamem gleitendem Durchschnitt
Überblick
Die Dual Moving Average Breakout Strategy ist eine quantitative Trading-Strategie, die auf schnellen und langsamen Moving Averages basiert. Sie verwendet zwei verschiedene Perioden des Index Moving Average (EMA) als Handelssignal. Ein Kaufsignal wird erzeugt, wenn der schnelle Moving Average den langsamen Moving Average durchbricht.
Strategieprinzip
Die Kernlogik der Strategie besteht darin, ein Handelssignal aus schnellen und langsamen Moving Averages zu erzeugen. Die Strategie definiert eine schnelle Moving Average-Periode von 12 Tagen und eine langsame Moving Average-Periode von 26 Tagen. Die Berechnungsmethode ist wie folgt:
- Berechnung eines Index-Moving-Mean-AP-Prozesses für eine Preis-Array mit einer Periode von 2 Tagen
- Berechnung des schnellen, beweglichen Durchschnitts auf der Grundlage des AP Fast mit einem Zeitraum von 12 Tagen
- Berechnung eines langsamen, beweglichen Durchschnitts auf Basis des AP Slow mit einem Zeitraum von 26 Tagen
- Vergleiche schneller und langsamer gleitender Mittelwert:
- Bei Fast und Slow gibt es mehrere Signale.
- Das Signal für den Luftkopf, wenn der Schnellkopf durch den Schnellkopf geht.
- Der Preis wird in Kombination mit der relativen Bewegung der Durchschnittslinie als ein bestimmtes Handelssignal bewertet:
- Mehrkopfsignal: Schnell > Langsam && AP > Schnell
- Das Hohlkopfsignal: Fast
Eine typische Dual Moving Average Strategie besteht darin, Markttrends zu beurteilen und Handelssignale zu erzeugen, indem ein Kreuzung von Fast Moving Average und Slow Moving Average durchgeführt wird.
Analyse der Stärken
Die Dual-Moving-Equilibrium-Breakthrough-Strategie hat folgende Vorteile:
- Die Strategie ist klar und einfach zu verstehen und umzusetzen.
- Durch die Anpassung der Moving Average-Periode an unterschiedliche Marktumstände
- Sie können gleichzeitig mehr Kaufleisten machen, um höhere Gewinne zu erzielen
- Die Kombination von Preisen mit einer beweglichen Gewinnlinie ermöglicht ein genaueres Handelssignal.
- Die mobile Durchschnittslinie hat eine gewisse Verzögerung und kann effektiv Marktlärm beseitigen.
Risikoanalyse
Die Strategie der doppelten beweglichen Durchschnittslinie birgt auch Risiken:
- Wenn die Märkte im Umbruch sind, gibt es mehr falsche Signale.
- Die doppelte bewegliche Mittellinienstrategie ist anfällig für Kurvenanpassung und ignoriert strukturelle Veränderungen des Marktes.
- Einfach auf technische Indikatoren angewiesen, ist anfällig für False Breaks und riskiert Verluste
Die Lösung:
- Optimierung der Periodizität der Moving Average, um sie besser an die aktuelle Marktlage anzupassen
- In Kombination mit anderen Indikatoren wie dem Signal zur Bestätigung des Umsatzes, um falsche Durchbrüche zu vermeiden
- Trend-Tracking-Strategien zur Steuerung von Gewinn- und Verlustquoten und zur Risikominderung
Optimierungsrichtung
Die Dual-Moving-Equilibrium-Breakthrough-Strategie kann in folgenden Bereichen optimiert werden:
- Suche nach einer geeigneteren Moving Average Cycle-Palette, um sich an veränderte Märkte anzupassen
- Signalfilterung durch Kennzahlen wie Erhöhung der Transaktionsmenge, um die Effektivität von Handelssignalen zu gewährleisten
- Kombination von Marktstrukturindikatoren, Trenderkennung und Anpassung der mittleren Periodenparameter
- Dynamische Moving Averages, die sich automatisch an Marktveränderungen anpassen
- Ein Stop-Loss-Strategien, um Risiken zu kontrollieren und Geld zu schützen
Zusammenfassen
Die Dual Moving Average Breakout Strategie ist eine einfache und praktische Quantifizierungsstrategie. Sie hat die Vorteile, dass die Strategie logisch einfach und leicht umzusetzen ist, aber auch einige Probleme mit der Marktadaptibilität. Wir können sie durch Parameteroptimierung, Signalfilterung und Risikokontrolle zu einem stabilen und profitablen Handelssystem machen.
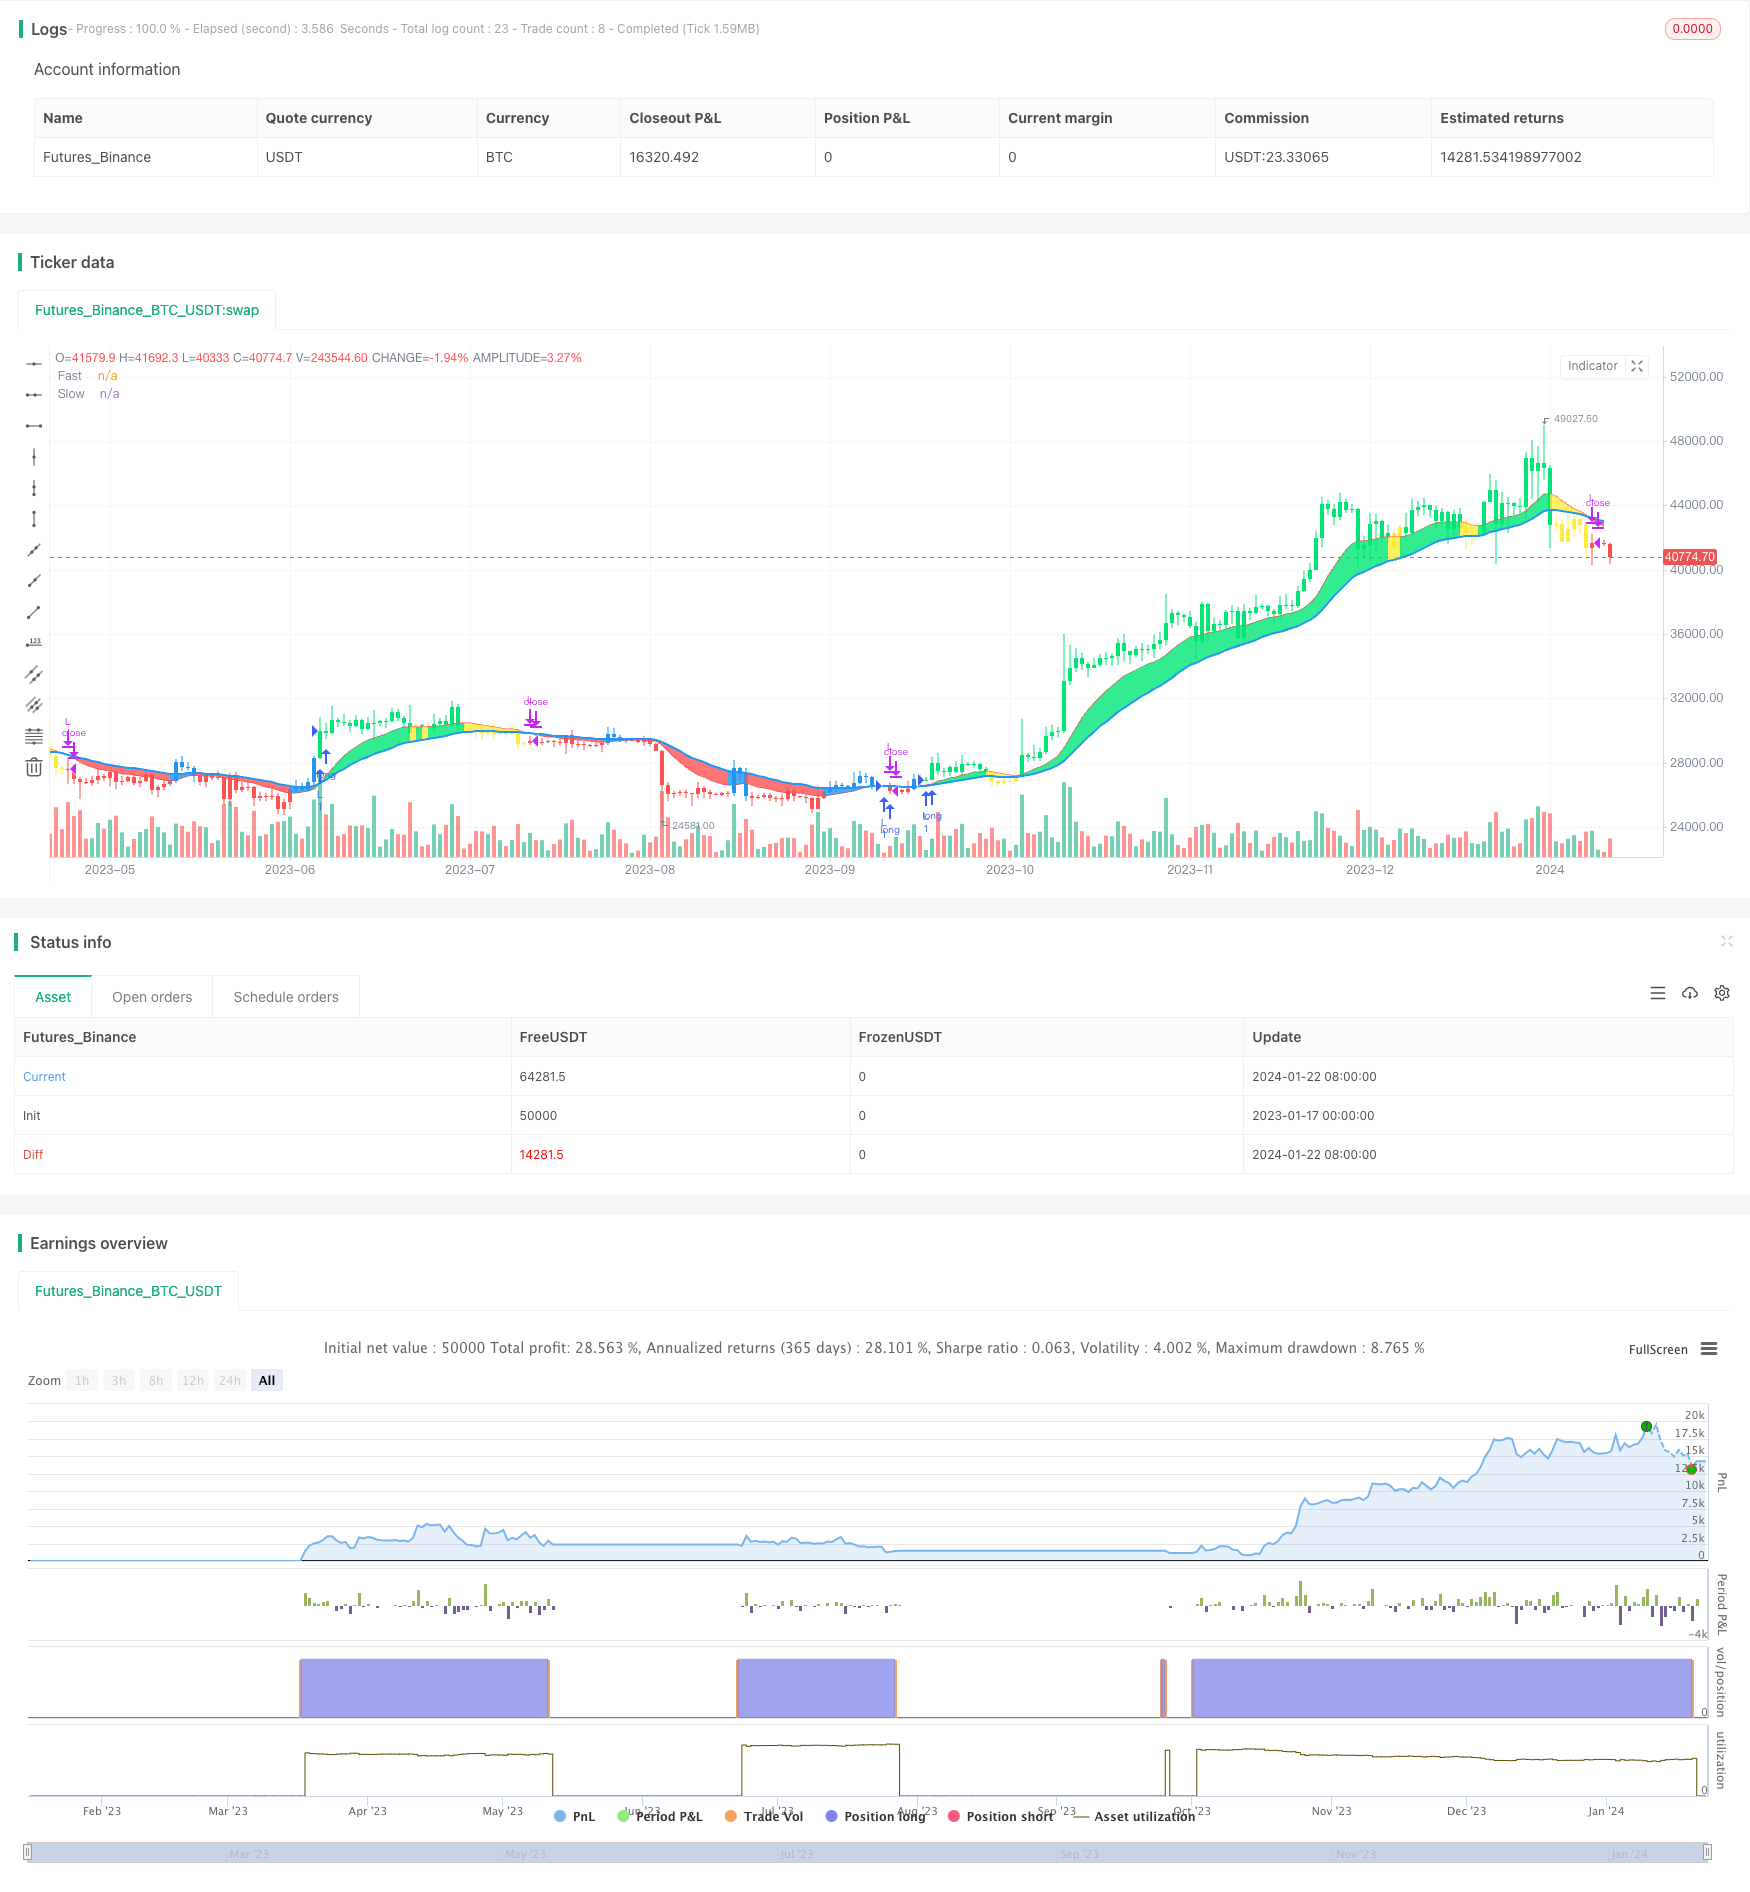
/*backtest
start: 2023-01-17 00:00:00
end: 2024-01-23 00:00:00
period: 1d
basePeriod: 1h
exchanges: [{"eid":"Futures_Binance","currency":"BTC_USDT"}]
*/

//@version=4
strategy("CDC Action Zone V.2", overlay=true)

// CDC ActionZone V2 29 Sep 2016
// CDC ActionZone is based on a simple 2MA and is most suitable for use with medium volatility market
// 11 Nov 2016 : Ported to Trading View with minor UI enhancement
LSB = input(title="Long/Short", defval="Long only", options=["Long only", "Short only" , "Both"])
src = input(title="Data Array",type=input.source,defval=ohlc4)
prd1=input(title="Short MA period", type=input.integer,defval=12)
prd2=input(title="Long MA period",type=input.integer,defval=26)
AP = ema(src,2)
Fast = ema(AP,prd1)
Slow = ema(AP,prd2)


Bullish = Fast>Slow
Bearish = Fast<Slow

Green = Bullish and AP>Fast
Red = Bearish and AP<Fast
Yellow = Bullish and AP<Fast
Blue = Bearish and AP>Fast

Buy = Bullish and Bearish[1]
Sell = Bearish and Bullish[1]


alertcondition(Buy,"Buy Signal","Buy")
alertcondition(Sell,"Sell Signal","Sell")


//Plot

l1=plot(Fast,"Fast", linewidth=1,color=color.red)
l2=plot(Slow,"Slow", linewidth=2,color=color.blue)
bcolor = Green ? color.lime : Red ? color.red : Yellow ? color.yellow : Blue ? color.blue : na
barcolor(color=bcolor)
fill(l1,l2,bcolor)

// === INPUT BACKTEST RANGE ===
FromYear  = input(defval = 2000, title = "From Year", minval = 1920)
FromMonth = input(defval = 1, title = "From Month", minval = 1, maxval = 12)
FromDay   = input(defval = 1, title = "From Day", minval = 1, maxval = 31)
ToYear    = input(defval = 9999, title = "To Year", minval = 1921)
ToMonth   = input(defval = 12, title = "To Month", minval = 1, maxval = 12)
ToDay     = input(defval = 31, title = "To Day", minval = 1, maxval = 31)

// === FUNCTION EXAMPLE ===
start     = timestamp(FromYear, FromMonth, FromDay, 00, 00)  // backtest start window
finish    = timestamp(ToYear, ToMonth, ToDay, 23, 59)        // backtest finish window
window()  => true // create function "within window of time"


if LSB == "Long only" and Buy and window()
    strategy.entry("L",true)
if LSB == "Long only" and Sell and window()
    strategy.close("L",qty_percent=100,comment="TP Long")
if LSB == "Both" and Buy and window()
    strategy.entry("L",true)
if LSB == "Both" and Sell and window()
    strategy.entry("S",false)
if LSB == "Short only" and Sell and window()
    strategy.entry("S",false)
if LSB == "Short only" and Buy and window()
    strategy.close("S",qty_percent=100,comment="TP Short")