Trendfolgestrategie für Rohöl basierend auf dem ADX-Indikator
Überblick
Diese Strategie basiert auf Kevin Davey’s Strategie für den freien Handel mit Rohöl-Futures. Die Strategie nutzt die ADX-Indikatoren, um die Entwicklung des Rohölmarktes zu beurteilen, und kombiniert die Prinzipien des Preisbruchs, um eine einfache und praktische Strategie für den automatischen Handel mit Rohöl zu erreichen.
Strategieprinzip
- Berechnung des ADX-Wertes für 14 Zyklen
- Wenn der ADX > 10 ist, ist der Trend zu erkennen
- Wenn der Schlusskurs höher ist als der Schlusskurs vor der 65er K-Linie, zeigt dies einen Preisbruch an, der als Long-Position-Signal bezeichnet wird
- Wenn der Schlusskurs niedriger ist als der Schlusskurs vor der 65er K-Linie, zeigt dies einen Preisbruch an, der als Short-Signal gilt.
- Nach der Einfahrt setzte man Stop Loss und Stop Stop.
Die Strategie basiert hauptsächlich auf dem Trendverständnis des ADX-Indikators und erzeugt Handelssignale in Bezug auf Preisbrüche in festen Phasen. Die gesamte Strategie-Logik ist sehr einfach und klar.
Strategische Stärkenanalyse
- Mit ADX können Sie Trends beurteilen, um keine verpassten Trendchancen zu vermeiden
- Der Preisbruch in der Fixed-Cycle-Periode signalisiert eine bessere Rückmessung
- Der Code ist intuitiv, einfach zu verstehen und zu ändern
- Kevin Davey hat über viele Jahre hinweg in der Praxis getestet, dass es sich nicht um eine Kurvenübereinstimmung handelt.
Strategische Risikoanalyse
- ADX als primärer Indikator, sensibel für Parameter-Selektion und Durchbruch-Zyklus-Selektion
- Ein Durchbruch in die Fix-Cycle könnte einige Gelegenheiten verpassen
- Unzureichende Einstellung der Stop-Loss-Sperre kann zu einem erhöhten Verlust führen
- Mögliche Abweichungen zwischen Festplatten- und Rückmessungseffekten
Richtung der Strategieoptimierung
- Optimierung von ADX-Parametern und Durchbruchzyklen
- Erhöhung der dynamischen Anpassung der Positionsmenge
- Die Strategie wird nach Rückmeldungen und Praxisprüfungen weiterentwickelt und verbessert
- Strategische Optimierung durch Einsatz von Machine Learning und Deep Learning
Zusammenfassen
Diese Strategie ist insgesamt eine sehr praktische Rohölhandelsstrategie. Sie nutzt die ADX-Indikatoren, um Trends zu beurteilen, ist sehr vernünftig, die Preisbruchprinzipien sind einfach und wirksam, und die Rückmessung wirkt gut. Als öffentlich freie Strategie von Kevin Davey hat sie eine starke praktische Zuverlässigkeit. Obwohl es Raum für einige Verbesserungen gibt, ist diese Strategie für Anfänger und kleine Kapitalhändler eine sehr geeignete Einstiegs- und praktische Option.
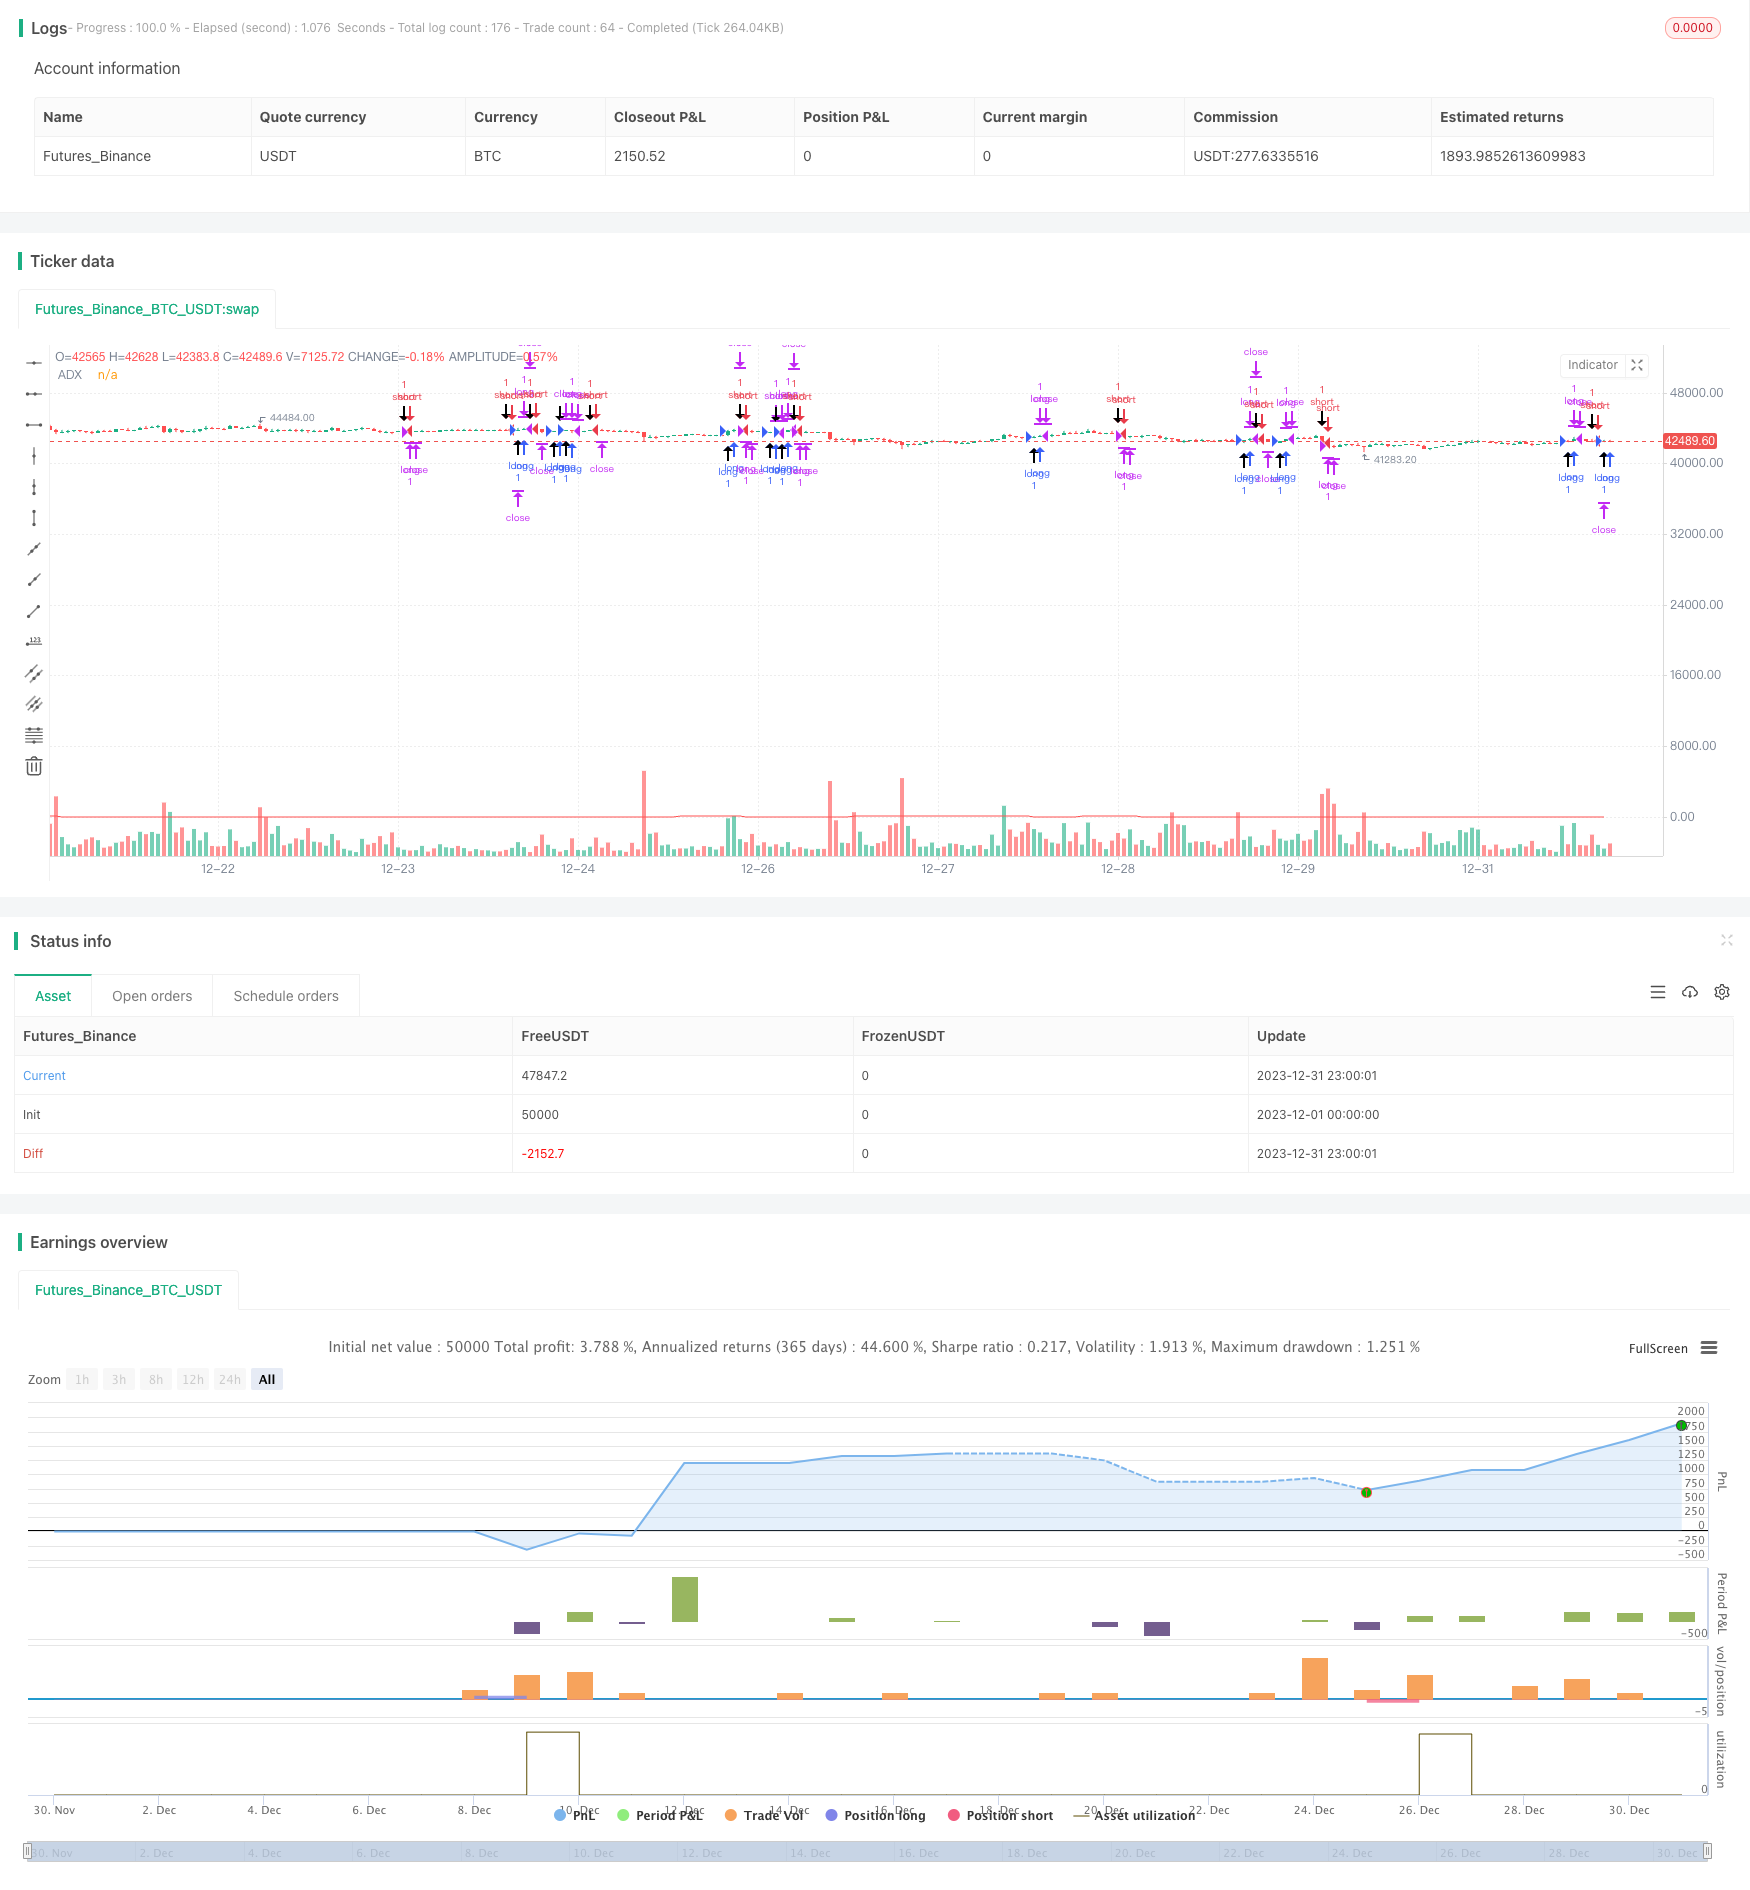
/*backtest
start: 2023-12-01 00:00:00
end: 2023-12-31 23:59:59
period: 1h
basePeriod: 15m
exchanges: [{"eid":"Futures_Binance","currency":"BTC_USDT"}]
*/

// Strategy idea coded from EasyLanguage to Pinescript
//@version=5
strategy("Kevin Davey Crude free crude oil strategy", shorttitle="CO Fut", format=format.price, precision=2, overlay = true, calc_on_every_tick = true)
adxlen = input(14, title="ADX Smoothing")
dilen = input(14, title="DI Length")
dirmov(len) =>
	up = ta.change(high)
	down = -ta.change(low)
	plusDM = na(up) ? na : (up > down and up > 0 ? up : 0)
	minusDM = na(down) ? na : (down > up and down > 0 ? down : 0)
	truerange = ta.rma(ta.tr, len)
	plus = fixnan(100 * ta.rma(plusDM, len) / truerange)
	minus = fixnan(100 * ta.rma(minusDM, len) / truerange)
	[plus, minus]
adx(dilen, adxlen) =>
	[plus, minus] = dirmov(dilen)
	sum = plus + minus
	adx = 100 * ta.rma(math.abs(plus - minus) / (sum == 0 ? 1 : sum), adxlen)
sig = adx(dilen, adxlen)
plot(sig, color=color.red, title="ADX")

buy = sig > 10 and (close - close[65]) > 0 and (close - close[65])[1] < 0
sell = sig > 10 and (close - close[65]) < 0 and (close - close[65])[1] > 0

plotshape(buy, style = shape.arrowup, location = location.belowbar,size = size.huge)
plotshape(sell, style = shape.arrowdown, location = location.abovebar,size = size.huge)

if buy
	strategy.entry("long", strategy.long)
if sell
	strategy.entry("short", strategy.short)

if strategy.position_size != 0
	strategy.exit("long", profit = 450, loss = 300)
	strategy.exit("short", profit = 450, loss = 300)


// GetTickValue() returns the currency value of the instrument's
// smallest possible price movement.
GetTickValue() =>
    syminfo.mintick * syminfo.pointvalue

// On the last historical bar, make a label to display the
// instrument's tick value
if barstate.islastconfirmedhistory
    label.new(x=bar_index + 1, y=close, style=label.style_label_left,
         color=color.black, textcolor=color.white, size=size.large,
         text=syminfo.ticker + " has a tick value of:\n" +
             syminfo.currency + " " + str.tostring(GetTickValue()))