Trendfolgestrategie basierend auf DMI und RSI
Übersicht
Diese Strategie kombiniert die DMI-Anzeige, die die Richtung der Tendenz bestimmt, und die RSI-Anzeige, die den Überkauf überkauft, um eine vollständige Trend-Folge-Handelsstrategie zu erreichen. Wenn die DMI-Anzeige eine Tendenz beurteilt und der RSI-Anzeige überkauft oder überkauft, wird entsprechend über- oder kurz gehandelt. Gleichzeitig wird ein beweglicher Stop-Loss eingerichtet, um Gewinne zu sperren.
Grundlagen der Strategie
- Trends mit dem DMI-Indikator
- Der DMI besteht aus drei Kurven: +DI zeigt den Aufwärtstrend, -DI zeigt den Abwärtstrend, ADX beurteilt die Stärke des Trends
- Wenn + DI> -DI ist ein Aufwärtstrend, machen Sie mehr; wenn -DI> + DI ist ein Abwärtstrend, machen Sie kurz
- Überkaufen und Überverkaufen anhand des RSI
- Der RSI beurteilt überkauft oder überverkauft durch den Vergleich von durchschnittlichen Schlusspitzen und Schlusspannen über einen Zeitraum
- RSI unter 30 ist Überverkauf, über 70 ist Überkauf
- In Kombination mit dem DMI, der die Richtung des Trends beurteilt, und dem RSI, der überkauft und überverkauft, kann man die Marktdynamik besser erfassen
- Wenn der DMI einen Aufwärtstrend beurteilt und der RSI überkauft, ist es besser, mehr Zeit zu verbringen
- Wenn der DMI einen Abwärtstrend beurteilt und der RSI überkauft, ist dies ein guter Zeitpunkt für einen Leerverkauf.
- Setzen Sie einen beweglichen Stop-Loss, um Gewinne zu sichern
Analyse der Stärken
Dies ist eine eher ausgereifte, stabile Trendfollow-Strategie mit folgenden Vorteilen:
- Vermeiden Sie häufige Geschäfte in unruhigen Märkten, indem Sie Trendbeurteilung und Überkauf-Überverkauf-Beurteilung kombinieren
- Die Verwendung der populären Indikatoren DMI und RSI, Parameter-Auswahl ist einfach, die Praxis zu überprüfen
- Die Einrichtung eines beweglichen Stop-Losses, um Gewinne zu sperren, kann Stop-Losses bis zu einem gewissen Grad vermeiden
- Regeln sind klar und verständlich, Prozesse sind einfach zu implementieren und leicht umzusetzen.
Risikoanalyse
Die Strategie birgt auch einige Risiken, die beachtet werden müssen:
- DMI und RSI sind beide leicht zu falschen Signalen, die zu unnötigen Verlusten führen können
- Die falsche Einstellung des mobilen Stopps kann zu früh oder zu stark stoppen
- Die Schwingungen können nicht wirksam gefiltert werden und können leicht eingeschlossen werden.
- Die Trendstrategie kann bei einem Trendwechsel nicht zum Stillstand gebracht werden
Optimierungsrichtung
Die Strategie kann auch in folgenden Bereichen optimiert werden:
- Schwankungen in Verbindung mit den Fluktuationsindikatoren
- Vermeiden Sie falsche Durchbrüche in Kombination mit Candle-Form-Beschlüsse
- Setzen Sie eine angemessene Stop-Loss-Grenze in der Nähe von wichtigen Unterstützungswiderstandspositionen
- Trends bei der Ermittlung von Machine-Learning-Modellen
- Parameter für die dynamische Optimierung von DMI und RSI
Zusammenfassung Diese Strategie ist insgesamt eine eher stabile und praktische Trend-Follow-Strategie, die die Richtung des Trends durch DMI beurteilt, die RSI überkaufen und überverkaufen, um die Handelschancen der mittleren Linien zu erfassen. Die Strategie hat eine einfache Parameterwahl, die Handelsregeln sind klar und einfach zu praktizieren.
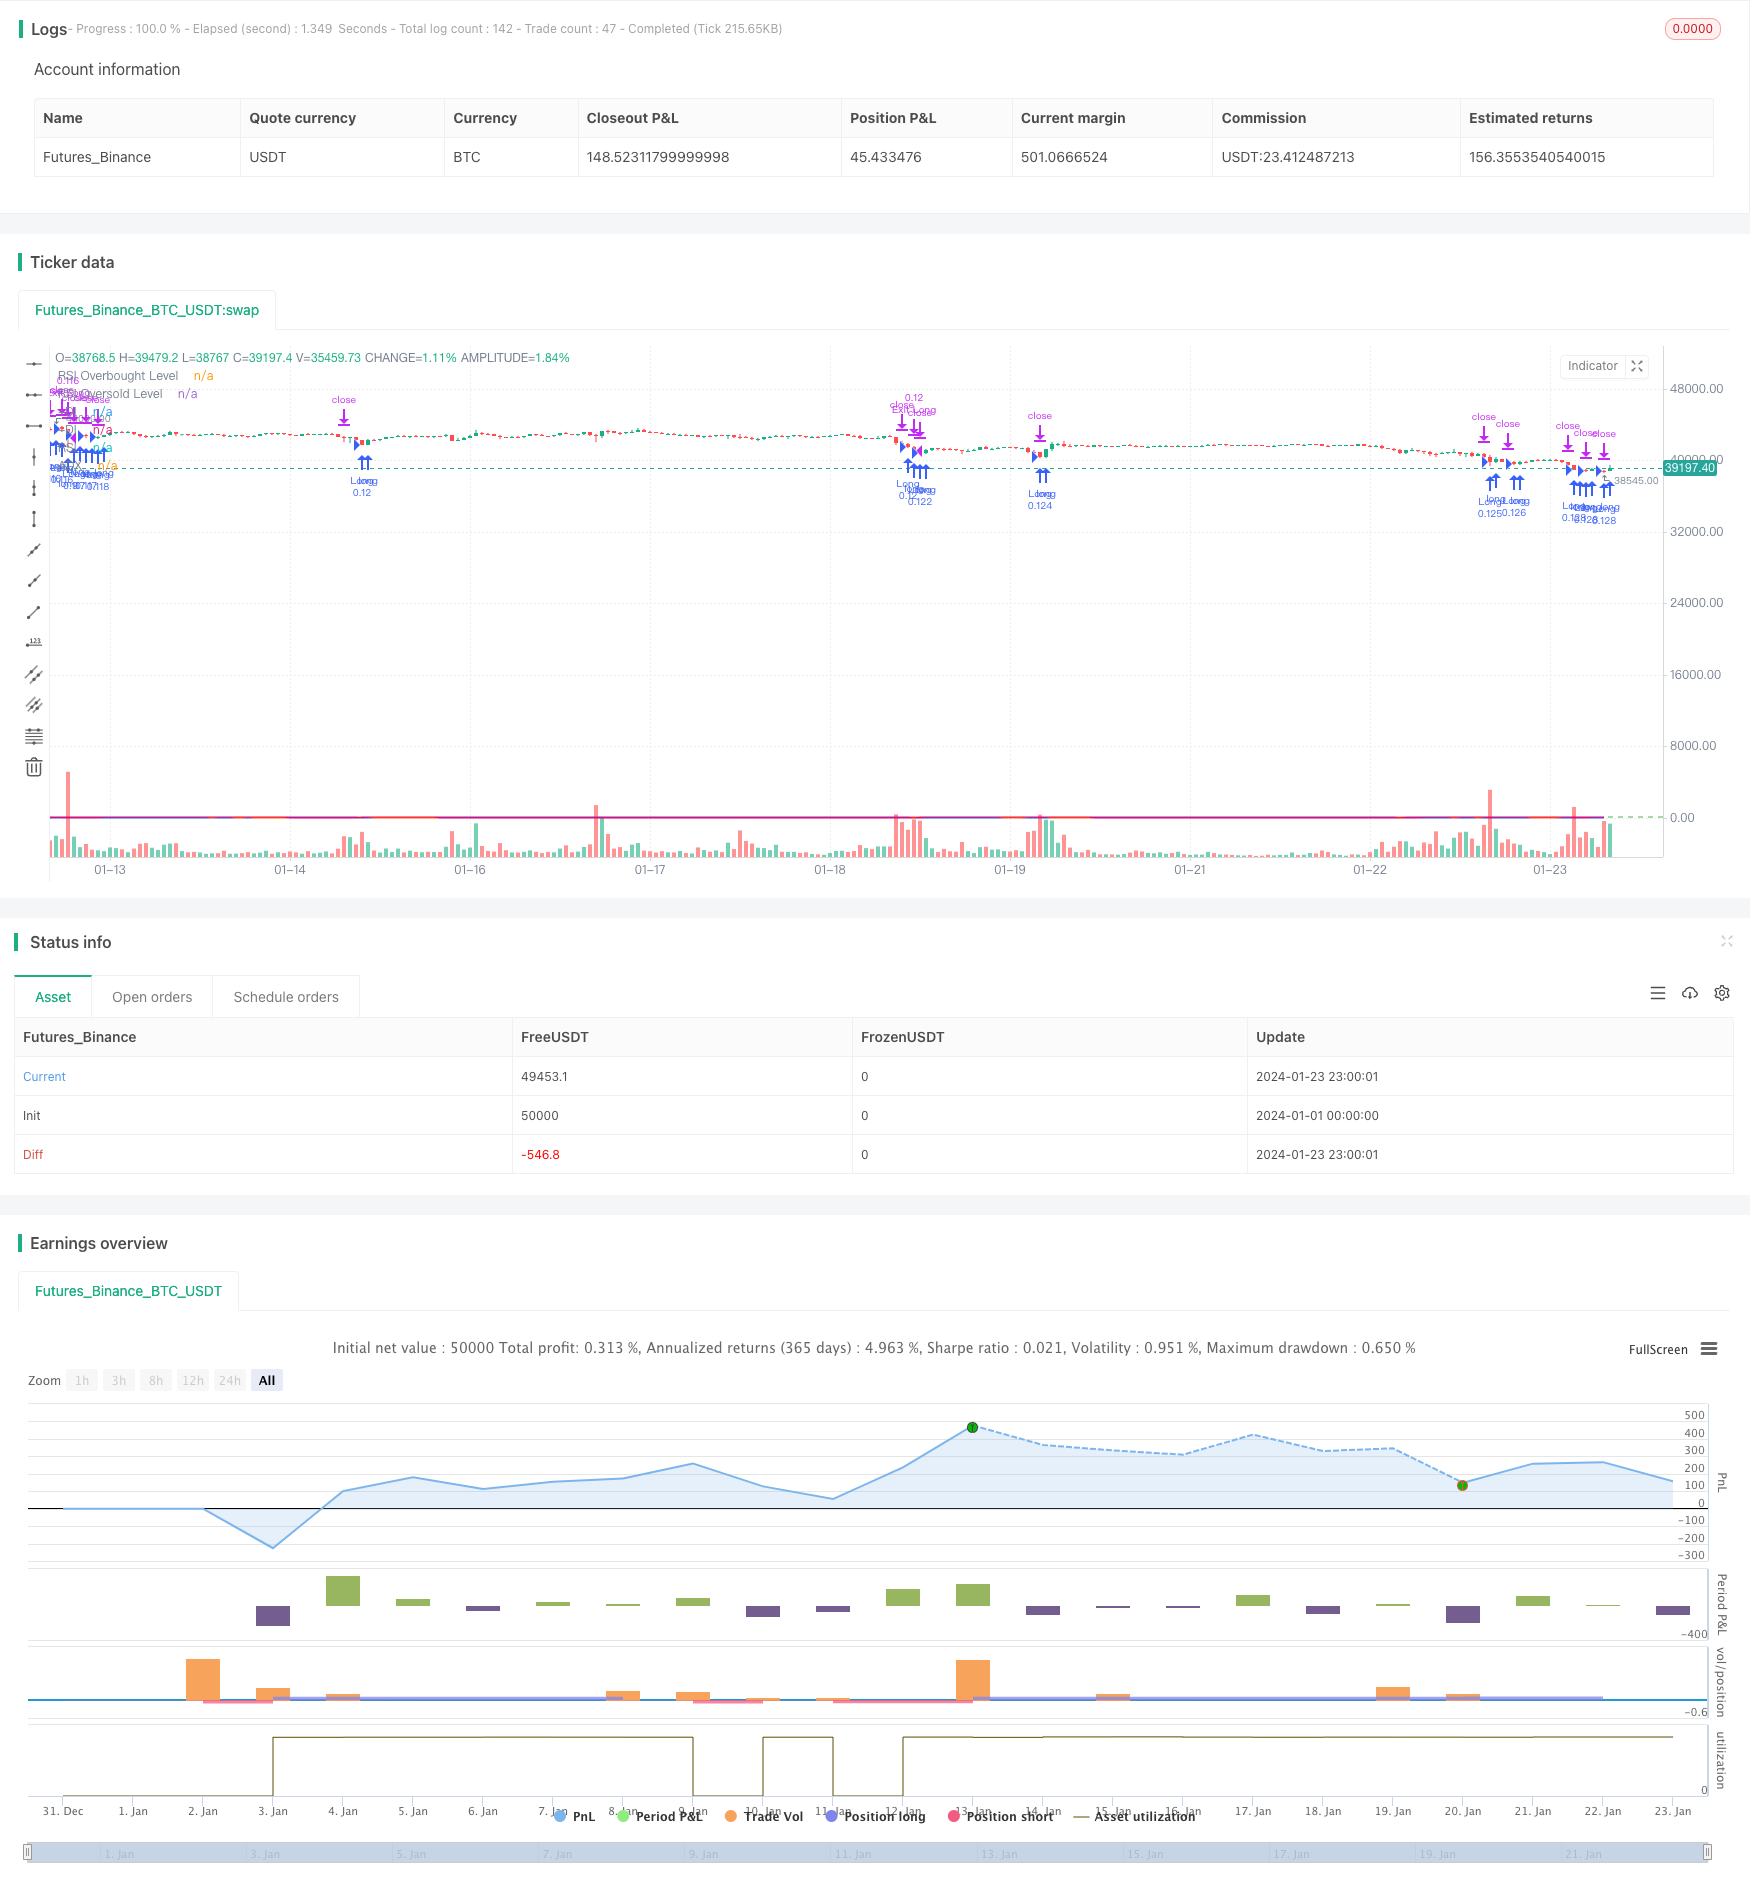
/*backtest
start: 2024-01-01 00:00:00
end: 2024-01-24 00:00:00
period: 1h
basePeriod: 15m
exchanges: [{"eid":"Futures_Binance","currency":"BTC_USDT"}]
*/

// This Pine Script™ code is subject to the terms of the Mozilla Public License 2.0 at https://mozilla.org/MPL/2.0/
// © YingYangJPN

//@version=5
strategy("DMI and RSI Strategy", overlay=true, initial_capital=10000, default_qty_type=strategy.percent_of_equity, default_qty_value=10)

// DMI indikatörünü tanımlayalım
lensig = input.int(14, title="ADX Smoothing", minval=1, maxval=50)
len = input.int(14, minval=1, title="DI Length")
up = ta.change(high)
down = -ta.change(low)
plusDM = na(up) ? na : (up > down and up > 0 ? up : 0)
minusDM = na(down) ? na : (down > up and down > 0 ? down : 0)
trur = ta.rma(ta.tr, len)
plus = fixnan(100 * ta.rma(plusDM, len) / trur)
minus = fixnan(100 * ta.rma(minusDM, len) / trur)
sum = plus + minus
adx = 100 * ta.rma(math.abs(plus - minus) / (sum == 0 ? 1 : sum), lensig)
trailing_stop_loss_factor = input.float(0.50, "Trailing Stop Loss Factor", step = 0.01)

// RSI indikatörünü tanımlayalım
rsiLength = input.int(14, minval=1, title="RSI Length")
rsiSource = input(close, title="RSI Source")
rsiOverbought = input.int(70, title="RSI Overbought Level")
rsiOversold = input.int(30, title="RSI Oversold Level")
rsiValue = ta.rsi(rsiSource, rsiLength)

// Uzun pozisyon açma koşullarını tanımlayalım
longCondition1 = rsiValue < rsiOversold // RSI oversold seviyesinin altındaysa
longCondition2 = adx > 20 // ADX 20'den büyükse
longCondition3 = minus > plus

// Kısa pozisyon açma koşullarını tanımlayalım
shortCondition1 = rsiValue > rsiOverbought // RSI overbought seviyesinin üstündeyse
shortCondition2 = adx > 20 // ADX 20'den büyükse
shortCondition3 = plus > minus

// Uzun pozisyon açalım
if longCondition1 and longCondition2 and longCondition3
    strategy.entry("Long", strategy.long)


// Kısa pozisyon açalım
if shortCondition1 and shortCondition2 and shortCondition3
    strategy.entry("Short", strategy.short)

// Trailing Stop Loss
longTrailingStopLoss = strategy.position_avg_price * (1 - trailing_stop_loss_factor / 100)
shortTrailingStopLoss = strategy.position_avg_price * (1 + trailing_stop_loss_factor / 100)
if strategy.position_size > 0
    strategy.exit("Exit Long", "Long", stop  = longTrailingStopLoss)
if strategy.position_size < 0
    strategy.exit("Exit Short", "Short", stop = shortTrailingStopLoss)

// DMI ve RSI indikatörlerini grafiğe çizelim
plot(adx, color=#F50057, title="ADX")
plot(plus, color=#2962FF, title="+DI")
plot(minus, color=#FF6D00, title="-DI")
plot(rsiValue, color=#9C27B0, title="RSI")
hline(rsiOverbought, title="RSI Overbought Level", color=#E91E63, linestyle=hline.style_dashed)
hline(rsiOversold, title="RSI Oversold Level", color=#4CAF50, linestyle=hline.style_dashed)