Trendfolgestrategie mit dem Doppelumkehroszillator
Überblick
Die Doppel-Reversal-Chaos-Band-Trend-Tracking-Strategie ermöglicht den Trend-Tracking-Handel durch die Kombination von Doppel-Reversal-Signalen und Reversal-Band-Indikatoren. Sie verwendet zunächst 123 Reversal-Systeme, um Reversal-Signale zu erzeugen, und kombiniert diese dann mit den Fractal Chaos Bands-Indikatoren, um die Trend-Tracking-Signal zu filtern. Die Strategie identifiziert sowohl Reversal-Gelegenheiten als auch Trends und ist eine sehr umfassende Handelsstrategie.
Strategieprinzip
123 Umkehrung
Das 123 Reverse System stammt von Ulf Jensen und ist auf Seite 183 in seinem Buch “Wie ich dreifache Gewinne am Futures-Markt erzielen kann” enthalten. Sein Handelssignal lautet:
Wenn der Schlusskurs 2 Tage in Folge höher als der Schlusskurs des Vortages ist und die Slow K-Linie am 9. Tag unter 50 liegt, machen Sie einen Plus; wenn der Schlusskurs 2 Tage in Folge niedriger als der Schlusskurs des Vortages ist und die Fast K-Linie am 9. Tag über 50 liegt, machen Sie einen Minus.
Der Stochastic-Oscillator-Indikator wird hauptsächlich genutzt, um Signale in überkauften und überverkauften Bereichen zu erzeugen. Wenn die Aktien kontinuierlich steigen, aber der Stochastic-Oscillator-Indikator zeigt, dass es noch mehr Raum zum Steigen gibt, wird eine Beobachtungsstrategie angewandt.
Fractal Chaos Bands-Indikator
Der Fractal Chaos Bands Indikator beurteilt Markttrends, indem er die Höchst- und Tiefpunkte der Aktienpreise aufzeichnet, die Ober- und Unterbahn bilden. Die spezifischen Regeln sind:
Wenn die Preise steigen, brechen Sie die Spur; wenn die Preise fallen, brechen Sie die Spur.
Dieser Teil dient hauptsächlich als Trendfilter und wird in Kombination mit dem 123-Umkehrsignal verwendet. Die Position wird nur eröffnet, wenn die beiden Signale übereinstimmen.
Strategische Vorteile
- Umkehrungen und Trends, um Chancen zu nutzen
Dual Reverse Shockband Trend-Tracking-Strategie, die sowohl Reversal-Gelegenheiten als auch Trend-Tracking erfasst. Sie ist sehr umfassend. Sie erhält Handelssignale, unabhängig davon, ob sich der Markt in einem Schock- oder Trendzustand befindet.
- Weniger Falschmeldungen, mehr Gewinnraten
Im Vergleich zu einem einzigen Indikator kann die Strategie durch die Kombination von Doppelindikatoren gefiltert werden, was die Falschsignale erheblich reduziert und die Gewinn- und Gewinnrate des tatsächlichen Handels erhöht.
- Flexibel und anpassungsfähig
Die Parameter der Trend-Tracking-Strategie für die Doppel-Umkehrschwingung sind gut verstanden, die Benutzer können sich an ihre eigenen Bedürfnisse und die Marktumgebung anpassen. Sie sind sehr flexibel.
Risiko und Optimierung
- Die große Tendenz, sich nicht anpassen zu können
Die Strategie selbst ist eher auf kurz- und mittellange Handelsmöglichkeiten angewiesen. Unter großen Markttrends kann die Strategie zu viele Umkehrsignale erzeugen und den Ausgang beeinträchtigen. Dies kann durch Parameteranpassungen optimiert werden.
- Die Notwendigkeit für Marginalfinanzierung
Die Trend-Tracking-Strategie der doppelten Reverse-Shock-Band-Strategie gehört zu den häufigen Handelsarten, bei denen ausreichend Marginalkapital benötigt wird, um die Notwendigkeit einer Lagersicherung zu unterstützen. Für Benutzer, die nicht über ausreichende Mittel verfügen, kann eine angemessene Verkleinerung der Position erforderlich sein.
- Filter für weitere Indikatoren
Die Strategie kann auf der vorhandenen Grundlage, die Einführung von mehr verschiedenen Arten von Indikatoren, um die Signalquelle zu bereichern und die Stabilität der Strategie zu verbessern. Zum Beispiel die Hinzufügung von Quantitätsindikatoren, Schwankungsrate-Indikatoren und so weiter, um die Umkehrung und Trendsignale zu überprüfen.
Zusammenfassen
Die Doppel-Umkehr-Schock-Band-Trend-Tracking-Strategie kombiniert erfolgreich die Vorteile des Umkehrhandels und des Trend-Trackings, kann sowohl Umkehrungen erfassen als auch Trends folgen und ist sehr umfassend und effizient. Im Vergleich zu einem einzigen Indikator kann sie die Falschsignale erheblich reduzieren und die Gewinnrate und die Gewinnniveaus des tatsächlichen Handels verbessern. Darüber hinaus ist die Strategie flexibel in Bezug auf die Parameter und kann von Benutzern entsprechend ihrem eigenen Stil und der Marktumgebung optimiert werden.
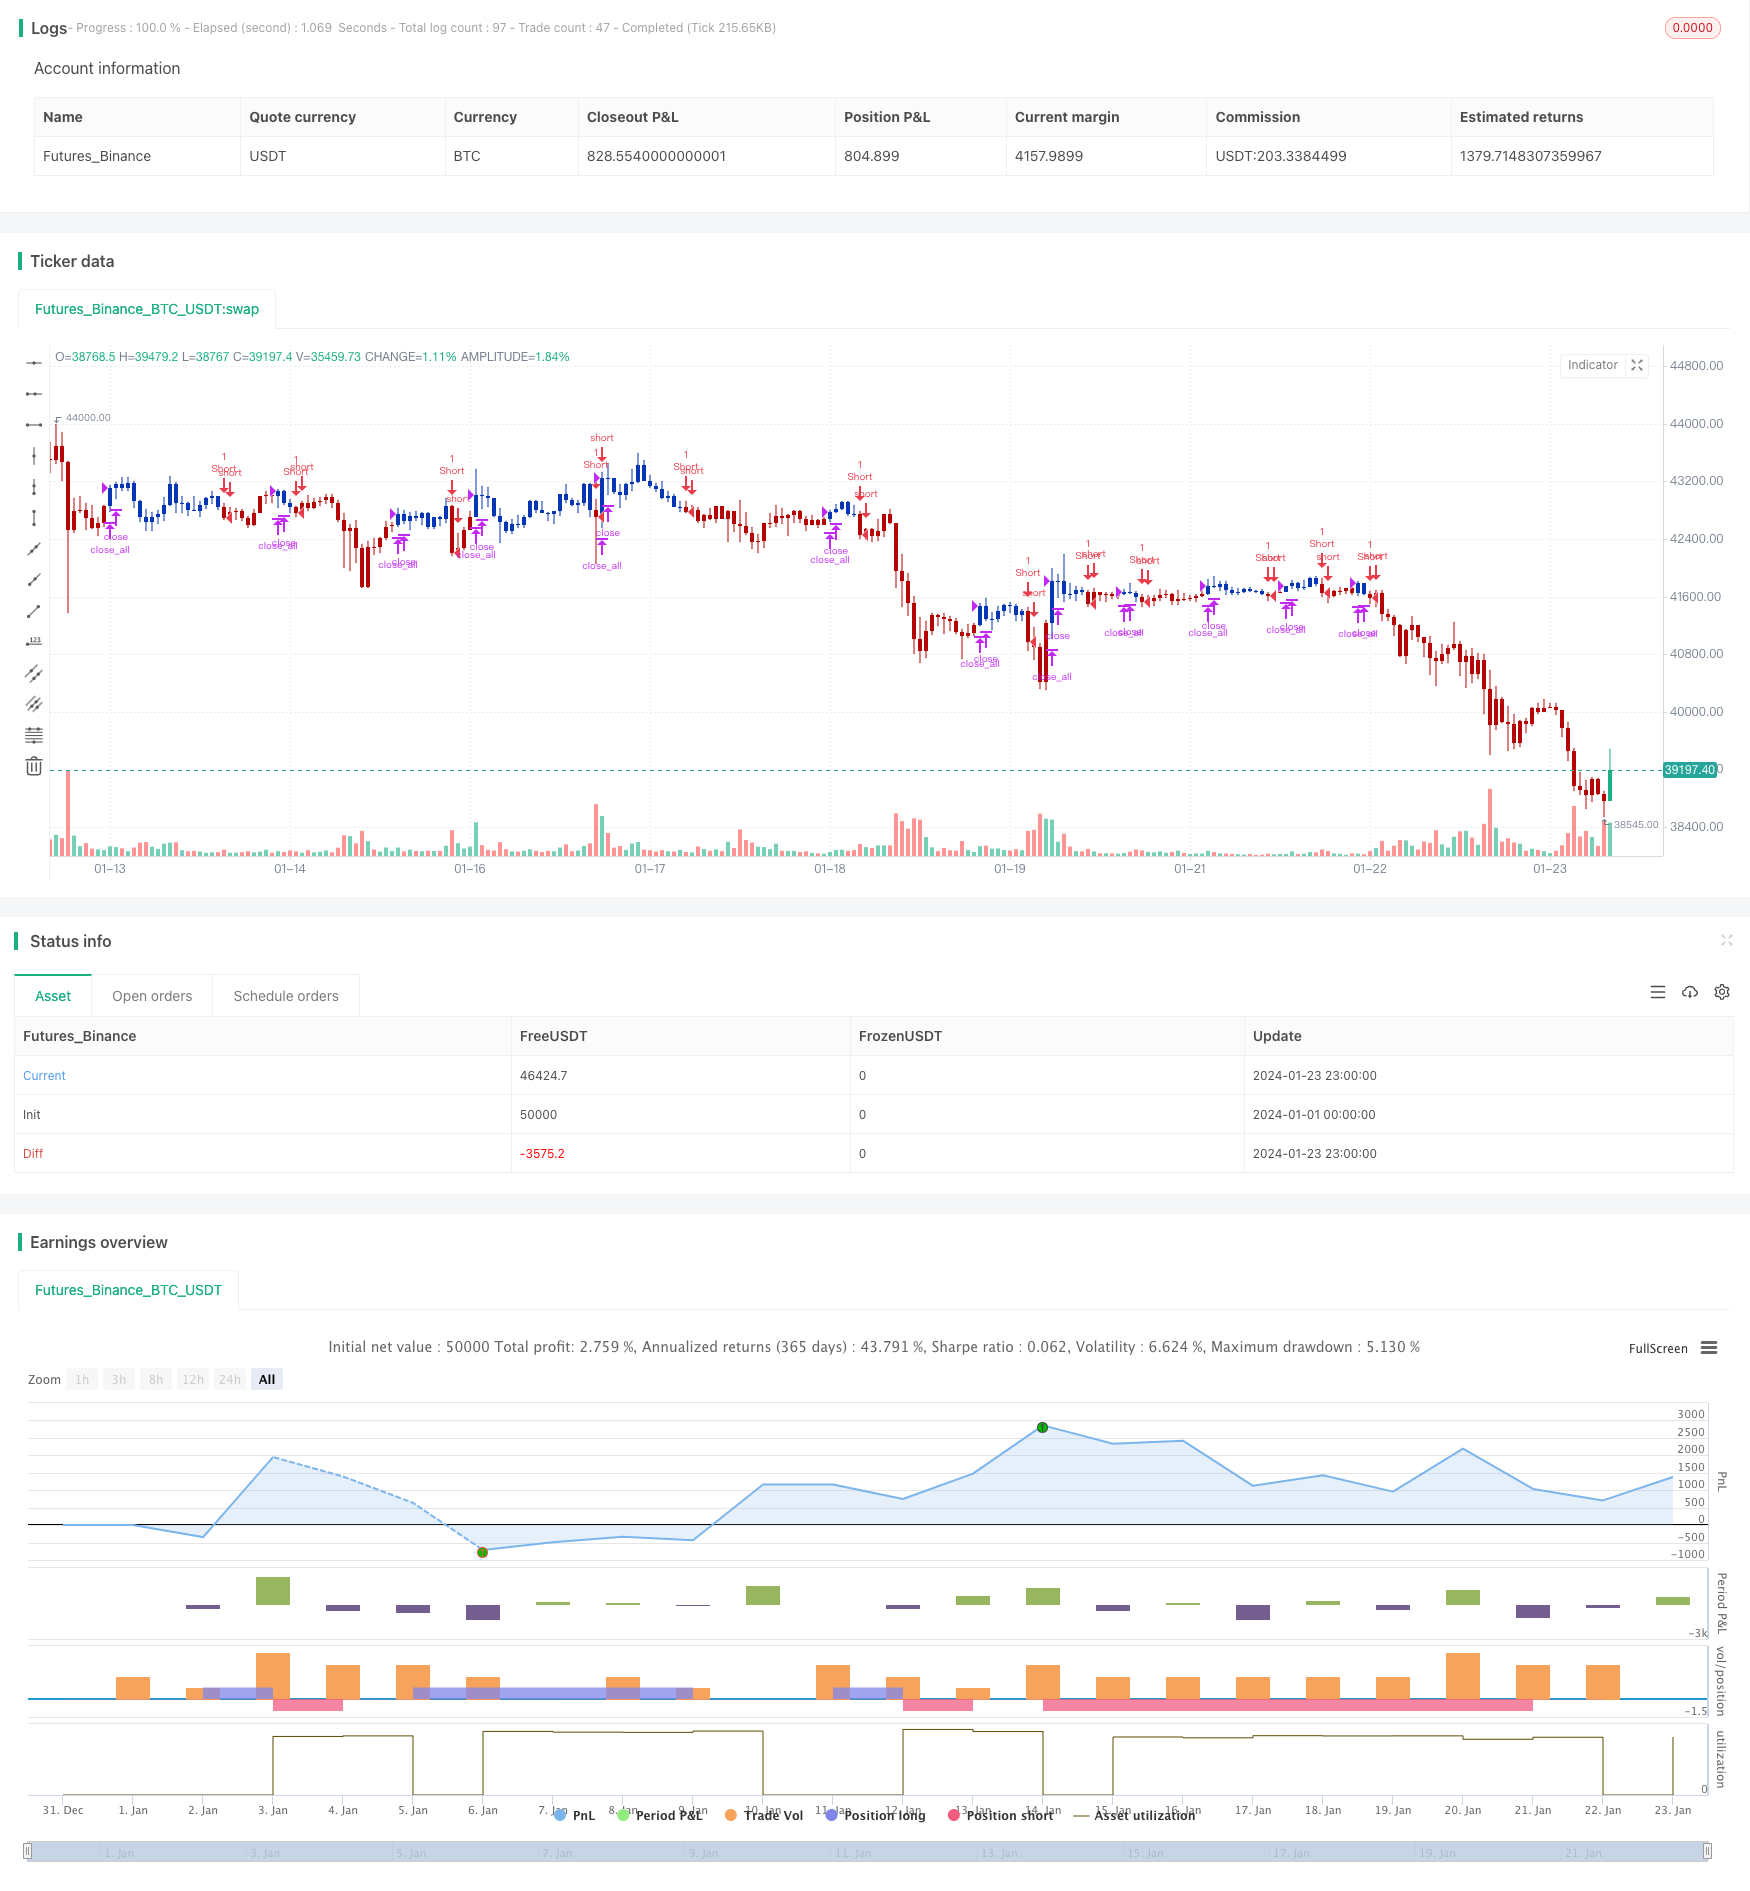
/*backtest
start: 2024-01-01 00:00:00
end: 2024-01-24 00:00:00
period: 1h
basePeriod: 15m
exchanges: [{"eid":"Futures_Binance","currency":"BTC_USDT"}]
*/

//@version=4
////////////////////////////////////////////////////////////
//  Copyright by HPotter v1.0 21/09/2020
// This is combo strategies for get a cumulative signal.
//
// First strategy
// This System was created from the Book "How I Tripled My Money In The
// Futures Market" by Ulf Jensen, Page 183. This is reverse type of strategies.
// The strategy buys at market, if close price is higher than the previous close
// during 2 days and the meaning of 9-days Stochastic Slow Oscillator is lower than 50.
// The strategy sells at market, if close price is lower than the previous close price
// during 2 days and the meaning of 9-days Stochastic Fast Oscillator is higher than 50.
//
// Second strategy
//  Stock market moves in a highly chaotic way, but at a larger scale, the movements
// follow a certain pattern that can be applied to shorter or longer periods of time
// and we can use Fractal Chaos Bands Indicator to identify those patterns. Basically,
// the Fractal Chaos Bands Indicator helps us to identify whether the stock market is
// trending or not. When a market is trending, the bands will have a slope and if market
// is not trending the bands will flatten out. As the slope of the bands decreases, it
// signifies that the market is choppy, insecure and variable. As the graph becomes more
// and more abrupt, be it going up or down, the significance is that the market becomes
// trendy, or stable. Fractal Chaos Bands Indicator is used similarly to other bands-indicator
// (Bollinger bands for instance), offering trading opportunities when price moves above or
// under the fractal lines.
//
// The FCB indicator looks back in time depending on the number of time periods trader selected
// to plot the indicator. The upper fractal line is made by plotting stock price highs and the
// lower fractal line is made by plotting stock price lows. Essentially, the Fractal Chaos Bands
// show an overall panorama of the price movement, as they filter out the insignificant fluctuations
// of the stock price.
//
// WARNING:
// - For purpose educate only
// - This script to change bars colors.
////////////////////////////////////////////////////////////
Reversal123(Length, KSmoothing, DLength, Level) =>
    vFast = sma(stoch(close, high, low, Length), KSmoothing)
    vSlow = sma(vFast, DLength)
    pos = 0.0
    pos := iff(close[2] < close[1] and close > close[1] and vFast < vSlow and vFast > Level, 1,
	         iff(close[2] > close[1] and close < close[1] and vFast > vSlow and vFast < Level, -1, nz(pos[1], 0)))
	pos

fractalUp(pattern) =>
    p = high[pattern+1]
    okl = 1
    okr = 1
    res = 0.0
	for i = pattern to 1
		okl := iff(high[i] < high[i+1] and okl == 1 , 1, 0)
	for i = pattern+2 to pattern*2+1
		okr := iff(high[i] < high[i-1] and okr == 1, 1, 0)
	res := iff(okl == 1 and okr == 1, p, res[1])
    res

fractalDn(pattern) =>
    p = low[pattern+1]
    okl = 1
    okr = 1
    res =0.0
	for i = pattern to 1
		okl := iff(low[i] > low[i+1] and okl == 1 , 1, 0)
	for i = pattern+2 to pattern*2+1
		okr := iff(low[i] > low[i-1] and okr == 1, 1, 0)
	res := iff(okl == 1 and okr == 1, p, res[1])
    res

FCB(Pattern) =>
    pos = 0.0
    xUpper = fractalUp(Pattern)
    xLower = fractalDn(Pattern)
    pos := iff(close > xUpper, 1,
             iff(close < xLower, -1, nz(pos[1], 0)))
    pos

strategy(title="Combo Backtest 123 Reversal & Fractal Chaos Bands", shorttitle="Combo", overlay = true)
Length = input(15, minval=1)
KSmoothing = input(1, minval=1)
DLength = input(3, minval=1)
Level = input(50, minval=1)
//-------------------------
Pattern = input(1, minval=1)
reverse = input(false, title="Trade reverse")
posReversal123 = Reversal123(Length, KSmoothing, DLength, Level)
posFCB = FCB(Pattern)
pos = iff(posReversal123 == 1 and posFCB == 1 , 1,
	   iff(posReversal123 == -1 and posFCB == -1, -1, 0))
possig = iff(reverse and pos == 1, -1,
          iff(reverse and pos == -1 , 1, pos))
if (possig == 1)
    strategy.entry("Long", strategy.long)
if (possig == -1)
    strategy.entry("Short", strategy.short)
if (possig == 0)
    strategy.close_all()
barcolor(possig == -1 ? #b50404: possig == 1 ? #079605 : #0536b3 )