Multi-Time-Frame-Trendfolgestrategie
Überblick
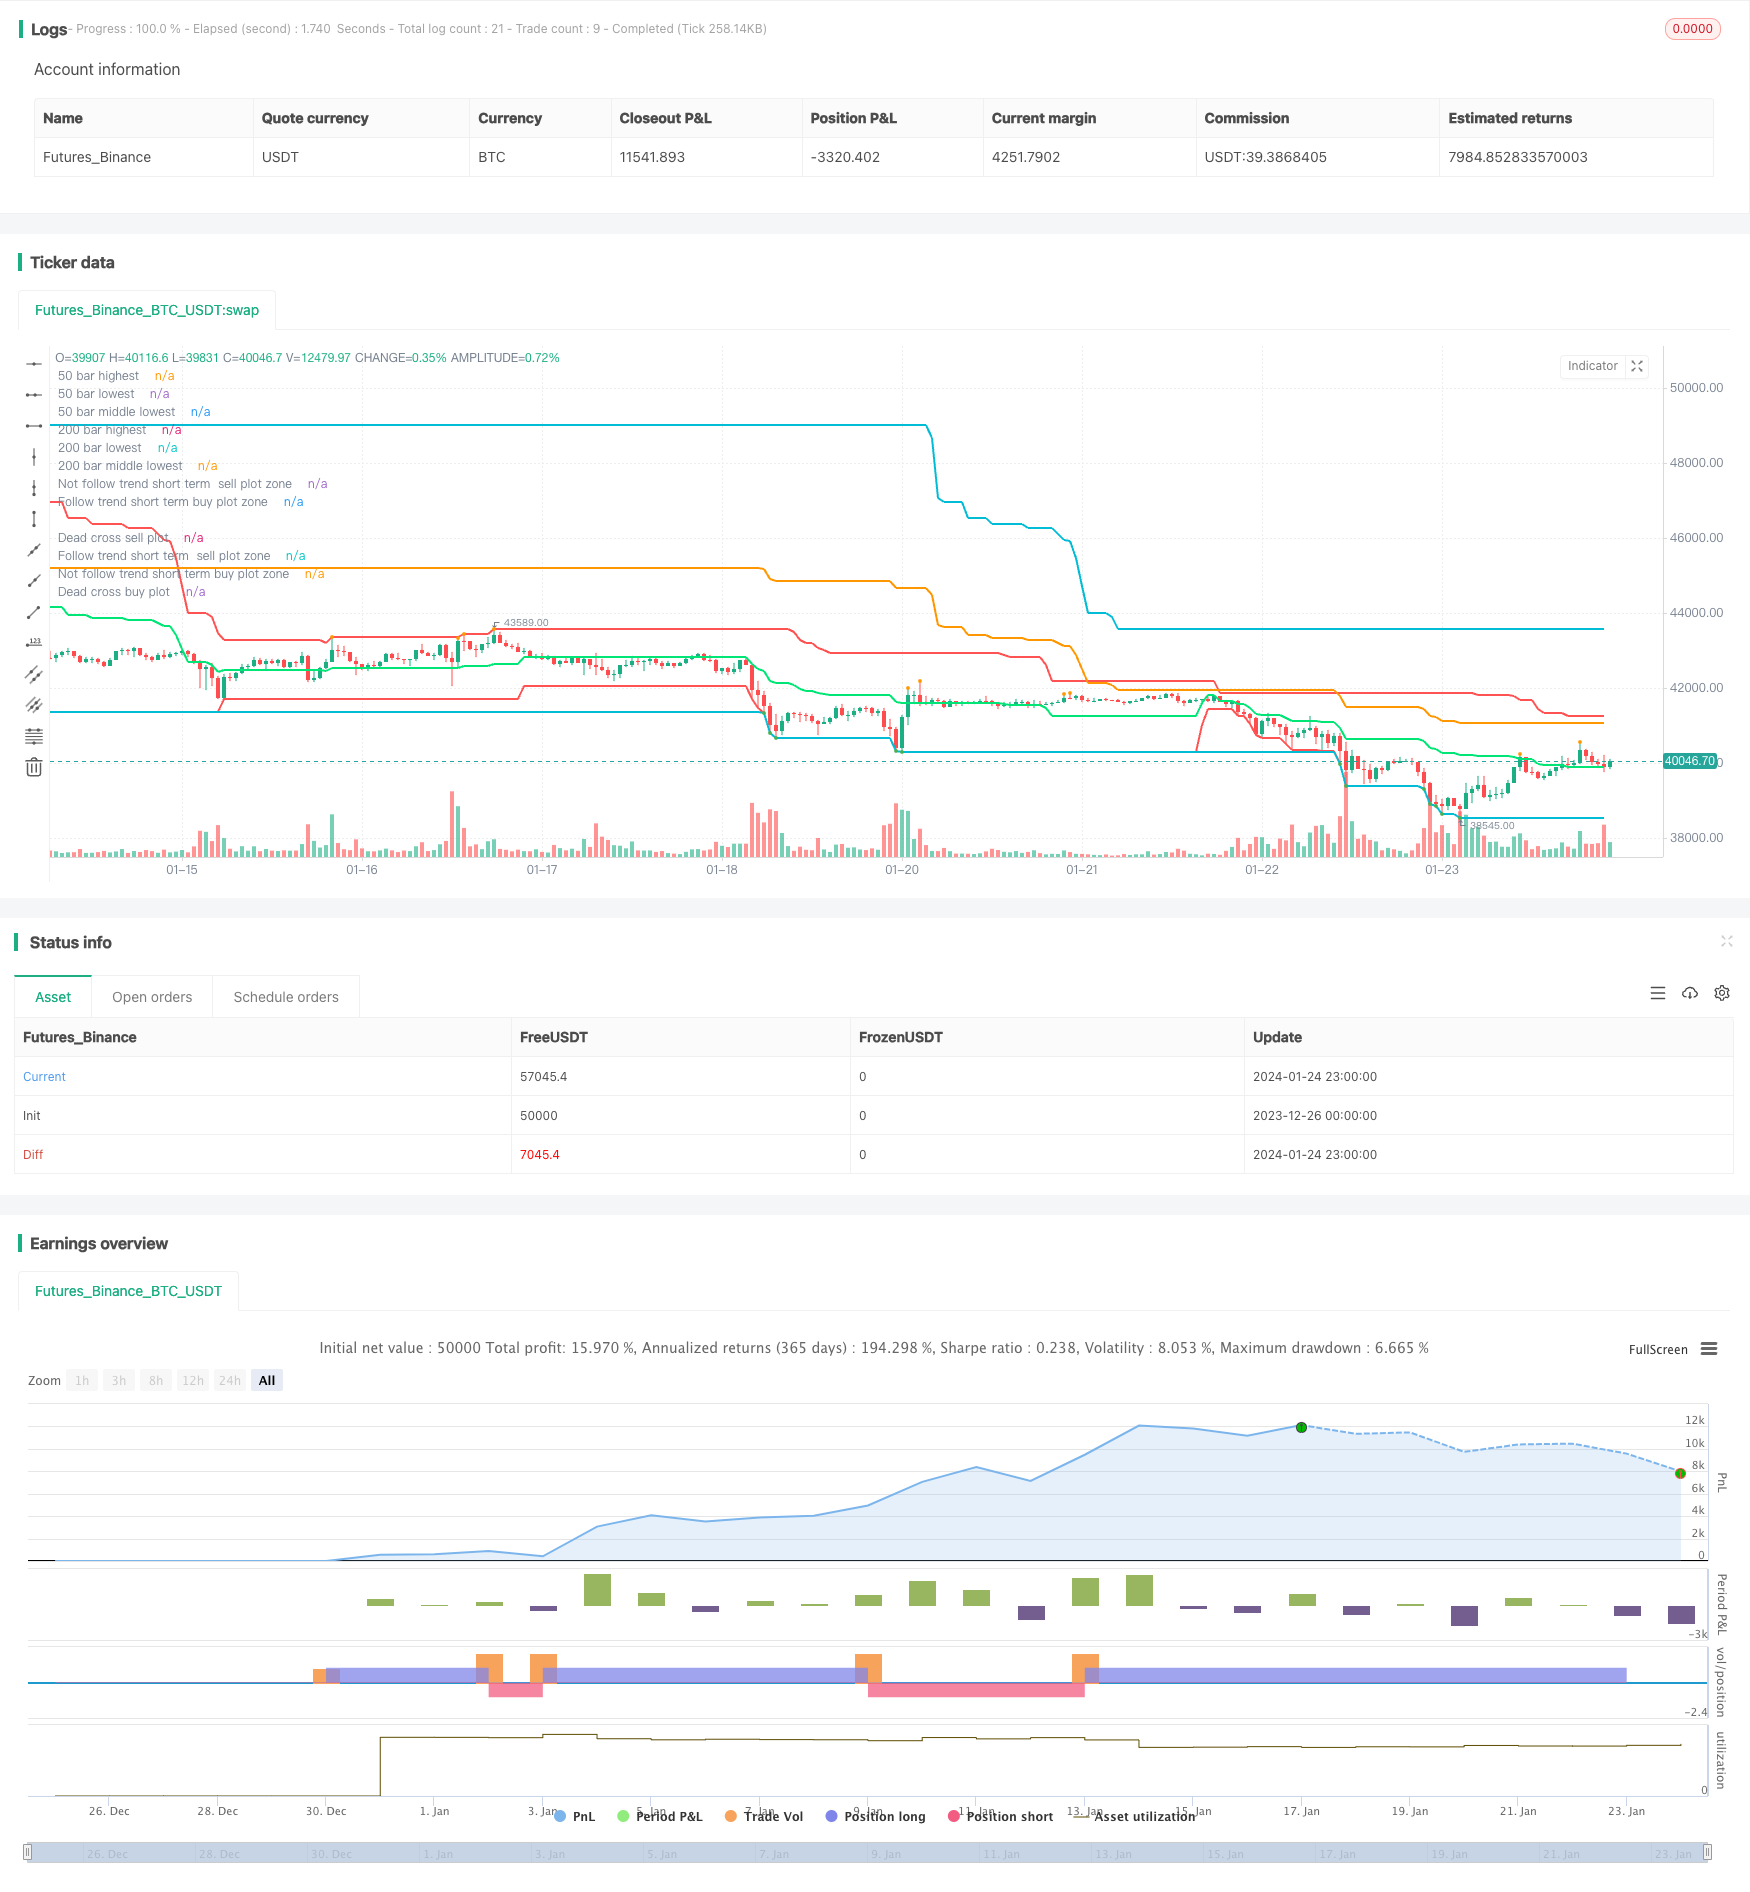
Die Strategie bildet die wichtigsten Preiskanäle, die die Richtung des langfristigen Trends darstellen, indem sie Höchst- und Tiefstpreise innerhalb verschiedener Zeiträume (z. B. 50 Bar und 200 Bar) berechnet. Die Strategie beurteilt die Richtung des kurzfristigen Trends in Kombination mit der schnellen und der langsamen Signallinie. Die Strategie wird angezeigt, wenn die Richtung des langfristigen Trends übereinstimmt.
Strategieprinzip
Zuerst bilden wir zwei Preiskanäle, die langfristige Trendrichtungen darstellen, indem wir Höchst- und Tiefstpreise innerhalb der letzten 50 Bar und Höchst- und Tiefstpreise innerhalb der letzten 200 Bar berechnen.
Zweitens werden die Höchst- und Tiefstpreise der letzten 7 Bars berechnet, um einen schnellen Signalkanal zu bestimmen, der eine kurzfristige Tendenz darstellt. Die Höchst- und Tiefstpreise der letzten 20 Bars werden berechnet, um einen langsameren Signalkanal zu bestimmen, der eine kurzfristige Tendenz darstellt.
Schließlich wird ein Einstiegssignal angezeigt, wenn die Richtung der schnellen Signalkanäle, der langsamen Signalkanäle und der langfristigen Preiskanäle übereinstimmt. Zum Beispiel sind alle Kanäle im Aufwärtstrend, um zu kaufen; alle Kanäle sind im Abwärtstrend, um zu verkaufen.
Analyse der Stärken
Der größte Vorteil dieser Strategie liegt in der Fähigkeit, eine langfristige, einheitliche Trendrichtung zu erkennen. Durch die Bestätigung von Preiskanälen in verschiedenen Zeitzyklen kann effektiv vermieden werden, von kurzfristigen Marktgeräuschen verwirrt zu werden.
Die Strategie verwendet mehrere Zeiträume, um die Signalstabilität zu gewährleisten, auch wenn eine kurzfristige Preisumkehr ein Signal nicht leicht verändert.
Risikoanalyse
Das Hauptrisiko dieser Strategie besteht darin, dass bei einer langfristigen oder kurzfristigen Trendumkehr ein Signalverzögerung auftritt, da mehrere Zeitzykluskanäle benötigt werden. Ein blinder Anschluss kann zu einer Verlustvergrößerung führen.
Darüber hinaus ist es unfreundlich für Hochfrequenz-Handel und kann nicht schnell auf kurzfristige Kursschwankungen reagieren. Wenn es zu einer heftigen Situation kommt, kann die falsche Einstellung der Stop-Loss-Bedingungen zu großen Verlusten führen.
Optimierungsrichtung
Es kann in Erwägung gezogen werden, eine anpassungsfähige dynamische Stop-Loss-Strategie einzusetzen, um das Risiko effektiv zu kontrollieren, wenn der Preis einen bestimmten Prozentsatz in eine nachteilige Richtung durchbricht.
Außerdem können mehr Preiskanäle mit unterschiedlicher Länge hinzugefügt werden, um die Endsignale durch Abstimmungen zu bestimmen und die Genauigkeit der Beurteilung zu verbessern.
Oder automatische Optimierung der Parameter der einzelnen Kanäle mit Hilfe eines Algorithmus für maschinelles Lernen, um die Parameter besser an die aktuelle Marktumgebung anzupassen.
Zusammenfassen
Die Gesamtkonzeption der Strategie ist klar und verständlich, die Markttrends durch mehrere Zeitrahmen-Preiskanäle zu beurteilen, kann die kurzfristige Marktlärm effizient zu filtern. Aber die Behandlung der Umkehrung und die Risikokontrolle müssen gestärkt werden.
/*backtest
start: 2023-12-26 00:00:00
end: 2024-01-25 00:00:00
period: 1h
basePeriod: 15m
exchanges: [{"eid":"Futures_Binance","currency":"BTC_USDT"}]
*/

// This source code is subject to the terms of the Mozilla Public License 2.0 at https://mozilla.org/MPL/2.0/
// © ZoomerXeus

//@version=4
strategy("Swing High Low Price Channel V.1", overlay=true)

//========================= variable =================================//
dead_channel_source = input(title="Main swing channel source", defval="H/L", options=["H/L"])
fast_signal_length = input(title="Fast Slow Length", type=input.integer, defval=7, maxval=49, minval=1)
slow_signal_length = input(title="Slow Slow Length", type=input.integer, defval=20, maxval=49, minval=1)
is_show_only_dead_channel = input(title="Show main channel only", defval=true)
main_channel_width = input(title="Main line width", defval=2, minval=1)
signal_channel_width = input(title="Signal line width", defval=1, minval=1)

//========================= indicator function =================================//
dead_cross_high_50 = highest(high, 50)
dead_cross_high_200 = highest(high, 200)
//========================================
dead_cross_low_50 = lowest(low, 50)
dead_cross_low_200 = lowest(low, 200)
//========================================
medain_dead_cross_50 = ((dead_cross_high_50-dead_cross_low_50)*0.5)+dead_cross_low_50
medain_dead_cross_200 = ((dead_cross_high_200-dead_cross_low_200)*0.5)+dead_cross_low_200


//========================================
fasthighest = highest(high, fast_signal_length)
fastlowest = lowest(low, fast_signal_length)
//========================================
slowhighest = highest(high, slow_signal_length)
slowlowest = lowest(low, slow_signal_length)
//========================================


//========================= plot =================================//
plot(dead_channel_source == "H/L" ? dead_cross_high_50 : na,title="50 bar highest", color=color.red, linewidth=main_channel_width)
plot(dead_channel_source == "H/L" ? dead_cross_high_200 : na,title="200 bar highest", color=color.aqua, linewidth=main_channel_width)
plot(dead_channel_source == "H/L" ? dead_cross_low_50 : na,title="50 bar lowest", color=color.red, linewidth=main_channel_width)
plot(dead_channel_source == "H/L" ? dead_cross_low_200 : na,title="200 bar lowest", color=color.aqua, linewidth=main_channel_width)
plot(dead_channel_source == "H/L" ? medain_dead_cross_200 : na,title="200 bar middle lowest", color=color.orange, linewidth=main_channel_width)
plot(dead_channel_source == "H/L" ? medain_dead_cross_50 : na,title="50 bar middle lowest", color=color.lime, linewidth=main_channel_width)
//===========================================
plot(is_show_only_dead_channel == false ? fasthighest : na,title="fast signal highest", color=#ff00f9, linewidth=signal_channel_width)
plot(is_show_only_dead_channel == false ? fastlowest : na,title="fast signal lowest", color=#ff00f9, linewidth=signal_channel_width)
plot(is_show_only_dead_channel == false ? slowhighest : na,title="slow signal highest", color=color.white, linewidth=signal_channel_width)
plot(is_show_only_dead_channel == false ? slowlowest : na,title="slow signal lowest", color=color.white, linewidth=signal_channel_width)
//===========================================
plot(crossover(medain_dead_cross_50, medain_dead_cross_200) ? medain_dead_cross_200 : na, title="Dead cross buy plot", style=plot.style_circles, linewidth=6, color=color.lime)
plot(crossunder(medain_dead_cross_50, medain_dead_cross_200) ? medain_dead_cross_200 : na, title="Dead cross sell plot", style=plot.style_circles, linewidth=6, color=color.red)
plot(is_show_only_dead_channel and (medain_dead_cross_50 < medain_dead_cross_200) and high == slowhighest ? high : na, title="Follow trend short term  sell plot zone", style=plot.style_circles, linewidth=3, color=color.orange)
plot(is_show_only_dead_channel and (medain_dead_cross_50 > medain_dead_cross_200) and low == slowlowest ? low : na, title="Follow trend short term buy plot zone", style=plot.style_circles, linewidth=3, color=color.green)
plot(is_show_only_dead_channel and high == slowhighest and (high == dead_cross_high_200) ? high : na, title="Not follow trend short term  sell plot zone", style=plot.style_circles, linewidth=3, color=color.orange)
plot(is_show_only_dead_channel and low == slowlowest and (low == dead_cross_low_200) ? low : na, title="Not follow trend short term buy plot zone", style=plot.style_circles, linewidth=3, color=color.green)

//===================== open close order condition =========================================================//
strategy.entry("strong buy", true, 1, when=low == dead_cross_low_200)
strategy.exit("close strong buy 50%", "strong buy", qty_percent=50, when=high==slowhighest)
strategy.entry("strong sell", false, 1, when=high == dead_cross_high_200)
strategy.exit("close strong sell 50%", "strong sell", qty_percent=50, when=low==slowlowest)