Bidirektionale Pyramidenstrategie für den Aktienhandel basierend auf dem RSI-Indikator
Überblick
In diesem Artikel wird vor allem eine auf einem relativ schwachen Indikator (RSI) basierende Strategie des Aktienhandelspyramids vorgestellt. Die Strategie beurteilt die überkauften und überverkauften Gebiete der Aktien anhand des RSI und erzielt Gewinne in Verbindung mit dem Pyramiden-Hauflageprinzip.
Strategieprinzip
- Der RSI wird verwendet, um zu beurteilen, ob eine Aktie in eine Überkauf-Überverkaufszone geraten ist. Wenn der RSI unter 25 liegt, ist er überverkauft, und wenn er über 80 liegt, ist er überkauft.
- Wenn der RSI in die Überverkaufszone eintritt, beginnt der Überverkauf. Wenn der RSI in die Überkaufszone eintritt, beginnt der Kauf.
- Bei einer Pyramidenlagerung können Sie bis zu 7 Mal lagern. Nach jeder Lagerung können Sie einen Stop-Loss-Punkt einrichten.
Analyse der Stärken
- Der RSI-Indikator wird verwendet, um die Überkauf- und Überverkaufspläne zu ermitteln und die größeren Chancen für eine Preisumkehr zu erfassen.
- Die Pyramiden-Lagerung ermöglicht eine bessere Rendite, wenn die Umstände richtig sind.
- Ein Stop-Loss-System kann für jede Verlagerung eingesetzt werden, um das Risiko zu kontrollieren.
Risikoanalyse
- Der RSI-Indikator beurteilt Überkauf und Überverkauf unbeständig und kann falsche Signale geben.
- Die Anzahl der Einlagen muss angemessen eingestellt werden, da ein zu hohes Risiko besteht.
- Die Stop-Loss-Punkt-Einstellung muss die Schwankungen berücksichtigen und darf nicht zu klein sein.
Optimierungsrichtung
- Es kann in Kombination mit anderen Indikatoren in Betracht gezogen werden, um die RSI-Signal zu filtern, um die Genauigkeit zu erhöhen, um Überkauf und Überverkauf zu beurteilen.
- Es ist möglich, einen Floating Stop-Loss einzurichten, um den Preis zu verfolgen. Der Kurs kann dynamisch angepasst werden, um die Volatilität und die Risikokontrolle zu kontrollieren.
- Es kann in Erwägung gezogen werden, sich an die Marktlage anpassende Parameter zu verwenden (Bullmarkt, Bärenmarkt usw.).
Zusammenfassen
Diese Strategie kombiniert den RSI mit der Pyramiden-Hauftrittsstrategie, um durch die Hauftrittsstrategie mehr Gewinne zu erzielen, während überkauft und überverkauft beurteilt wird. Obwohl die RSI-Bestimmungsgenauigkeit verbessert werden muss, kann durch die Optimierung von vernünftigen Parametern in Kombination mit anderen Indikatoren eine effektiv stabile Handelsstrategie gebildet werden. Die Strategie hat eine gewisse Allgemeinheit und ist eine relativ einfache und unmittelbare Methode zum Quantifizieren des Handels.
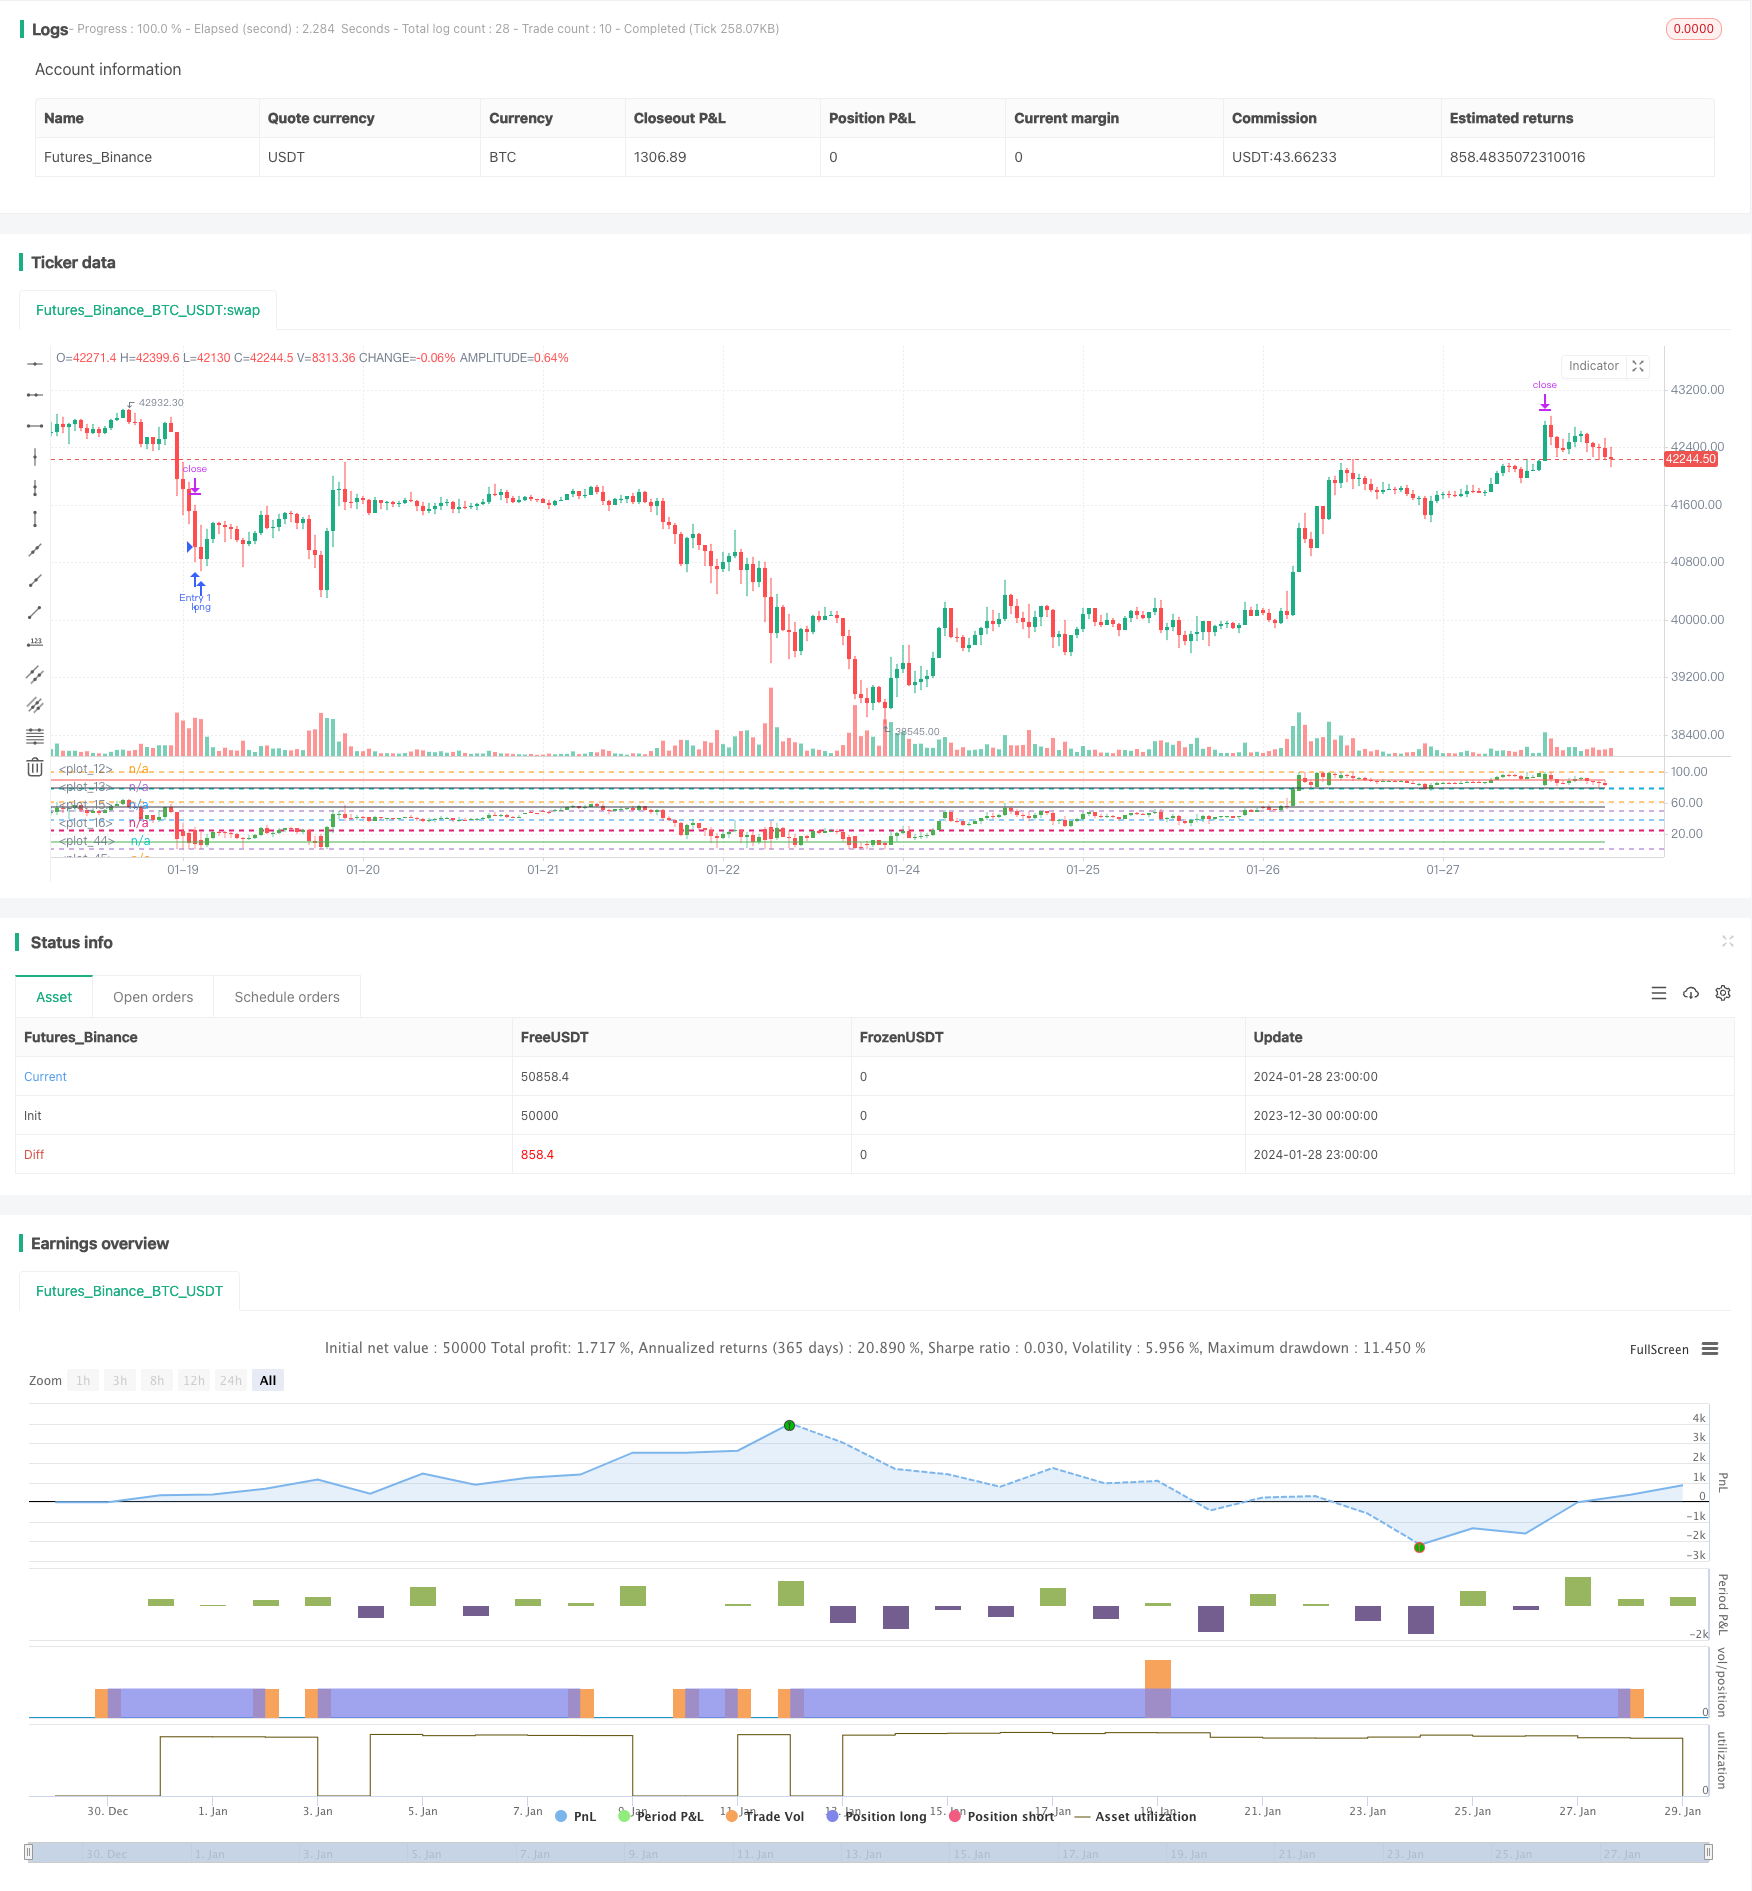
/*backtest
start: 2023-12-30 00:00:00
end: 2024-01-29 00:00:00
period: 1h
basePeriod: 15m
exchanges: [{"eid":"Futures_Binance","currency":"BTC_USDT"}]
*/

//@version=4
// This source code is subject to the terms of the Mozilla Public License 2.0 at https://mozilla.org/MPL/2.0/
// © RafaelZioni

strategy(title='Simple RSI strategy', overlay=false)

SWperiod = 1
look = 0
OverBought = input(80, minval=50)
OverSold = input(25, maxval=50)

bandmx = hline(100)
bandmn = hline(0)

band1 = hline(OverBought)
band0 = hline(OverSold)
//band50 = hline(50, color=black, linewidth=1)
fill(band1, band0, color=color.purple, transp=98)


src = close
len = input(5, minval=1, title="RSI Length")
up = rma(max(change(src), 0), len)
down = rma(-min(change(src), 0), len)
rsi = down == 0 ? 100 : up == 0 ? 0 : 100 - 100 / (1 + up / down)

p = 100

//scale
hh = highest(high, p)
ll = lowest(low, p)
scale = hh - ll

//dynamic OHLC
dyno = (open - ll) / scale * 100
dynl = (low - ll) / scale * 100
dynh = (high - ll) / scale * 100
dync = (close - ll) / scale * 100

//candle color
color_1 = close > open ? 1 : 0

//drawcandle
hline(78.6)
hline(61.8)
hline(50)
hline(38.2)
hline(23.6)
plotcandle(dyno, dynh, dynl, dync, title="Candle", color=color_1 == 1 ? color.green : color.red)
plot(10, color=color.green)
plot(55, color=color.black)
plot(80, color=color.black)
plot(90, color=color.red)

long = rsi <= OverSold ? 5 : na

//Strategy
golong = rsi <= OverSold ? 5 : na

longsignal = golong
//based on https://www.tradingview.com/script/7NNJ0sXB-Pyramiding-Entries-On-Early-Trends-by-Coinrule/
//set take profit

ProfitTarget_Percent = input(3)
Profit_Ticks = close * (ProfitTarget_Percent / 100) / syminfo.mintick

//set take profit

LossTarget_Percent = input(10)
Loss_Ticks = close * (LossTarget_Percent / 100) / syminfo.mintick


//Order Placing

strategy.entry("Entry 1", strategy.long, when=strategy.opentrades == 0 and longsignal)

strategy.entry("Entry 2", strategy.long, when=strategy.opentrades == 1 and longsignal)

strategy.entry("Entry 3", strategy.long, when=strategy.opentrades == 2 and longsignal)

strategy.entry("Entry 4", strategy.long, when=strategy.opentrades == 3 and longsignal)

strategy.entry("Entry 5", strategy.long, when=strategy.opentrades == 4 and longsignal)

strategy.entry("Entry 6", strategy.long, when=strategy.opentrades == 5 and longsignal)

strategy.entry("Entry 7", strategy.long, when=strategy.opentrades == 6 and longsignal)


if strategy.position_size > 0
    strategy.exit(id="Exit 1", from_entry="Entry 1", profit=Profit_Ticks, loss=Loss_Ticks)
    strategy.exit(id="Exit 2", from_entry="Entry 2", profit=Profit_Ticks, loss=Loss_Ticks)
    strategy.exit(id="Exit 3", from_entry="Entry 3", profit=Profit_Ticks, loss=Loss_Ticks)
    strategy.exit(id="Exit 4", from_entry="Entry 4", profit=Profit_Ticks, loss=Loss_Ticks)
    strategy.exit(id="Exit 5", from_entry="Entry 5", profit=Profit_Ticks, loss=Loss_Ticks)
    strategy.exit(id="Exit 6", from_entry="Entry 6", profit=Profit_Ticks, loss=Loss_Ticks)
    strategy.exit(id="Exit 7", from_entry="Entry 7", profit=Profit_Ticks, loss=Loss_Ticks)