Crossover-Strategie für kurzfristige Durchbruchs- und Umkehrstrategien mit 5EMA
Dieser Artikel beschreibt eine Kurzlinie-Breakout-Umkehr-Handelsstrategie, die auf dem 5EMA-Indikator basiert. Die Strategie nutzt hauptsächlich den 5EMA-Indikator, um die Preisentwicklung zu ermitteln und umzukehren, wenn der Preis eine EMA-Breakout durchführt.
Strategieübersicht
Die Strategie ist eine Short-Line-Quantifizierungs-Strategie, die hauptsächlich für Hochfrequenz-Handel verwendet wird. Die Strategie beurteilt gleichzeitig Über- und Off-Handelssignale und kann in beide Richtungen gehandelt werden. Sie erzeugt ein Handelssignal, wenn der Preis den 5EMA-Indikator durchbricht, und tritt in eine Über- oder Off-Position ein, je nach der Richtung des Durchbruchs.
Der strategische Vorteil besteht darin, die Gelegenheit eines kurzen Kurswechsels zu ergreifen und schnell ins Feld zu gelangen. Das Risiko besteht hauptsächlich aus Verlusten durch falsche Durchbrüche. Das Risiko von Verlusten kann durch Optimierungsparameter verringert werden.
Strategieprinzip
Kurzfristige Preistrends mit Hilfe der 5-Zyklus-EMA
Beurteilung, ob der Preis die EMA-Marke überschreitet
Wenn der Preis die EMA von oben nach unten durchbricht, wird ein Verkaufssignal erzeugt
Wenn der Preis die EMA von unten nach oben durchbricht, erzeugt dies ein Kaufsignal
Setzen Sie Stop-Loss- und Stop-Stop-Punkte, um Einzelschäden zu begrenzen
Da der EMA-Indikator in der Lage ist, kurzfristige Trends effektiv zu beurteilen, kann er bei einer deutlichen Preisumkehr schnell Handelschancen erfassen. Die Parameter der 5EMA sind flexibler, reagieren schnell auf den Markt und eignen sich für Hochfrequenz-Handel.
Strategische Vorteile
- Schnelle Reaktion, geeignet für die Erfassung von High-Frequency-Short-Line-Geschäftsmöglichkeiten
- Zwei-Wege-Trading, bei dem man gleichzeitig mehr Leerstellen machen kann
- Die Stop-Loss-Sperre ist vernünftig eingestellt, die Einzelschäden sind begrenzt.
- Einfache Parameter-Einstellungen und einfache Optimierung der Strategie
Strategische Risiken und Lösungen
- Falsche Durchbruchrisiken verursachen unnötige Verluste
- Optimierung der EMA-Zyklusparameter zur Sicherstellung der Stabilität des Indikators
- Übermäßige Handelsfrequenz führt zu Schwankungen.
- Grenzen für die maximale Anzahl von Transaktionen pro Tag
Richtung der Strategieoptimierung
- Optimierung der EMA-Indikatorparameter auf der Suche nach der optimalen Periodenkombination
- Erhöhung der Filter und Verringerung der Wahrscheinlichkeit einer falschen Durchbruch
- Grenzen für die maximale Anzahl von Transaktionen pro Tag
- In Kombination mit anderen Indikatoren
Zusammenfassen
Diese Strategie ist insgesamt eine sehr praktische Short-Line-Break-Strategie. Die Verwendung von EMA-Indikatoren, um eine Preisumkehr zu ermitteln, ist sehr einfach und effektiv und ist ein wichtiges Instrument zum Quantifizieren von Geschäften. Durch die Optimierung der Parameter und die Einstellung der Windkontrolle können die Gewinnchancen der Strategie erheblich erhöht werden.
/*backtest
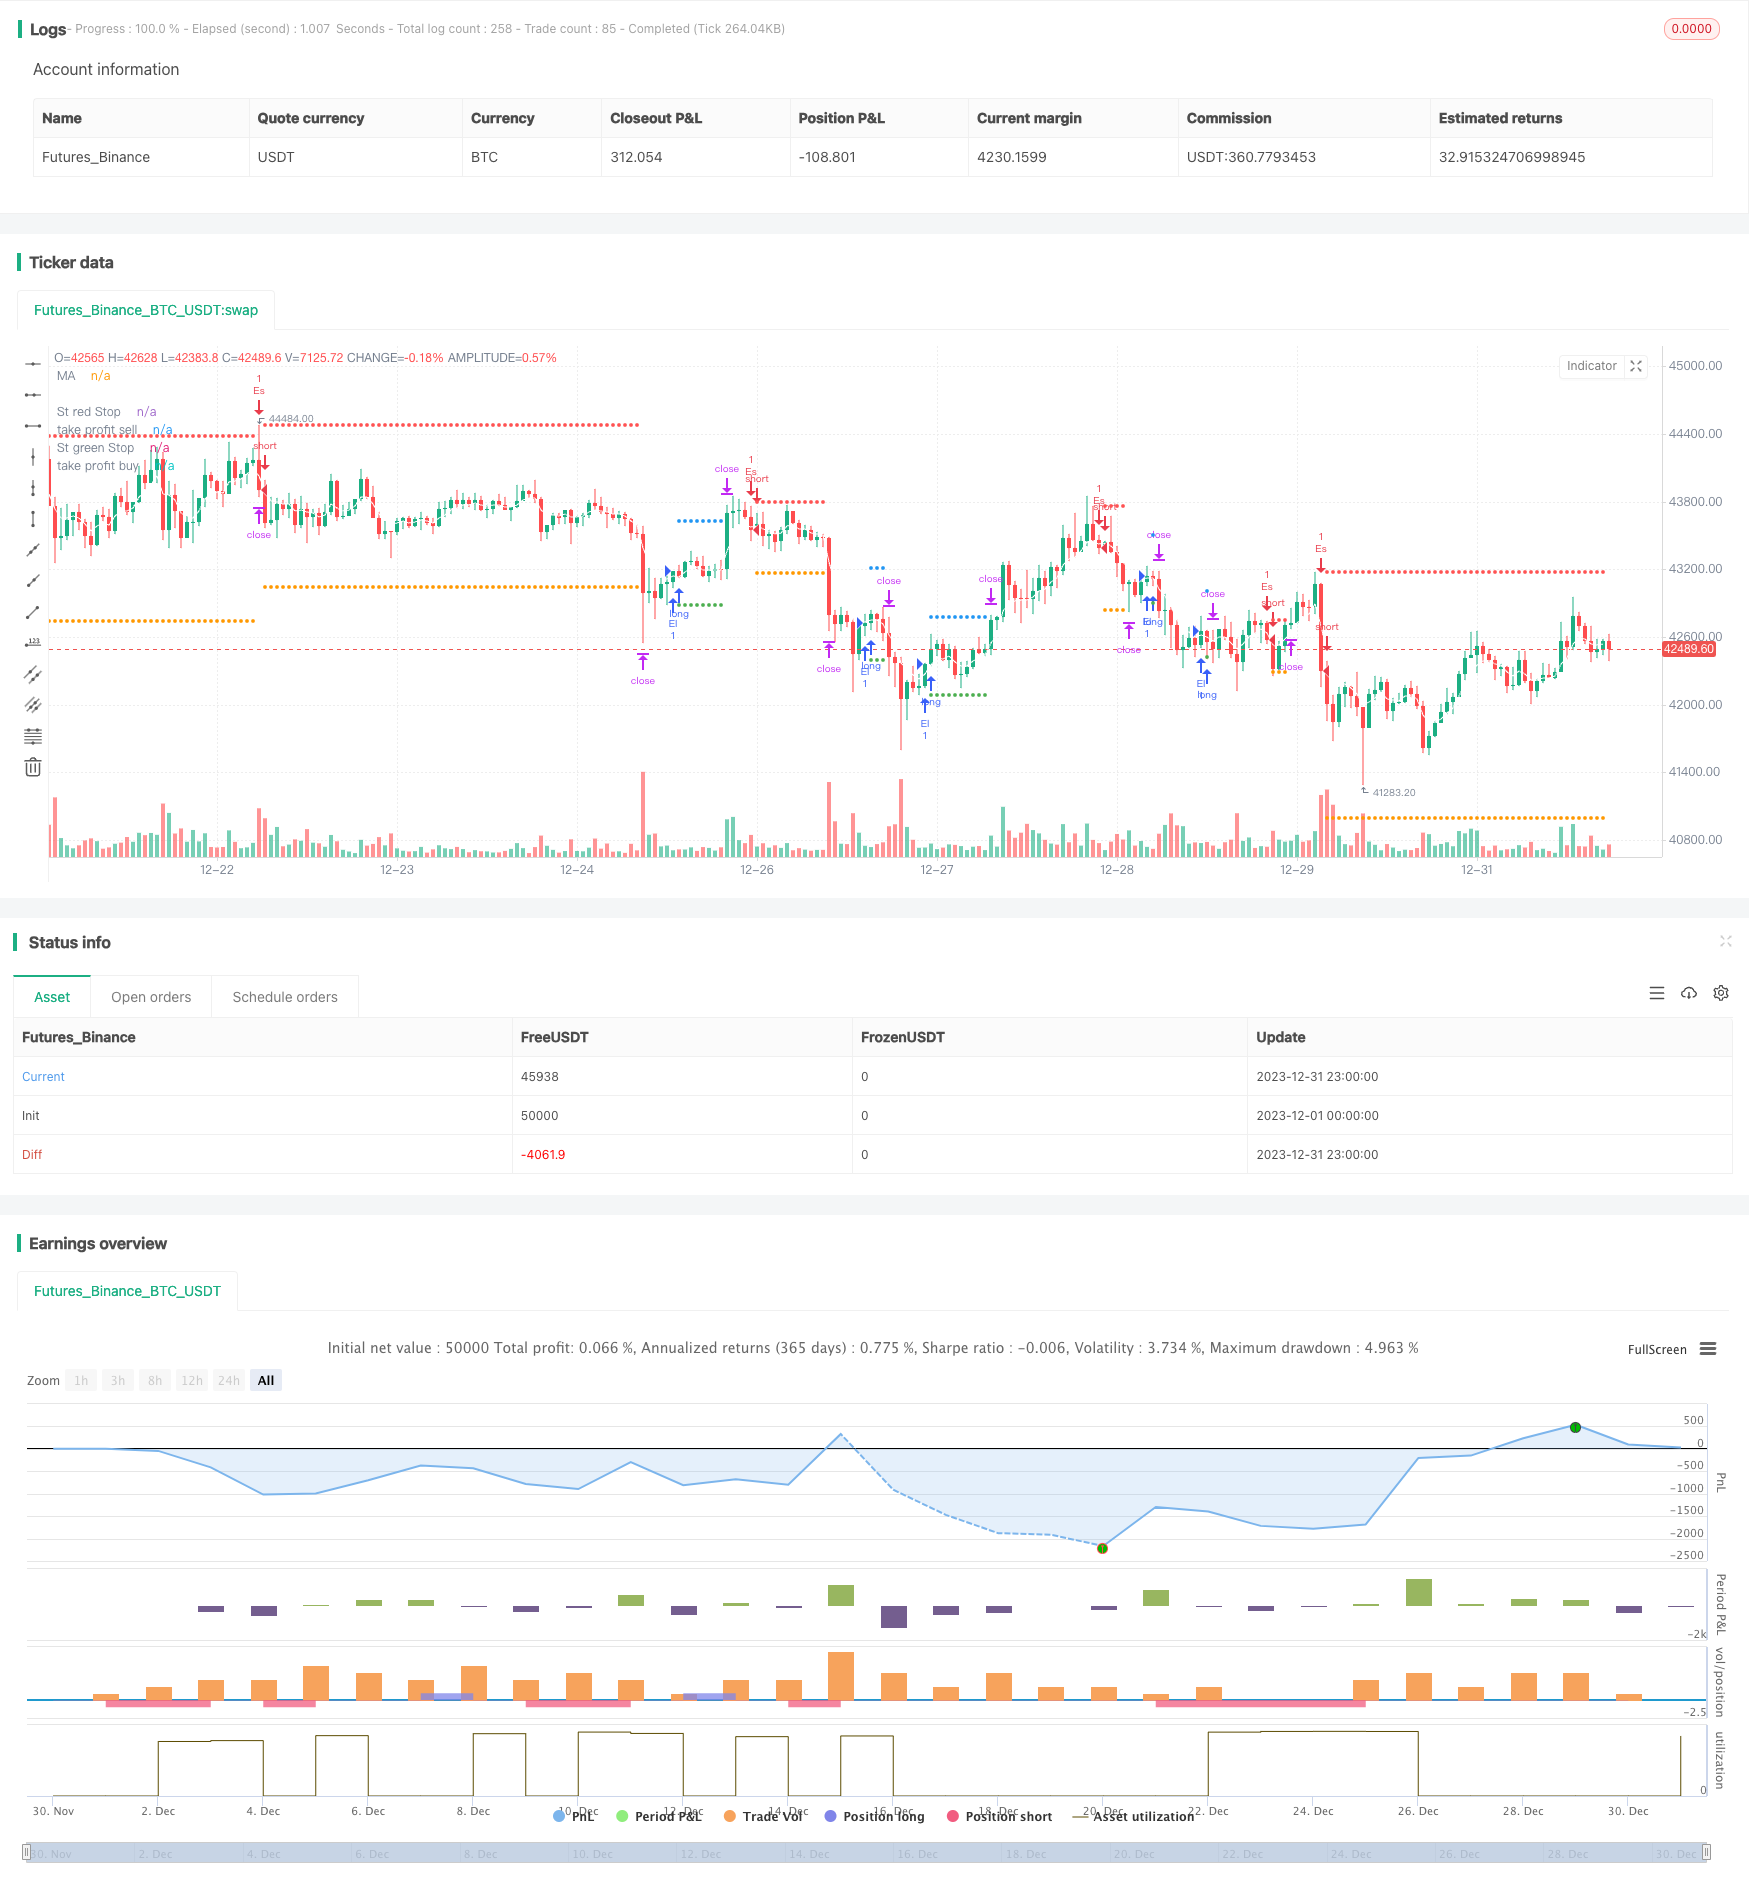
start: 2023-12-01 00:00:00
end: 2023-12-31 23:59:59
period: 1h
basePeriod: 15m
exchanges: [{"eid":"Futures_Binance","currency":"BTC_USDT"}]
*/
// This Pine Script™ code is subject to the terms of the Mozilla Public License 2.0 at https://mozilla.org/MPL/2.0/
// © samscripter
//@version=5
strategy("5 ema strategy",overlay = true,process_orders_on_close = true)
// Choose trade direction
t_dir = input.string("Both", title="Trade Direction",options=["Long", "Short", "Both"],group = 'Trade Direction Set')
long_side = t_dir == "Long" or t_dir == "Both"
short_side = t_dir == "Short" or t_dir == "Both"
// number of trade
mx_num =input.int(4,title = 'number Of trade',group = 'Maximum Number Of Trade')
var hi =0.0
var lo =0.0
var group_ma1="Ema Set"
//Ema 1
on_ma=input.bool(true,"Enable EMa 1 Plot On/Off" ,group =group_ma1)
ma_len= input.int(5, minval=1, title="Ema Length",group =group_ma1)
ma_src = input.source(close, title="Ema Source" ,group = group_ma1)
ma_out = ta.ema(ma_src, ma_len)
// buy and sell ema condition
plot(on_ma?ma_out:na, color=color.white, title="MA")
if close>ma_out and open>ma_out and low>ma_out and high>ma_out
lo:=low
if close<ma_out and open<ma_out and low<ma_out and high<ma_out
hi:=high
// condition when price is crossunder lo take sell and when price crossoing hi take buy
var buyp_sl =float(na)
var sellp_sl =float(na)
//count number trade since day stra
var count_buysell=0
if close>hi[1]
if strategy.position_size==0 and count_buysell<mx_num and long_side
strategy.entry('El',strategy.long,comment = 'Long')
count_buysell:=count_buysell+1
buyp_sl:=math.min(low,low[1])
hi:=na
if close<lo[1]
if strategy.position_size==0 and count_buysell<mx_num and short_side
strategy.entry('Es',strategy.short,comment = 'short')
count_buysell:=count_buysell+1
sellp_sl:=math.max(high,high[1])
lo:=na
//take profit multiply
tpnew = input.float(title="take profit", step=0.1, defval=1.5, group='Tp/SL')
//stop loss previous candle high and previous candle low
buy_sl = ta.valuewhen(strategy.position_size != 0 and strategy.position_size[1] == 0,buyp_sl , 0)
sell_sl= ta.valuewhen(strategy.position_size != 0 and strategy.position_size[1] == 0,sellp_sl, 0)
//take profit
takeProfit_buy = strategy.position_avg_price - ((buy_sl - strategy.position_avg_price) *tpnew)
takeProfit_sell = strategy.position_avg_price - ((sell_sl - strategy.position_avg_price) *tpnew)
// Submit exit orders
if strategy.position_size > 0
strategy.exit(id='XL', stop=buy_sl,limit=takeProfit_buy,comment_loss = 'Long Sl',comment_profit = 'Long Tp')
if strategy.position_size < 0
strategy.exit(id='XS', stop=sell_sl,limit=takeProfit_sell,comment_loss = 'Short Sl',comment_profit = 'Short Tp')
//plot data
plot(series=strategy.position_size < 0 ?sell_sl : na, style=plot.style_circles, color=color.red, linewidth=2, title="St red Stop")
plot(series=strategy.position_size > 0 ?buy_sl : na, style=plot.style_circles, color=color.green, linewidth=2, title="St green Stop")
// plot take profit
plot(series=strategy.position_size < 0 ? takeProfit_sell : na, style=plot.style_circles, color=color.orange, linewidth=2, title="take profit sell")
plot(series=strategy.position_size > 0 ? takeProfit_buy: na, style=plot.style_circles, color=color.blue, linewidth=2, title="take profit buy")
if ta.change(time('D'))
count_buysell:=0