RSI-Trend folgt der Stop-Loss-Strategie
Überblick
Dies ist eine quantitative Handelsstrategie, die den RSI nutzt, um Trends zu bestimmen und Stop-Loss-Stopps zu setzen. Die Strategie kombiniert den RSI, um die Richtung der Markttrends zu bestimmen, und die Einrichtung von dynamischen Stop-Loss-Stopps, um Gewinne zu sichern und Risiken zu minimieren.
Strategieprinzip
Diese Strategie entscheidet sich hauptsächlich über die Richtung der Markttrend durch den RSI-Indikator. Wenn der RSI-Indikator die niedrige Position durchbricht, wird der Markt als Aufwärtstrend beurteilt, und wenn der RSI-Indikator die hohe Position durchbricht, wird der Markt als Abwärtstrend beurteilt, und der Markt wird durchbrochen.
Gleichzeitig setzt die Strategie einen Floating Stop-Loss-Stop, indem sie den Eröffnungspreis für jede Position verfolgt. Für mehrere Optionen wird ein bestimmter Prozentsatz des Eröffnungspreises als Stop-Line festgelegt, während die Off-Option einen bestimmten Prozentsatz des Eröffnungspreises als Stop-Line setzt. Wenn der Preis die Stop-Loss-Line erreicht, wird die Strategie automatisch platziert.
Strategische Vorteile
- Die RSI-Indikatoren werden verwendet, um die Richtung der Markttrends zu bestimmen und den Abschluss von Handelsräumen zu vermeiden.
- Die Einrichtung von Floating Stop-Loss-Stopps ermöglicht eine flexible Gewinnschließung und eine wirksame Risikokontrolle.
- Die RSI-Parameter und die Stop-Loss-Ratio können durch externe Eingaben angepasst und optimiert werden.
Strategisches Risiko
- Der RSI ist etwas zurückgeblieben und könnte einen kurzfristigen Trendwechsel verpassen.
- Die Schadenshemmungsleitung, die zu nahe an den Schadenshemmungsleitungen liegt, kann durchbrochen werden.
Optimierungsrichtung
- Die RSI-Indikatoren für verschiedene Perioden können getestet werden.
- Verschiedene Kombinationen von Parametern können getestet werden, um die optimale Stop-Loss-Stop-Ratio zu finden.
- Zusätzliche Indikatoren können zur Beurteilung des Filtersignals verwendet werden.
Zusammenfassen
Die Strategie als Ganzes ist eine quantitative Trading-Strategie, die Trends mit RSI-Indikatoren verfolgt und mit einem schwimmenden Stop-Loss-Stopp kombiniert wird. Die Strategie ist besser in der Risikokontrolle und kann effektiv Gewinne sperren, als eine Einzelindikator-Trading-Strategie. Die Strategie kann durch Parameteroptimierung und Hinzufügen von Hilfsindikator-Urteilen weiter verbessert werden.
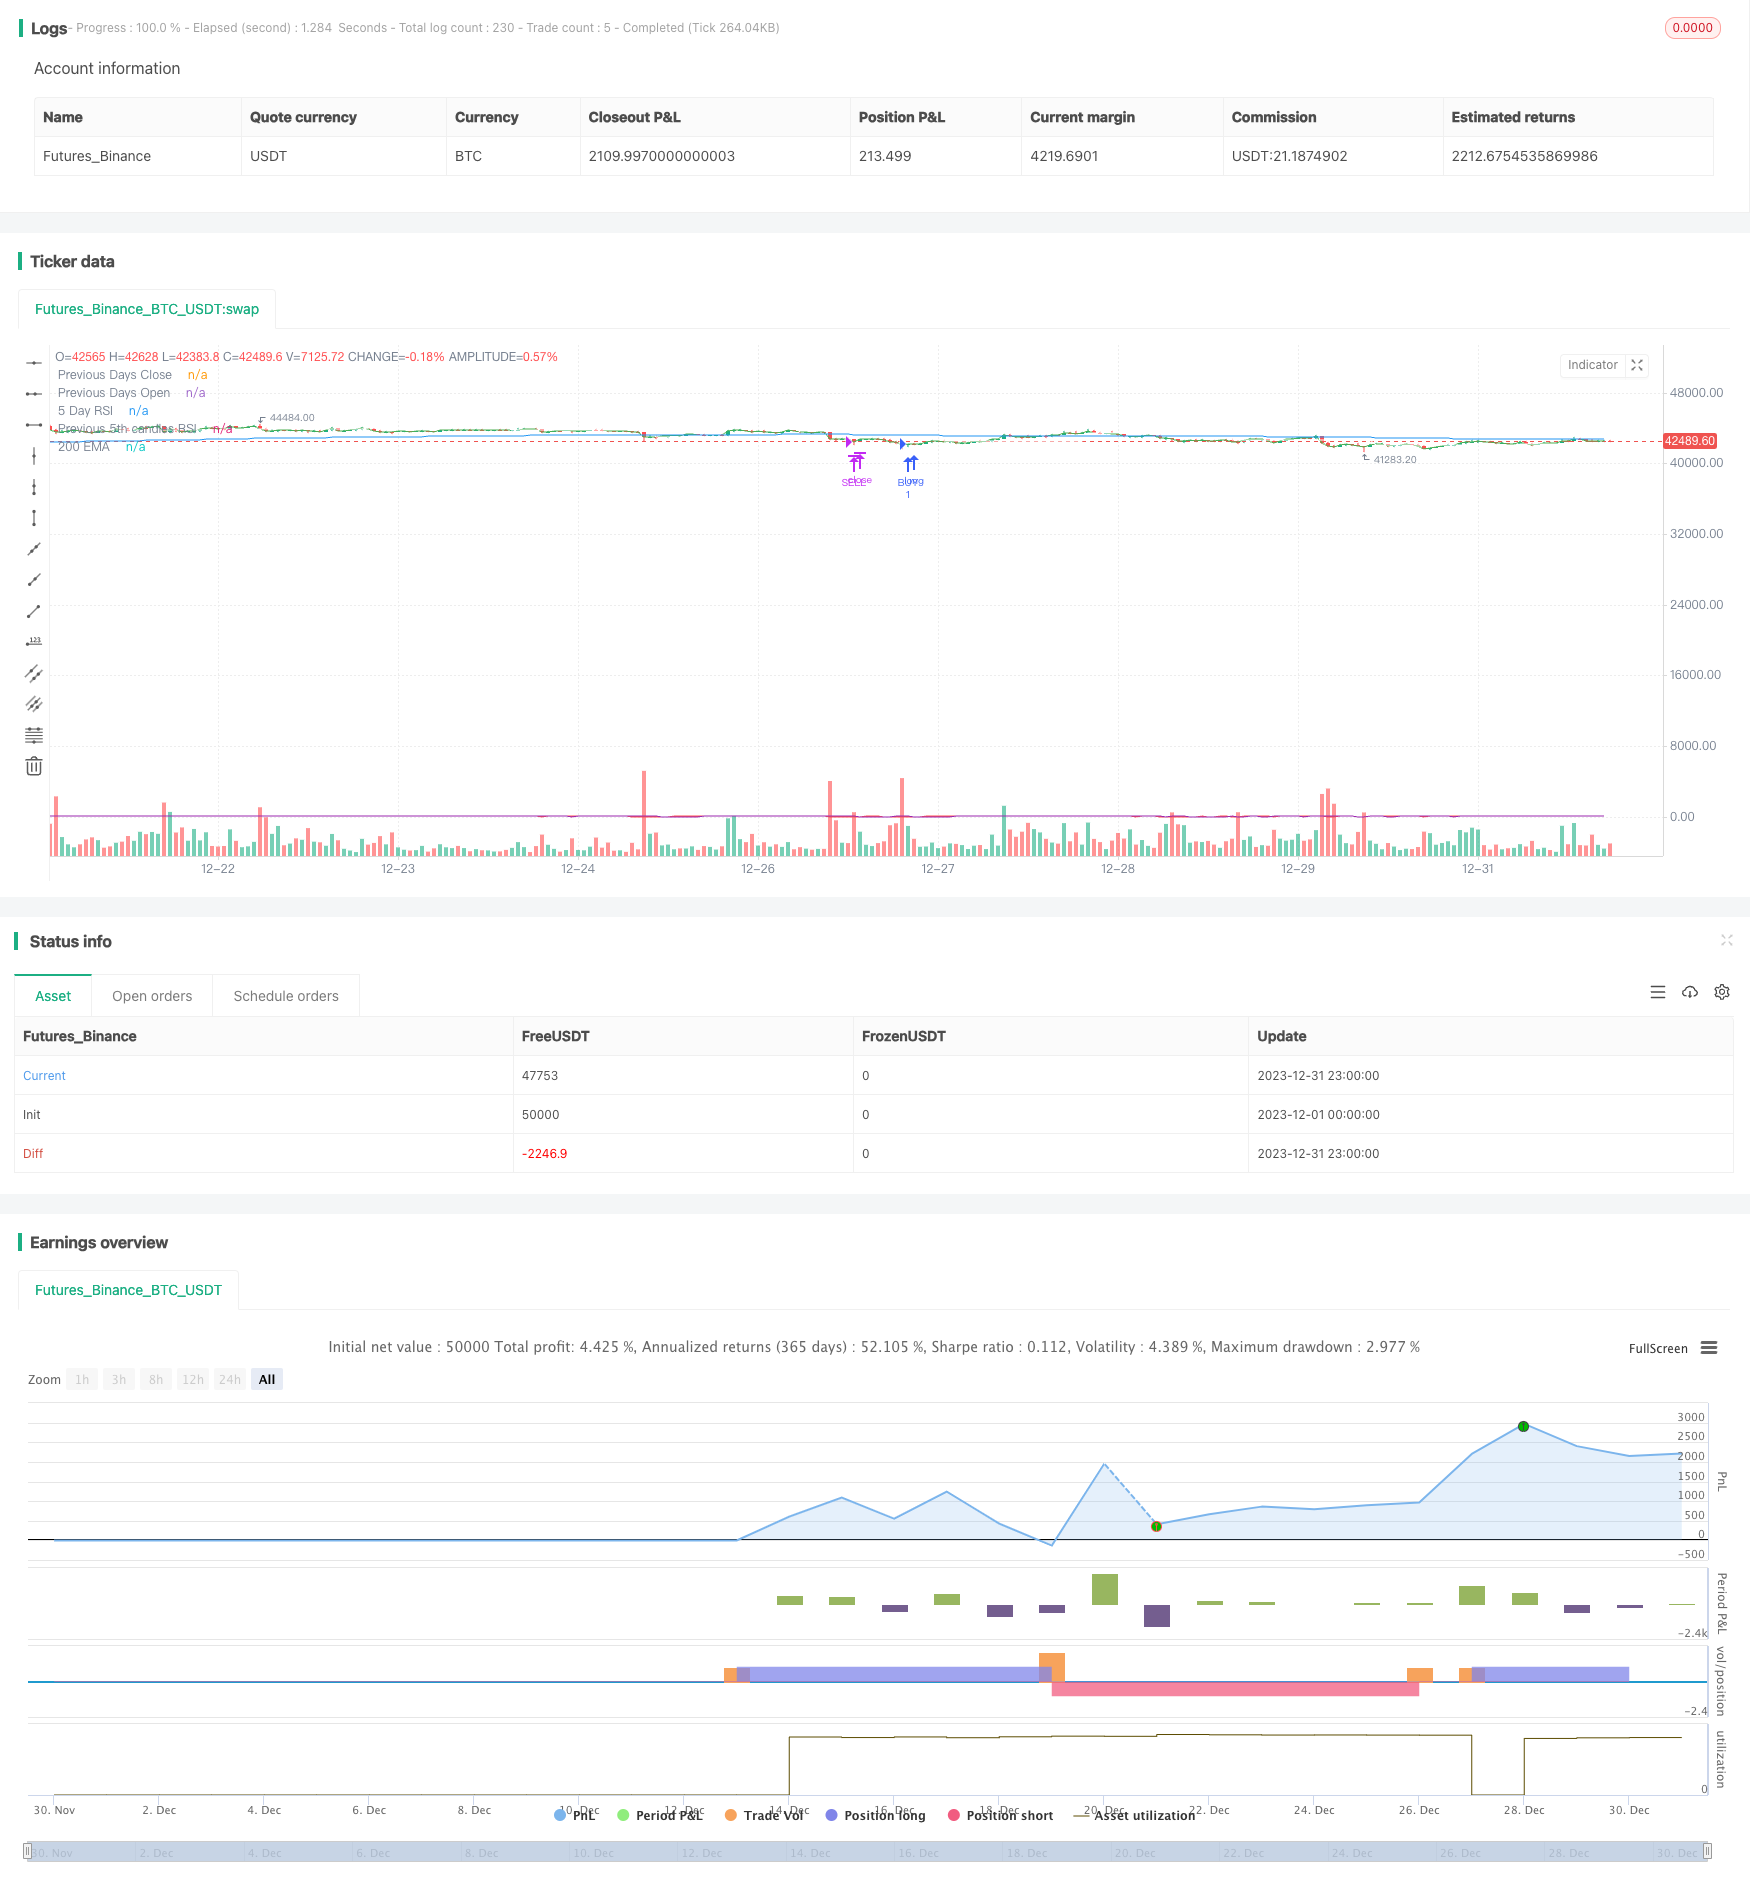
/*backtest
start: 2023-12-01 00:00:00
end: 2023-12-31 23:59:59
period: 1h
basePeriod: 15m
exchanges: [{"eid":"Futures_Binance","currency":"BTC_USDT"}]
*/

// This source code is subject to the terms of the Mozilla Public License 2.0 at https://mozilla.org/MPL/2.0/
// ©chewyScripts.

//@version=5
strategy("96er RSI+200EMA Strategy + Alerts", overlay=true, shorttitle = "The old 96er - RSI5 + 200 EMA")
//,use_bar_magnifier=false
// This works best on a small account $100, with 50% of equity and up to 10 max open trades.
// 96% Profitable, turns $100 into $350 in 1 month. very few losses. super happy with it.
// So far it triples the account on a 1m chart in 1 month back testing on the SEI-USD pair.
// I did not test on FX pairs or other instruments.
// had some issues with the inputs not working so had to hard code some, also the lastClose var sometimes breaks and starts following every candle, not sure why.

in_r1 = input.int(8,"5 day input or RSI1", group = "Signals")
in_lowerRSI = input.int(28,"RSI Lower", group = "Signals")
in_upperRSI = input.int(72,"RSI Upper ", group = "Signals")
in_emaperiod = input.int(200,"EMA Period", group = "Signals")
in_daysback = input.int(1,"Look back days for close/open", group = "Signals")

in_openOrders = input.int(5,"max open orders",tooltip = "Be careful, to high and you will get margin called!! 5 is probably the highest you should go", group = "Order Controls")
in_buybreakout = input.int(40,"Buy breakout range", group = "Order Controls")

in_buyTP = input.float(1.1500,"Buy TP: 1+TP %, .05 seems to work well.", group = "TPSL")
in_sellTP = input.float(0.9750, "Sell TP: 1-TP%. .025 seems to work well. ", group = "TPSL")

in_useAlerts = input.bool(false,"Turns on Buy/Sell Alerts",group = "Alerts")
in_useCustomAlertMSG = input.bool(false,"Use default Buy/Sell or the messages below",group = "Alerts")
in_alertBuySignalTxt = input("Buy","Buy signal API/TXT message template", tooltip = "Review the UserGuid on JSON varibles in alerts", group = "Alerts")
in_alertSellSignalTxt = input("Sell","Sell signal API/TXT message template", tooltip = "Review the UserGuid on JSON varibles in alerts", group = "Alerts")

simple int rsi5 = in_r1

// 3 rsi strategy , when all of them are overbought we sell, and vice versa
rsi7 = ta.rsi(close,rsi5)
[lastOpen, lastClose] = request.security(syminfo.tickerid, "D", [open,close], lookahead = barmerge.lookahead_on)
rsi3 = ta.rsi(close[5],rsi5)

ma = ta.ema(close,in_emaperiod)

plot(rsi7,"5 Day RSI",color.red)
plot(lastClose,"Previous Days Close",color.green)
plot(lastOpen,"Previous Days Open",color.white)
plot(rsi3,"Previous 5th candles RSI",color.purple)
plot(ma,"200 EMA",color.blue)


//sell = ta.crossunder(rsi7,70) and ta.crossunder(rsi14,70) and ta.crossunder(rsi21,70)
//buy = ta.crossover(rsi7,in_lowerRSI) and close < ma and rsi3 <= in_upperRSI and strategy.opentrades < in_openOrders
//sell = ta.crossunder(rsi7,in_upperRSI) and close > ma and rsi3 >= in_lowerRSI3 and strategy.opentrades < in_openOrders

//buy condition
buy = ta.crossover(rsi7,in_lowerRSI) and close < ma and close < lastClose and strategy.opentrades < in_openOrders

// sell condition
sell = ta.crossunder(rsi7,in_upperRSI) and close > ma and close > lastClose and strategy.opentrades < in_openOrders


var lastBuy = close
var lastSell = close
//var buyLabel = label.new(na,na,yloc = yloc.belowbar, style = label.style_none, textcolor = color.green, size = size.normal)
//var sellLabel = label.new(na,na,yloc = yloc.abovebar, style = label.style_none, textcolor = color.red, size = size.normal)
if (buy)
    strategy.entry("BUY", strategy.long,alert_message = "Buy @"+str.tostring(close))
    lastBuy := close
    //buyLabel := label.new(na,na,yloc = yloc.belowbar, style = label.style_none, textcolor = color.green, size = size.normal)
    //label.set_x(buyLabel,bar_index)
    //label.set_y(buyLabel,low)
    //label.set_text(buyLabel,"Buy!!@ " +str.tostring(lastBuy)  + "\n TP: " + str.tostring(lastBuy*in_buyTP) + "\n↑")
    if(not in_useAlerts)
        alert("Buy")

//label.delete(buyLabel)

if ((close >= lastBuy*in_buyTP ) or (rsi7 > in_buybreakout) and close >= lastClose and (close >= lastClose*in_buyTP or close >= lastBuy*in_buyTP ) )
    //label.new(bar_index,na,"TP!!@ " +str.tostring(close), yloc = yloc.abovebar, style = label.style_none, textcolor = color.green, size = size.normal)
    strategy.close("BUY", "BUY Exit",alert_message = "Buy Exit: TP @" +str.tostring(close) + " OR TP: " + str.tostring(lastBuy*in_buyTP))
    if(not in_useAlerts)
        alert("Buy Exit")

if (sell)
    strategy.entry("SELL", strategy.short, alert_message = "Sell @ " + str.tostring(close))
    lastSell := close
    //sellLabel := label.new(na,na,yloc = yloc.abovebar, style = label.style_none, textcolor = color.red, size = size.normal)
    //label.set_x(sellLabel,bar_index)
    //label.set_y(sellLabel,high)
    //label.set_text(sellLabel,"Sell!!@ " +str.tostring(lastSell)  + "\n TP: " + str.tostring(lastSell*in_sellTP) + "\n🠇")
    if(not in_useAlerts)
        alert("Sell")

//label.delete(sellLabel)

if ( close < ma and (close <= lastSell*in_sellTP ) or (close < lastClose*in_sellTP) )
    //label.new(bar_index,na,"TP!!@ " +str.tostring(close), yloc = yloc.belowbar, style = label.style_none, textcolor = color.red, size = size.normal)
    strategy.close("SELL", "Sell Exit", alert_message = "Sell Exit TP @" +str.tostring(close) + " OR TP: " + str.tostring(lastSell*in_sellTP))
    if(not in_useAlerts)
        alert("Sell Exit")


alertcondition(buy and in_useAlerts,"Buy Alert","test")