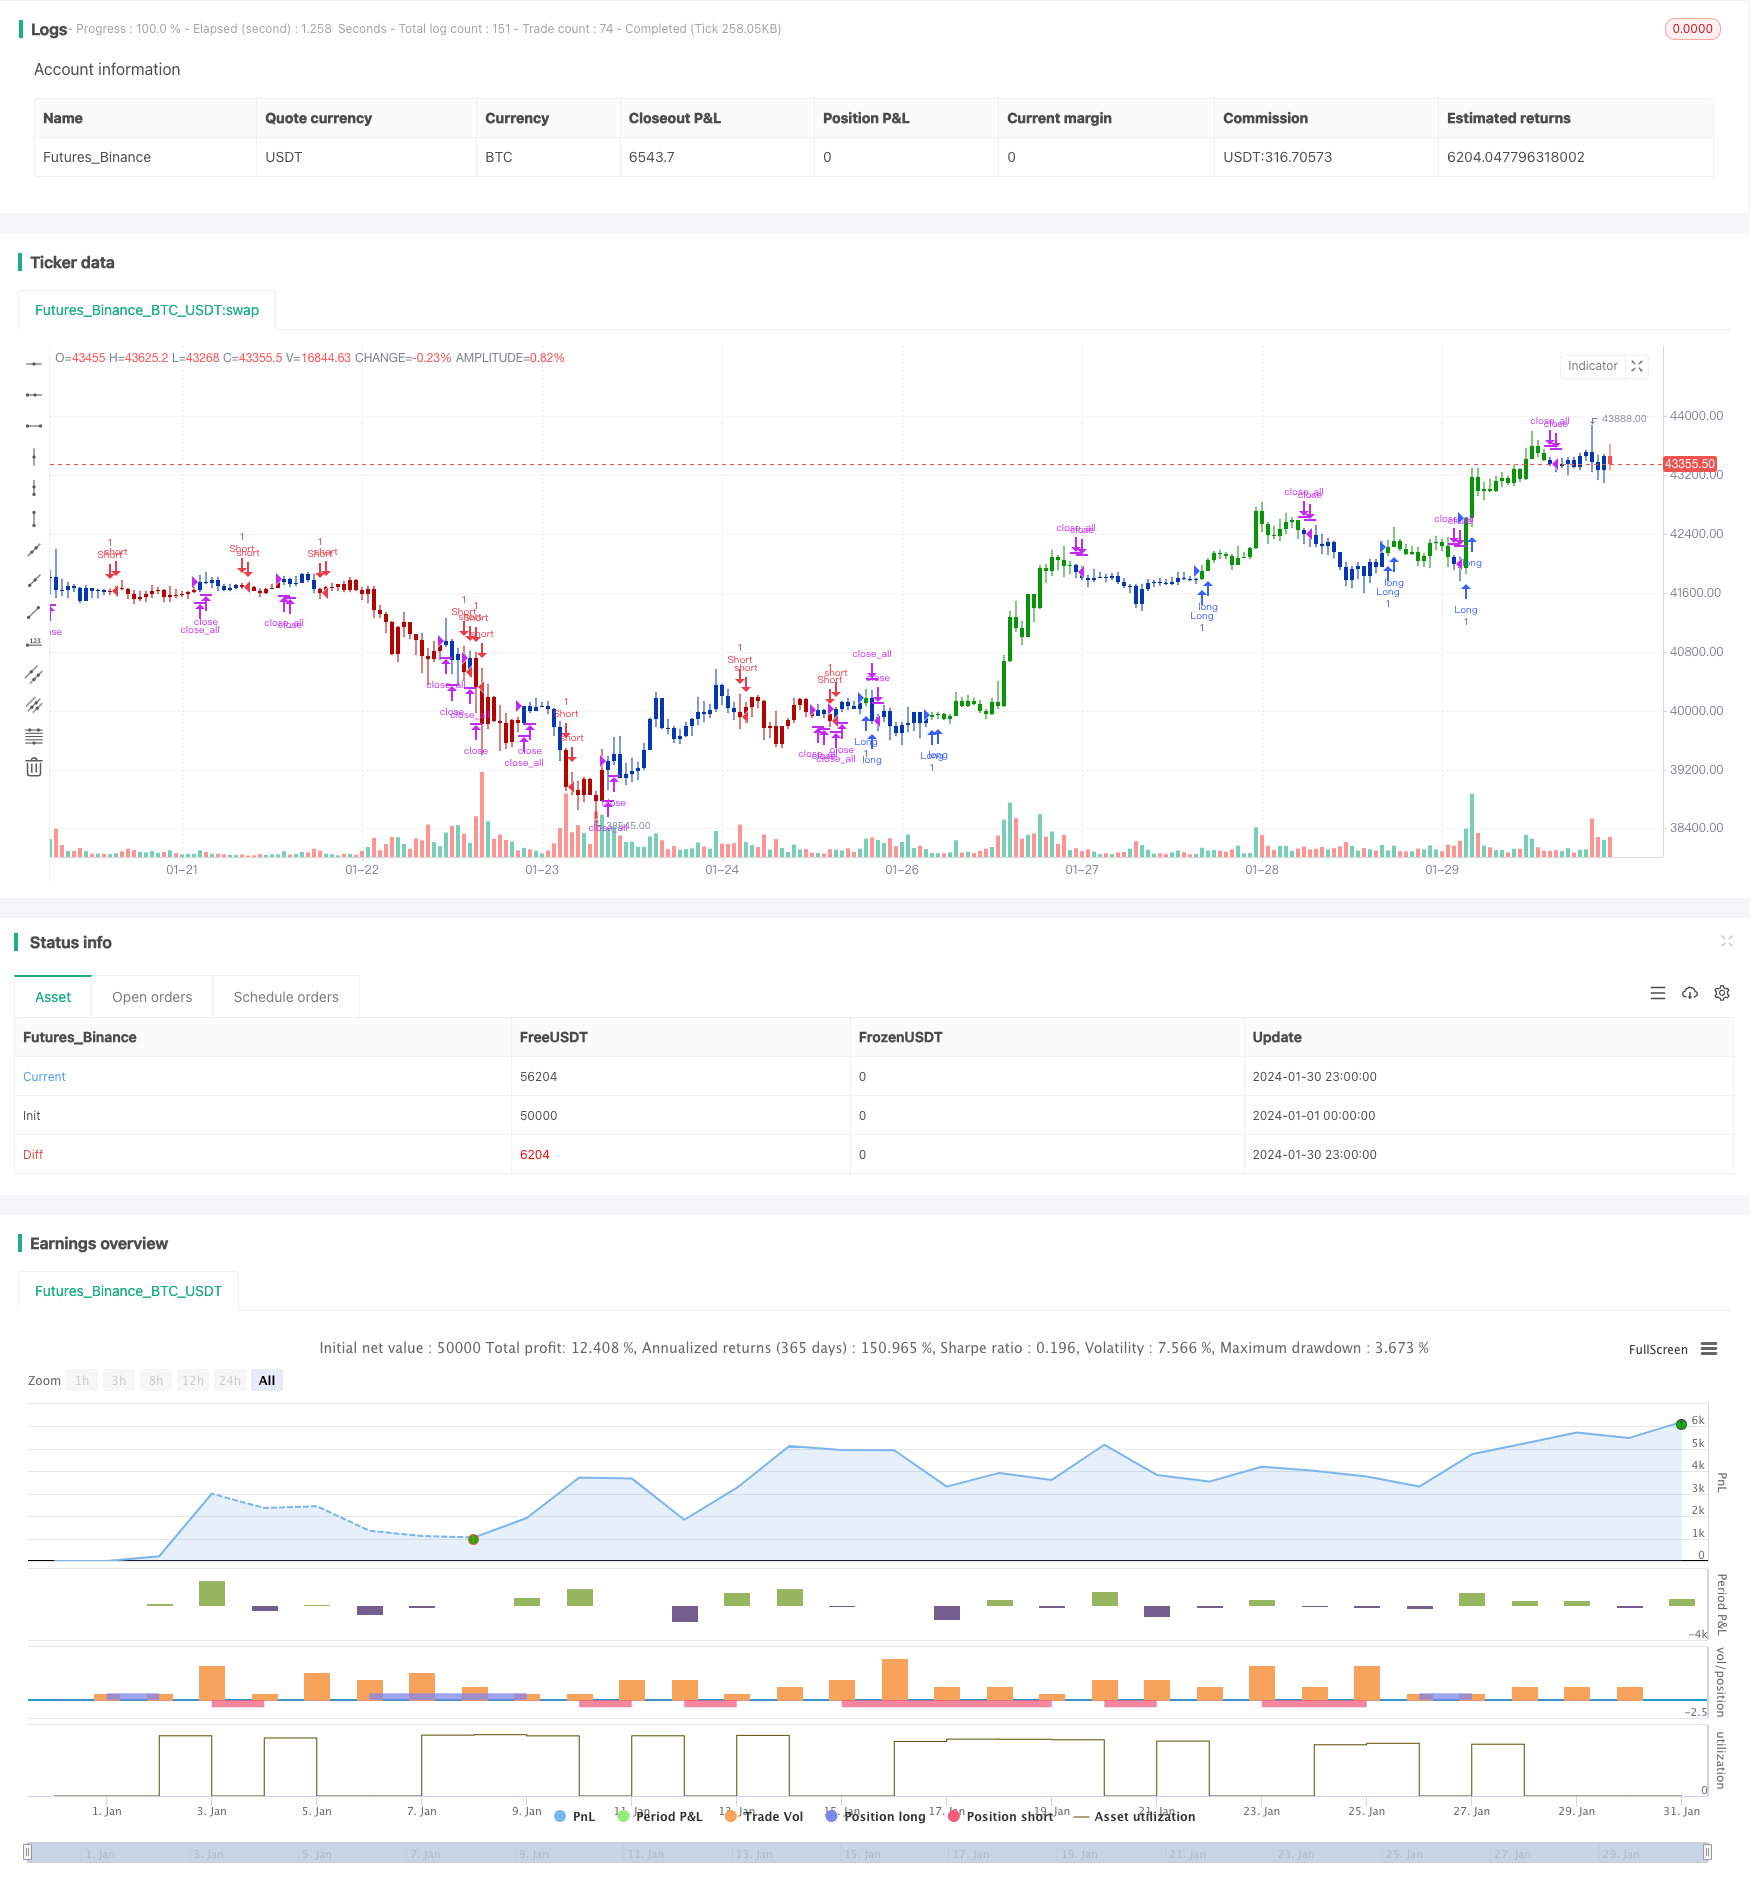
Momentum-Tracking-Strategie über verschiedene Zeiträume hinweg

Überblick
Die Strategie ermöglicht die Dynamikverfolgung über die Zeitrahmen hinweg durch die Kombination von 123 Reversals und MACD-Indikatoren. 123 Reversals beurteilen die kurzfristigen Trendwendepunkte, MACD beurteilt die mittelfristigen Trends, die beide in Kombination mit dem Erreichen einer kurzfristigen Reversal und gleichzeitig mit dem Sperren von mittelfristigen Trendsignal kombiniert werden.
Strategieprinzip
Die Strategie besteht aus zwei Teilen:
123 Umkehrung: Die beiden aktuellen K-Linien bilden Hoch/Tief und erzeugen ein Kauf/Verkauf-Signal, wenn der zufällige Indikator unter/über 50 liegt.
MACD-Teil: Ein Kaufsignal wird erzeugt, wenn die Schnelllinie die Langleine durchbricht, und ein Verkaufssignal wird erzeugt, wenn die Schnelllinie die Langleine durchbricht.
Schließlich kombiniert man die beiden, d.h. das MACD erzeugt ein Endsignal, wenn gleichzeitig mit der Umkehrung von 123 auch ein synchrones Signal erzeugt wird.
Analyse der Stärken
Die Strategie kombiniert kurzfristige Umkehrungen und mittelfristige Trends und ermöglicht es, mittelfristige Trends in kurzfristigen Schwankungen zu verriegeln und so eine höhere Gewinnrate zu erzielen. Besonders in bewegten Situationen kann mit 123 Umkehrungen ein Teil des Geräusches ausgelöscht werden, um die Stabilität zu verbessern.
Durch die Anpassung der Parameter kann das Verhältnis zwischen den Umkehrsignalen und den Trendsignalen ausgeglichen werden, um den unterschiedlichen Marktbedingungen gerecht zu werden.
Risikoanalyse
Die Strategie hat eine gewisse Zeitverzögerung, insbesondere bei langfristigen MACDs, und kann kurzfristige Ereignisse verpassen. Außerdem ist das Umkehrsignal selbst zu einem gewissen Grad zufällig und leicht zu erfassen.
Die MACD-Zyklen können entsprechend verkürzt oder die Stop-Loss-Rate erhöht werden, um das Risiko zu kontrollieren.
Optimierungsrichtung
Diese Strategie kann in folgenden Bereichen optimiert werden:
Anpassung der 123 Umkehrparameter zur Optimierung der Umkehrwirkung
Anpassung von MACD-Parametern zur Optimierung von Trendbeurteilungen
Erhöhung der Effektivität durch Filterung anderer Hilfsindikatoren
Erhöhung der Stop-Loss-Strategie und Risikokontrolle
Zusammenfassen
Diese Strategie integriert mehrere Parameter und technische Indikatoren für mehrere Zeiträume und balanciert die Vorteile von Reversal- und Trendhandel durch die Verfolgung von Dynamiken über Zeiträume. Die Ausgleichswirkung kann durch Parameter angepasst werden und es ist eine sehr potenzielle Strategie, mehr Indikatoren oder Stopps einzuführen, um zu optimieren.
/*backtest
start: 2024-01-01 00:00:00
end: 2024-01-31 00:00:00
period: 1h
basePeriod: 15m
exchanges: [{"eid":"Futures_Binance","currency":"BTC_USDT"}]
*/

//@version=4
////////////////////////////////////////////////////////////
//  Copyright by HPotter v1.0 28/01/2021
// This is combo strategies for get a cumulative signal.
//
// First strategy
// This System was created from the Book "How I Tripled My Money In The
// Futures Market" by Ulf Jensen, Page 183. This is reverse type of strategies.
// The strategy buys at market, if close price is higher than the previous close
// during 2 days and the meaning of 9-days Stochastic Slow Oscillator is lower than 50.
// The strategy sells at market, if close price is lower than the previous close price
// during 2 days and the meaning of 9-days Stochastic Fast Oscillator is higher than 50.
//
// Second strategy
// MACD – Moving Average Convergence Divergence. The MACD is calculated
// by subtracting a 26-day moving average of a security's price from a
// 12-day moving average of its price. The result is an indicator that
// oscillates above and below zero. When the MACD is above zero, it means
// the 12-day moving average is higher than the 26-day moving average.
// This is bullish as it shows that current expectations (i.e., the 12-day
// moving average) are more bullish than previous expectations (i.e., the
// 26-day average). This implies a bullish, or upward, shift in the supply/demand
// lines. When the MACD falls below zero, it means that the 12-day moving average
// is less than the 26-day moving average, implying a bearish shift in the
// supply/demand lines.
// A 9-day moving average of the MACD (not of the security's price) is usually
// plotted on top of the MACD indicator. This line is referred to as the "signal"
// line. The signal line anticipates the convergence of the two moving averages
// (i.e., the movement of the MACD toward the zero line).
// Let's consider the rational behind this technique. The MACD is the difference
// between two moving averages of price. When the shorter-term moving average rises
// above the longer-term moving average (i.e., the MACD rises above zero), it means
// that investor expectations are becoming more bullish (i.e., there has been an
// upward shift in the supply/demand lines). By plotting a 9-day moving average of
// the MACD, we can see the changing of expectations (i.e., the shifting of the
// supply/demand lines) as they occur.
//
// WARNING:
// - For purpose educate only
// - This script to change bars colors.
////////////////////////////////////////////////////////////
Reversal123(Length, KSmoothing, DLength, Level) =>
    vFast = sma(stoch(close, high, low, Length), KSmoothing)
    vSlow = sma(vFast, DLength)
    pos = 0.0
    pos := iff(close[2] < close[1] and close > close[1] and vFast < vSlow and vFast > Level, 1,
	         iff(close[2] > close[1] and close < close[1] and vFast > vSlow and vFast < Level, -1, nz(pos[1], 0)))
	pos

MACD(fastLength,slowLength,signalLength) =>
    pos = 0.0
    fastMA = ema(close, fastLength)
    slowMA = ema(close, slowLength)
    macd = fastMA - slowMA
    signal = sma(macd, signalLength)
    pos:= iff(signal < macd , 1,
	       iff(signal > macd, -1, nz(pos[1], 0)))
    pos

strategy(title="Combo Backtest 123 Reversal & MACD Crossover", shorttitle="Combo", overlay = true)
line1 = input(true, "---- 123 Reversal ----")
Length = input(14, minval=1)
KSmoothing = input(1, minval=1)
DLength = input(3, minval=1)
Level = input(50, minval=1)
//-------------------------
fastLength = input(8, minval=1)
slowLength = input(16,minval=1)
signalLength=input(11,minval=1)
xSeria = input(title="Source", type=input.source, defval=close)
reverse = input(false, title="Trade reverse")
posReversal123 = Reversal123(Length, KSmoothing, DLength, Level)
posMACD = MACD(fastLength,slowLength, signalLength)
pos = iff(posReversal123 == 1 and posMACD == 1 , 1,
	   iff(posReversal123 == -1 and posMACD == -1, -1, 0))
possig = iff(reverse and pos == 1, -1,
          iff(reverse and pos == -1 , 1, pos))
if (possig == 1)
    strategy.entry("Long", strategy.long)
if (possig == -1)
    strategy.entry("Short", strategy.short)
if (possig == 0)
    strategy.close_all()
barcolor(possig == -1 ? #b50404: possig == 1 ? #079605 : #0536b3 )