Dynamische Preiskanal-Stop-Loss-Trailing-Strategie
Überblick
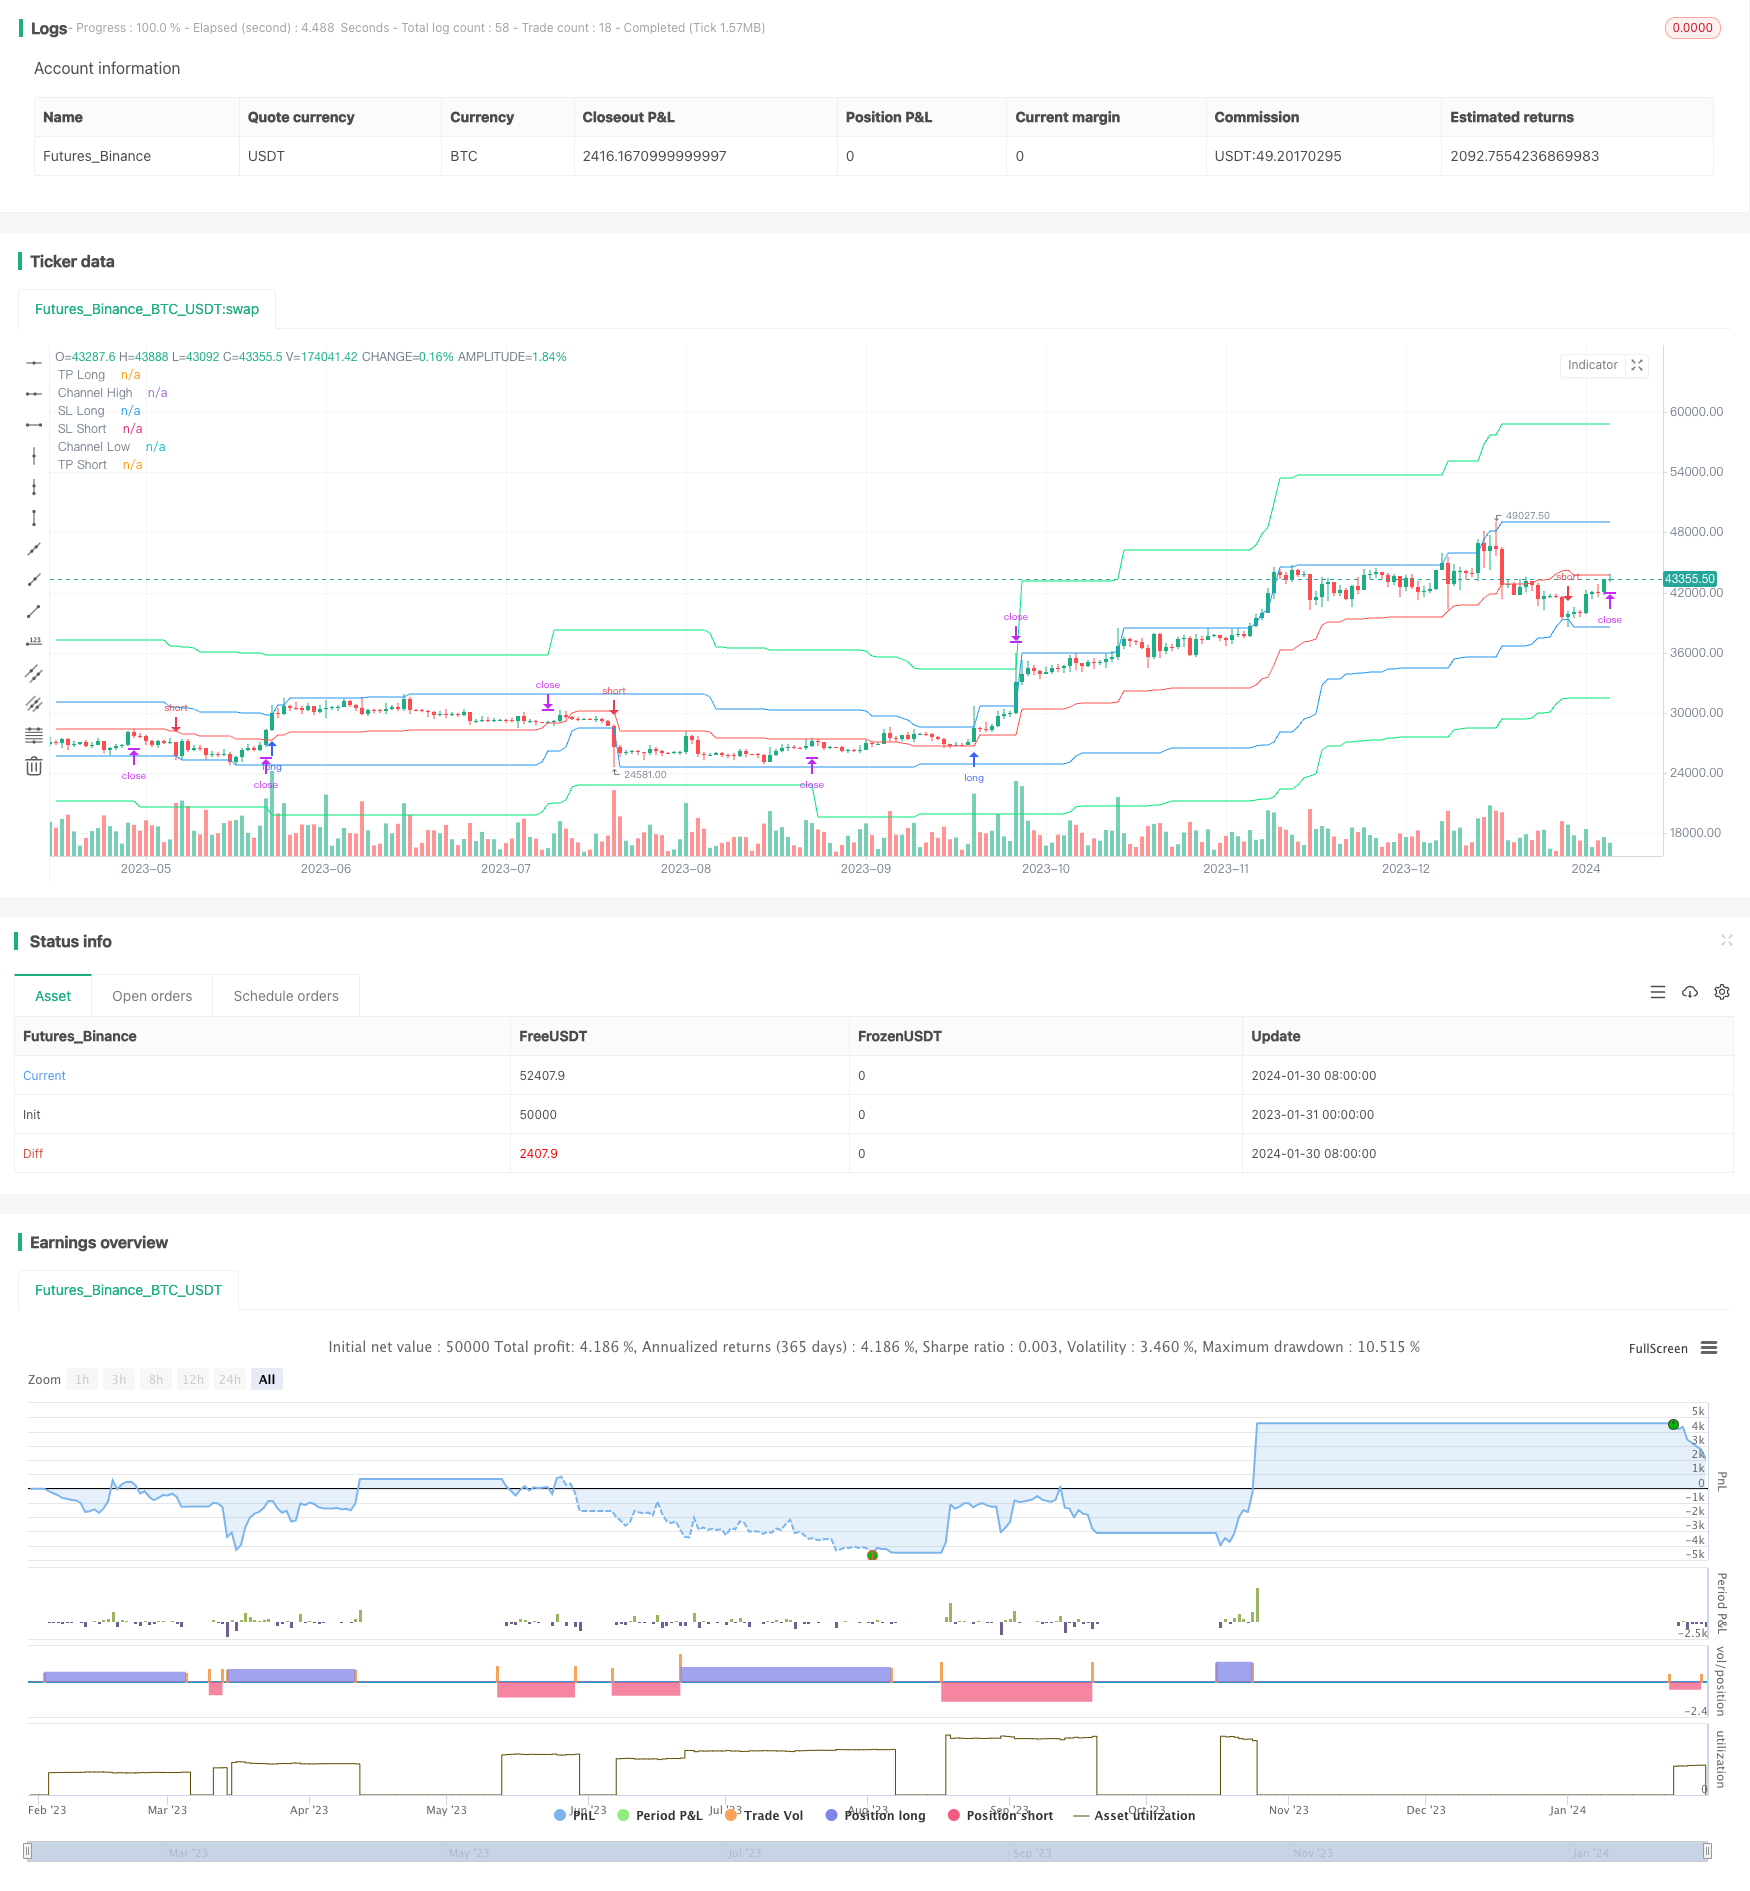
Die Strategie basiert auf der Entwicklung des Donchian Price Channel Indicators. Der Indikator bildet einen Preiskanal, indem er die höchsten und niedrigsten Preise innerhalb eines bestimmten Zeitraums berechnet. Die Strategie nutzt den Preiskanal, um einen wechselseitigen Handel zu ermöglichen, und legt einen Stop-Loss- und einen Stop-Stop-Preis fest.
Strategieprinzip
Zuerst berechnet die Strategie die oberen und unteren Grenzen h und l der Preiskanal auf Basis des Parameters pclen ⋅ der Mittelpunkt ist der Mittelwert der oberen und unteren Grenzen des Preiskanals ⋅ dann berechnet sie den Stop-Preis tpl und tps auf Basis der Stopp-Parameter für die Long- und die Short-Position ⋅ der Stop-Loss-Preis wird als Mittelpunkt des Preiskanals festgelegt ⋅ wenn der Preis den Preiskanal durchbricht, berechnet die Strategie die Positionen in verschiedenen Richtungen auf Basis der Risikogröße risklong und riskshort ⋅ die Strategie wird die Position plattieren, wenn der Preis wieder in den Kanal eintritt ⋅ außerdem wurde ein Zeitüberschreiten eingestellt, das nur innerhalb der angegebenen Zeiträume handelt ⋅
Die Transaktionslogik lautet wie folgt:
Mehrpositions-Signal: Der Preis ist größer als die Kanalobergrenze h und geht zurück in den Kanal, um mehr Positionen zu eröffnen Mehrpositions-Plating-Signal: Mehrpositions-Plating, wenn der Preis unterhalb der mittleren Linie des Kanals Center (stop loss) oder über dem Stop-Price tpl (stop loss) liegt
Leerlager-Signal: Der Preis liegt unter der unteren Grenze des Kanals l und fällt zurück in den Kanal, wenn der Lagerplatz frei ist Leerpositions-Leerpositionssignal: Leerpositionen, wenn der Preis über der Mittellinie Center (stop loss) oder unter dem Stop-Price tps (stop loss) liegt
Analyse der Stärken
Diese Strategie hat folgende Vorteile:
- Zwei-Wege-Handel, um eine Preisumkehr zu erfassen
- Der Preiskanal wird genutzt, um Trends zu bestimmen und falsche Durchbrüche zu vermeiden.
- Setzen Sie Stop-Loss und kontrollieren Sie die Risiken
- Berechnen Sie die Größe der Positionen in Bezug auf das Risiko, um das Risiko zu kontrollieren
- Stop-Loss-Tracking ermöglicht mehr Gewinne
Risikoanalyse
Es gibt einige Risiken bei dieser Strategie:
- Eine falsche Einstellung der Preiskanalparameter kann zu einer zu hohen Handelsfrequenz oder verpassten Handelschancen führen
- Eine übermäßige Toleranz bei den Stop-Loss-Preisen könnte die Risikolocke erhöhen.
- Tracking-Stopps können in Zeiten hoher Schwankungen vorzeitig ausgelöst werden
Diese Risiken können durch Anpassung der Parameter und durch künstliche Überwachung verringert und kontrolliert werden.
Optimierungsrichtung
Die Strategie kann auch in folgenden Bereichen optimiert werden:
- Mehr Indikatoren zur Filterung und zur Vermeidung von häufigen Aus- und Aus-Positionen bei Störungen
- Verschiedene Stop-Loss-Algorithmen wie ATR-Stop-Loss können getestet werden
- Erweiterung des Handelssystems über die Zeiträume hinweg, um die Richtung der Trends mit Hilfe der höheren Zeiträume zu bestimmen
- Positionsmanagement-Modul hinzugefügt, um Positionen nach dem Verbrauch der Mittel anzupassen
- Die Erfolgsrate eines Preisbruchs wird in Kombination mit einem maschinellen Lernmodell beurteilt, um falsche Durchbrüche zu vermeiden.
Zusammenfassen
Diese Strategie ist im Allgemeinen eine effektive Methode, um mit dem Preiskanal-Indikator einen Zwei-Wege-Handel zu realisieren. Es enthält Stop-Loss- und Positionskontrollmodule, die das Risiko gut kontrollieren. Mit einer gewissen Optimierung und Anpassung kann es zu einer starken Quantifizierungs-Handelsstrategie werden.
/*backtest
start: 2023-01-31 00:00:00
end: 2024-01-31 00:00:00
period: 1d
basePeriod: 1h
exchanges: [{"eid":"Futures_Binance","currency":"BTC_USDT"}]
*/

//Noro
//2020

//@version=4
strategy(title = "Noro's RiskDonchian Strategy", shorttitle = "RiskDonchian str", overlay = true, default_qty_type = strategy.percent_of_equity, initial_capital = 100, default_qty_value = 100, commission_value = 0.1)

//Settings
needlong = input(true, defval = true, title = "Long")
needshort = input(true, defval = true, title = "Short")
tp = input(defval = 20.0, minval = 1, title = "Take-profit, %")
tptype = input(defval = "2. Fix", options = ["1. None", "2. Fix", "3. Trailing"], title = "Take-profit type")
sltype = input(defval = "2. Center", options = ["1. None", "2. Center"], title = "Take-profit type")
risklong  = input(5.0, minval = 0.0, maxval = 99.9, title = "Risk size for long, %")
riskshort = input(5.0, minval = 0.0, maxval = 99.9, title = "Risk size for short, %")
pclen = input(50, minval = 1, title = "Price Channel Length")
showll = input(true, defval = true, title = "Show lines")
showbg = input(false, defval = false, title = "Show Background")
showof = input(true, defval = true, title = "Show Offset")
showlabel = input(true, defval = true, title = "Show label")
fromyear = input(1900, defval = 1900, minval = 1900, maxval = 2100, title = "From Year")
toyear = input(2100, defval = 2100, minval = 1900, maxval = 2100, title = "To Year")
frommonth = input(01, defval = 01, minval = 01, maxval = 12, title = "From Month")
tomonth = input(12, defval = 12, minval = 01, maxval = 12, title = "To Month")
fromday = input(01, defval = 01, minval = 01, maxval = 31, title = "From day")
today = input(31, defval = 31, minval = 01, maxval = 31, title = "To day")

//Price Channel
h = highest(high, pclen)
l = lowest(low, pclen)
center = (h + l) / 2

//Take-profit
tpl = 0.0
tpl := tptype == "2. Fix" and strategy.position_size > 0 ? tpl[1] : h * (100 + tp) / 100

//Stop-loss
tps = 0.0
tps := tptype == "2. Fix" and strategy.position_size < 0 ? tps[1] : l * (100 - tp) / 100

//Lines
tplcol = showll and needlong and tptype != "1. None" ? color.lime : na
pclcol = showll and needlong ? color.blue : na
sllcol = showll and needlong and sltype != "1. None" ? color.red : na
tpscol = showll and needshort and tptype != "1. None" ? color.lime : na
pcscol = showll and needshort ? color.blue : na
slscol = showll and needshort and sltype != "1. None" ? color.red : na
offset = showof ? 1 : 0
plot(tpl, offset = offset, color = tplcol, title = "TP Long")
plot(h, offset = offset, color = pclcol, title = "Channel High")
plot(center, offset = offset, color = sllcol, title = "SL Long")
plot(center, offset = offset, color = slscol, title = "SL Short")
plot(l, offset = offset, color = pcscol, title = "Channel Low")
plot(tps, offset = offset, color = tpscol, title = "TP Short")

//Background
size = strategy.position_size
bgcol = showbg == false ? na : size > 0 ? color.lime : size < 0 ? color.red : na
bgcolor(bgcol, transp = 70)

//Lot size
risksizelong = -1 * risklong
risklonga = ((center / h) - 1) * 100
coeflong = abs(risksizelong / risklonga)
lotlong = (strategy.equity / close) * coeflong
risksizeshort = -1 * riskshort
riskshorta = ((center / l) - 1) * 100
coefshort = abs(risksizeshort / riskshorta)
lotshort = (strategy.equity / close) * coefshort

//Trading
truetime = time > timestamp(fromyear, frommonth, fromday, 00, 00) and time < timestamp(toyear, tomonth, today, 23, 59)
mo = 0
mo := strategy.position_size != 0 ? 0 : high >= center[1] and low <= center[1] ? 1 : mo[1]

if h > 0
    longlimit = tptype == "1. None" ? na : tpl
    longstop = sltype == "1. None" ? na : center
    strategy.entry("Long", strategy.long, lotlong, stop = h, when = strategy.position_size <= 0 and needlong and truetime and mo)
    strategy.exit("TP Long", "Long", limit = longlimit, stop = longstop)
    shortlimit = tptype == "1. None" ? na : tps
    shortstop = sltype == "1. None" ? na : center
    strategy.entry("Short", strategy.short, lotshort, stop = l, when = strategy.position_size >= 0 and needshort and truetime and mo)
    strategy.exit("Exit Short", "Short", limit = shortlimit, stop = shortstop)
if time > timestamp(toyear, tomonth, today, 23, 59)
    strategy.close_all()
    strategy.cancel("Long")
    strategy.cancel("Short")

if showlabel

    //Drawdown
    max = 0.0
    max := max(strategy.equity, nz(max[1]))
    dd = (strategy.equity / max - 1) * 100
    min = 100.0
    min := min(dd, nz(min[1]))

    //Label
    min := round(min * 100) / 100
    labeltext = "Drawdown: " + tostring(min) + "%"
    var label la = na
    label.delete(la)
    tc = min > -100 ? color.white : color.red
    osx = timenow + round(change(time)*10)
    osy = highest(100)