Auf Momentum basierende Breakout-Trading-Strategie
Überblick
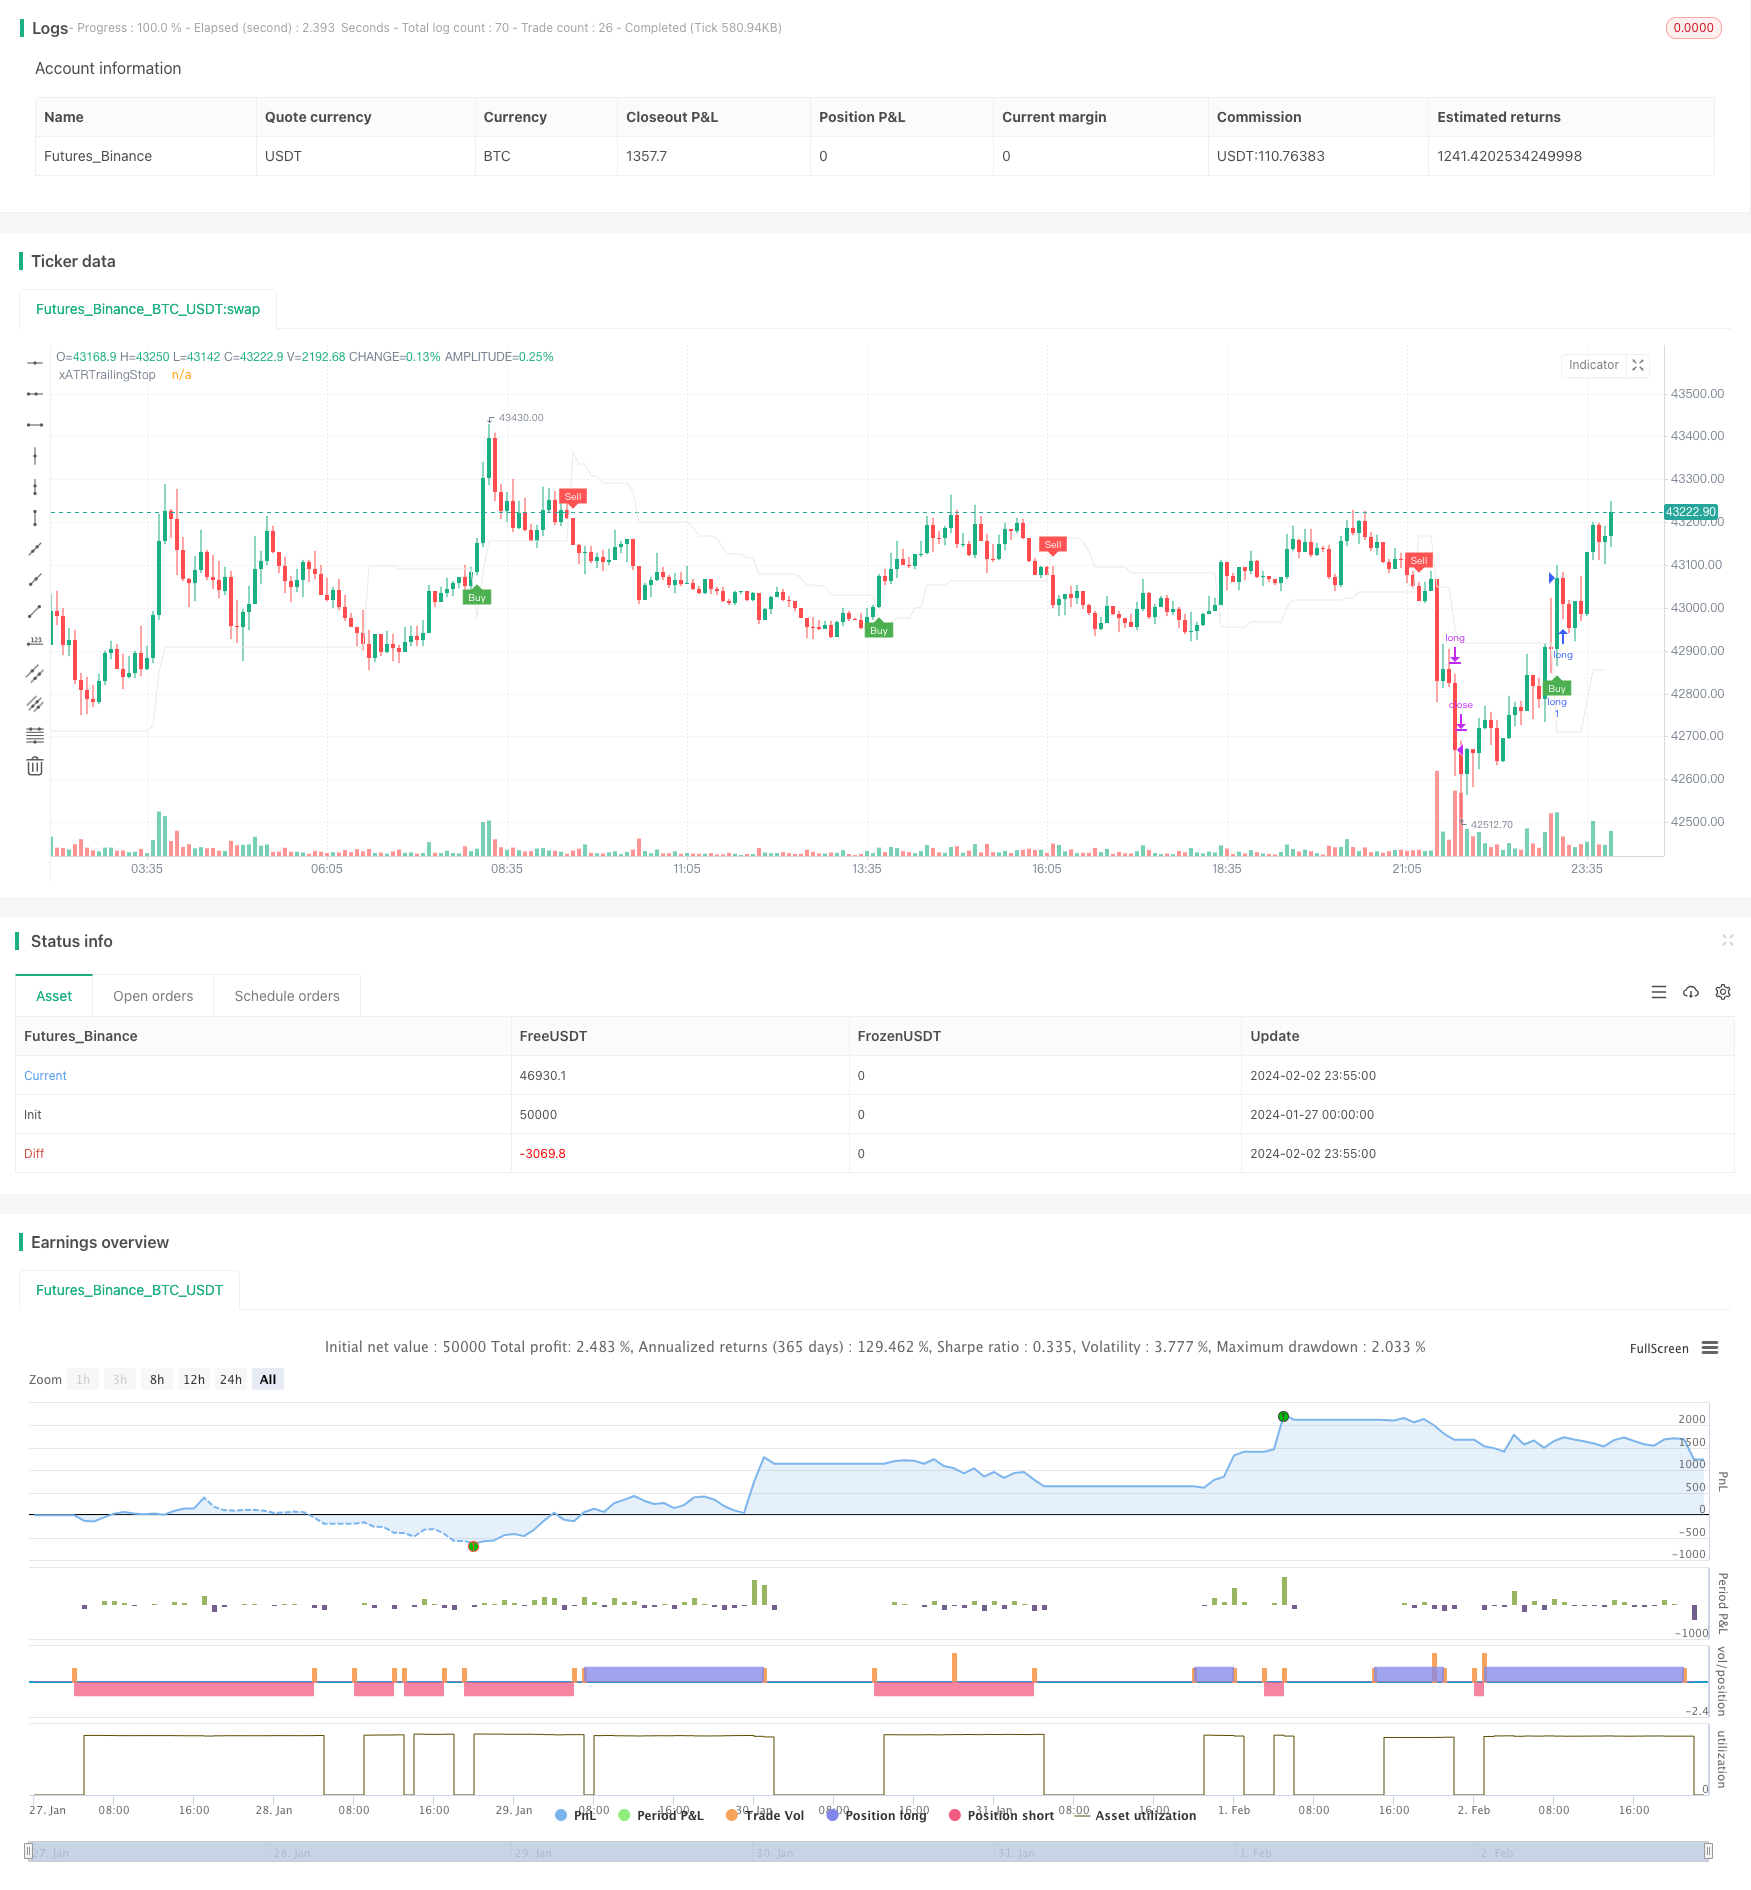
Die Strategie ist eine Breakout-Handelsstrategie, die auf dynamischen Indikatoren basiert. Sie verwendet mehrere Indikatoren wie die Durchschnittslinie, die ATR und den RSI, um die Markttrends und die Volatilität zu beurteilen, in Kombination mit strengen Stop-Loss-Einstellungen. Die Strategie entscheidet hauptsächlich darüber, ob der Preis die Auf- oder Abwärts-Durchschnittslinie durchbricht, um ein Handelssignal zu erzeugen.
Strategieprinzip
Die Strategie basiert hauptsächlich auf folgenden Punkten:
Die EMA-Durchschnittslinie wird verwendet, um die Richtung der Preisentwicklung zu bestimmen. Die Durchschnittslinie oben ist ein bullish Signal und unten ein bearish Signal.
Der ATR-Indikator beurteilt die Marktschwankungen. ATR wird mit einem Faktor als Stop-Loss-Range multipliziert. Dies kann die Einzelschäden wirksam kontrollieren.
Der RSI-Indikator beurteilt Überkauf und Überverkauf. Der ATR-Stopp- und der Durchschnittswert-Bruch muss ausgelöst werden, wenn der RSI nicht überkauft und nicht überverkauft wird. Dies verhindert einen Falschbruch.
Verwenden Sie frühere Höhen oder Tiefen als Basis für den Stop-Off. Tracking Stop-Off-Preise kann mehr Gewinne erzielen.
Strenge Stop-Loss-Regeln. ATR-Stopp-Loss in Kombination mit Volatilitätsindikatoren kann das Risiko steuern, die Stop-Setting kann den Gewinn sperren.
Das Eintrittssignal ist der Preisbruch der Durchschnittslinie plus der ATR-Stopp-Bereich. Wenn es ein bullish Signal ist, dann muss der Preis den Höchststand überqueren; wenn es ein bearish Signal ist, dann muss der Preis den Tiefstand überqueren.
Analyse der Stärken
Diese Strategie hat folgende Vorteile:
Mehrfaches Urteilsvermögen verhindert falsche Durchbrüche und erhöht Signalgenauigkeit
ATR Stop-Loss-Range-Einstellungen, die den Schaden auf einem vernünftigen Niveau halten
Dynamische Tracking-Stopps maximieren den Gewinn
Strenge Stop-Loss-Regeln helfen bei der Risikokontrolle
Große Optimierungsmöglichkeiten für Indikatoren und Parameter, die sich an unterschiedliche Märkte anpassen lassen
Risikoanalyse
Die Strategie birgt auch folgende Risiken:
Die Gewinnfähigkeit hängt von der Marktfluktuation ab. Der Gewinnraum ist begrenzt, wenn die Markttrends unbekannt sind oder die Zeiträume lang sind.
Es kann ein erneuter Durchbruch nach einem Stopppreis-Schwanken auftreten. Dies führt dazu, dass es nicht möglich ist, die Position rechtzeitig aufzubauen und die Trends zu verfolgen. Der Stopppreis kann entsprechend gelockert werden.
chasing。
Optimierungsrichtung
Diese Strategie kann in folgenden Bereichen optimiert werden:
Durchschnittslinieparameter, ATR-Parameter usw. werden je nach Sorte und Periode angepasst.
Es ist möglich, weitere Indikatoren einzuführen, wie MACD, KDJ und andere, um zu überkaufen und zu verkaufen.
Der Stop-Loss-Koeffizient kann in Echtzeit an den ATR-Wert angepasst werden. Damit ist der Stop-Loss besser an die Marktschwankungen angepasst.
Eine Kombination aus mehreren Zeitperioden. Die Kombination verschiedener Periodenindikatoren kann die Signalqualität verbessern.
Die Methode verwendet maschinelle Lerntechnologien, um Kennzahlen und Parameter zu testen und zu optimieren, um die Strategieparameter zu optimieren.
Zusammenfassen
Die Strategie als Ganzes ist eine Breakout-Trading-Strategie, die Indikatoren nutzt, um zu beurteilen, und die Verluststopps streng hält. Sie nutzt die Vorteile von Indikatoren wie die Mittellinie, ATR und RSI, um die Richtung der Markttrends zu beurteilen. In Kombination mit einer strengen Stop-Loss-Setup, die die Risiken kontrolliert, während die Trends profitabel sind.
/*backtest
start: 2024-01-27 00:00:00
end: 2024-02-03 00:00:00
period: 5m
basePeriod: 1m
exchanges: [{"eid":"Futures_Binance","currency":"BTC_USDT"}]
*/

//@version=4
strategy(title="UT Bot Strategy", overlay = true)
//CREDITS to HPotter for the orginal code. The guy trying to sell this as his own is a scammer lol.
// Inputs
emaLengh = input(2, title = "emaLengh")
a = input(3.0,     title = "Key Vaule. 'This changes the sensitivity'")
c = input(10,    title = "ATR Period")
h = input(false, title = "Signals from Heikin Ashi Candles")
emaLengh2 = input(9, title = "emaLengh show")


rate = input(0.00025,    title = "波动率min")
rateMax = input(0.00045,    title = "波动率max")
adx_length =   input(20,    title = "adx_length")
adx_min =   input(14,    title = "adx_min")

sma_length =   input(11,    title = "sma_length")
rsi_len = input(9, title = "rsi_len")

src = h ? security(heikinashi(syminfo.tickerid), timeframe.period, close, lookahead = false) : close

// boll 通道----------------------------------------------------
length = input(20, minval=1)
mult = input(2.0, minval=0.001, maxval=50, title="StdDev")
basis = sma(src, length)
dev = mult * stdev(src, length)
upper = basis + dev
lower = basis - dev
bbr = (src - lower)/(upper - lower)
// plot(upper, color = color.rgb(46, 59, 240), title="upper")
// plot(lower, color = color.rgb(46, 59, 240), title="lower")


// plot(bbr, "Bollinger Bands %B", color=#26A69A)
// band1 = hline(1, "Overbought", color=#787B86, linestyle=hline.style_dashed)
// hline(0.5, "Middle Band", color=color.new(#787B86, 50))
// band0 = hline(0, "Oversold", color=#787B86, linestyle=hline.style_dashed)
// fill(band1, band0, color=color.rgb(38, 166, 154, 90), title="Background")
// boll 通道----------------------------------------------------

// 线性回归 --------------------------------------------------------------
zlsma_length = input(title="zlsma-Length", type=input.integer, defval=50)
zlsma_offset = input(title="zlsma-Offset", type=input.integer, defval=0)
lsma = linreg(src, zlsma_length, zlsma_offset)
lsma2 = linreg(lsma, zlsma_length, zlsma_offset)
eq= lsma-lsma2
zlsma = lsma+eq
// plot(zlsma , color = color.rgb(243, 243, 14), title="zlsma",linewidth=3)
// 线性回归 --------------------------------------------------------------


// --------------------------------
rsi = rsi(src, 6)

// xHH = sma(high, sma_length)
// xLL = sma(low, sma_length)
// movevalue = (xHH - xLL) / 2
// xHHM = xHH + movevalue
// xLLM = xLL - movevalue

// plot(xHHM, color = color.rgb(208, 120, 219), title="xHHM")
// plot(xLLM, color = color.rgb(208, 120, 219), title="xLLM")


xATR  = atr(c)
nLoss = a * xATR


xATRTrailingStop = 0.0
xATRTrailingStop := iff(src > nz(xATRTrailingStop[1], 0) and src[1] > nz(xATRTrailingStop[1], 0), max(nz(xATRTrailingStop[1]), src - nLoss),
   iff(src < nz(xATRTrailingStop[1], 0) and src[1] < nz(xATRTrailingStop[1], 0), min(nz(xATRTrailingStop[1]), src + nLoss),
   iff(src > nz(xATRTrailingStop[1], 0), src - nLoss, src + nLoss)))


pos = 0
pos :=	iff(src[1] < nz(xATRTrailingStop[1], 0) and src > nz(xATRTrailingStop[1], 0), 1,
   iff(src[1] > nz(xATRTrailingStop[1], 0) and src < nz(xATRTrailingStop[1], 0), -1, nz(pos[1], 0)))

xcolor = pos == -1 ? color.red: pos == 1 ? color.green : color.blue

ema   = ema(src,emaLengh)
// sma   = sma(src,emaLengh)
emaFast   = ema(src,100)
emaSlow   = ema(src,576)
emaShow   = ema(src, emaLengh2)
// sma       =  sma(src, 8)

// [superTrend, dir] = supertrend(3, 200)
// 判断连续涨

[diplus, diminus, adx] = dmi(adx_length, adx_length)


above = crossover(ema, xATRTrailingStop)
below = crossover(xATRTrailingStop, ema)
// above = ema == xATRTrailingStop
// below = xATRTrailingStop== ema

// smaabove = crossover(src, sma)
// smabelow = crossover(sma, src)
// smaabove = src > sma
// smabelow = sma > src
close_rate (n)=>
    abs(close[n]-open[n])/min(close[n],open[n])

rate_val = close_rate(0)
rate_val1 = close_rate(1)

buy  = src > xATRTrailingStop and above  and src > zlsma  and adx >adx_min
// and  src>emaShow
// and rate_val < rate_val1*2 and rate_val >=rate_val1
// and rate_val1<rateMax
// and close[1]>open[1]
sell = src < xATRTrailingStop and below  and src < zlsma and adx >adx_min
// and  src<emaShow
// and rate_val < rate_val1*2  and rate_val >=rate_val1
//  and rate_val1<rateMax
// and open[1]>close[1]  and rate_val1 > rate

// buy  = src > xATRTrailingStop
// sell = src < xATRTrailingStop
// plot(rate_val1 , color = color.red, title="rate_val1")


barbuy  = src > xATRTrailingStop
barsell = src < xATRTrailingStop

atrRsi = rsi(xATRTrailingStop,rsi_len)

// plot(emaFast , color = color.rgb(243, 206, 127), title="emaFast")
// plot(ema , color = color.rgb(47, 227, 27), title="ut-ema")


// plot(emaShow , color = color.rgb(47, 227, 27), title="ema9")

plot(xATRTrailingStop, color = color.rgb(233, 233, 232), title="xATRTrailingStop")

plotshape(buy,  title = "Buy",  text = 'Buy',  style = shape.labelup,   location = location.belowbar, color= color.green, textcolor = color.white, size = size.tiny)
plotshape(sell, title = "Sell", text = 'Sell', style = shape.labeldown, location = location.abovebar, color= color.red,   textcolor = color.white, size = size.tiny)


// plotshape(buy,  title = "Sell",  text = 'Sell',  style = shape.labelup,   location = location.belowbar, color= color.green, textcolor = color.white, transp = 0, size = size.tiny)
// plotshape(sell, title = "buy", text = 'buy', style = shape.labeldown, location = location.abovebar, color= color.red,   textcolor = color.white, transp = 0, size = size.tiny)

// barcolor(barbuy  ? color.green : na)
// barcolor(barsell ? color.red   : na)

// strategy.entry("short",   false, when = buy)
// strategy.entry("long ", true, when = sell)


strategy.entry("long",   true, when = buy and strategy.position_size == 0)
strategy.entry("short", false, when = sell and strategy.position_size == 0)


//动态止盈start------------------------------------------------------------------------------------------
profit = input( 0.015,     title = "最小收益率")
close_profit_rate = input( 10,     title = "平仓收益回撤比")
loss = input(0.004,    title = "回撤率")

// 收益回撤比例
profit_price_scale =profit/close_profit_rate

var float profit_price = 0


// 计算小收益价格

get_profit_price(long) =>
    float res = 0
    if long == true
        res := strategy.position_avg_price * (1+profit)
    if long == false
        res := strategy.position_avg_price * (1-profit)
    res

// 止盈平仓条件
close_profit_position(long)=>
    bool result=false
    if long == true and profit_price>0 and profit_price*(1-profit_price_scale) >=close and  get_profit_price(true) <= close
        result:=true
    if long == false and profit_price>0 and profit_price*(1+profit_price_scale) <=close and  get_profit_price(false) >= close
        result:=true
    result

// 更新动态止盈价格
update_profit_price(price)=>
    float res = price
   // 无仓位时 动态止盈价格为0
    if strategy.position_size == 0
        res := 0
   // long - 价格大于最小收益时保存
    if strategy.position_size > 0 and get_profit_price(true) <= close and (res==0 or res < close)
        res := close
   // short - 价格小于最小收益时保存
    if strategy.position_size < 0 and get_profit_price(true) >= close and (res==0 or res > close)
        res := close
    res

///////


profit_price := update_profit_price(profit_price)
long_close_profit_position = close_profit_position(true)
short_close_profit_position = close_profit_position(false)

// plot(profit_price, color = color.green, title="profit_price")
//动态止盈end------------------------------------------------------------------------------------------


strategy.close("long",comment="long-止盈",when = strategy.position_size > 0 and long_close_profit_position)

strategy.close("long",comment="long-止损",when = strategy.position_size >0 and strategy.position_avg_price * (1-loss) >= close)

strategy.close("short",comment="short-止盈",when = strategy.position_size <0 and short_close_profit_position)

strategy.close("short",comment="short-止损",when = strategy.position_size <0 and strategy.position_avg_price * (1+loss) <= close)