Ripple-Strategie basierend auf dem Backtest-Intervall Coral Trend-Indikator
Überblick
Diese Strategie verwendet die LazyBear Coral Trend-Anzeige, um die Richtung der Kursentwicklung zu bestimmen, und potenzielle Einstiegspunkte durch die Identifizierung von Umkehrungen in der Richtung der Coral Trend-Anzeige. Um falsche Durchbrüche zu filtern, verwendet die Strategie die ADX-Anzeige oder die Gruppe der Absolute Strength Histogramm und HawkEye Volume-Anzeige als kooperative Bestätigungsanzeige, um zuverlässigere Einstiege zu ermöglichen.
Der Exit-Mechanismus verwendet die höchsten/niedrigsten Preise der jüngsten N-K-Linie multipliziert mit dem Ratio der konfigurierbaren Risiko-Renditen, um die Stop-Loss- und Stop-Off-Positionen einzurichten.
Strategieprinzip
Wenn der Korallentrend-Indikator die Richtung des großen Trends beurteilt, tritt ein kleiner Pullback in die entgegengesetzte Richtung auf, während die Farbe des Indikators unverändert bleibt. Wenn der Pullback endet und der Preis in die Richtung des Haupttrends zurückkehrt, die der Korallentrend angibt, kann dies als eine bessere Einstiegszeit angesehen werden.
Die Eintrittsbedingungen sind:
Die Richtung des Coral Trend-Indikators stimmt mit der Richtung des Handels überein ((mehr Kopf = grün, leerer Kopf = rot)
Seit dem letzten vollständigen Durchbruch des Coral Trend Indicators ((die Höchststände der letzten Bar überschreiten die Coral Trend Line)) gibt es mindestens 1 K-Linien, deren Tiefststände vollständig über dem Coral Trend Indicator liegen ((Mehrköpfe) oder deren Höchststände vollständig unter dem Coral Trend Indicator liegen ((Leerköpfe))
Ein kleiner Rückschlag in die entgegengesetzte Richtung (Zurückziehung), bei dem der Schlusskurs immer auf der entgegengesetzten Seite des Korallentrends bleibt
Nach einer kleinen Umkehrung kehrte der Kursabschluss in die Richtung des Haupttrends zurück, die von der Coral Trend angezeigt wurde.
Die oben genannten sind die Hauptvoraussetzungen. Gleichzeitig verwendet die Strategie die ADX-Anzeige oder das Absolute Strength Histogramm und die HawkEye Volume-Anzeige als Bestätigungsvoraussetzung für den Eintritt.
Der ADX-Indikator verlangt, dass der Wert > 20 ist und kürzlich 1 K-Linie gestiegen ist. Die Reihenfolge der grünen und roten Linie des DI entspricht der Handelsrichtung.
Das Absolute Strength Histogramm verlangt, dass die Farbe mit der Handelsrichtung übereinstimmt (Multiple = Blau, Blank = Rot). HawkEye Volume verlangt, dass die Farbe mit der Handelsrichtung übereinstimmt (Multiple = Grün, Blank = Rot).
Die Exit-Methode verwendet die höchsten oder niedrigsten Preise der jüngsten N-K-Linie multipliziert mit dem Risiko-Rendite-Verhältnis, um den Stop-Loss und den Stop-Out zu setzen. N-Werte und Risiko-Rendite-Verhältnisse können durch Parameter konfiguriert werden.
Analyse der Stärken
Der größte Vorteil dieser Strategie besteht darin, dass der Coral Trend-Indikator die Richtung des Haupttrends ermittelt und die Eintrittschancen durch die Identifizierung der Umkehrung entdeckt wird, um zu vermeiden, dass er in nicht-trendigen Märkten mit den Wellen fließt. Der Confirm-Indikator filtert gleichzeitig viele falsche Durchbrüche und erhöht somit die Erfolgsrate des Eintritts.
Darüber hinaus bietet die Strategie eine vollständige Risikokontrolle, einschließlich Stop-Loss-Margin-Einstellungen und Risiko-Margin-Prozentsatz-Kontrollen, so dass auch einzelne Verluste nicht zu einem großen Schlag auf das Gesamtkapital führen.
Risikoanalyse
Die größte Gefahr dieser Strategie besteht darin, dass die Verwendung von Indikatoren als Einstiegsurteile erlaubt ist. Es ist leicht zu glauben, dass die vollständige Abhängigkeit von der Parameterkonfiguration automatisch einen Gewinn bringt. In der Tat müssen die Parameteroptimierung und die Regelkonfiguration in Verbindung mit der Gesetzmäßigkeit der grundlegenden Preisänderungen und der intuitiven Beurteilung der Wirkung der Indikatoren und der Preisverbindung eingerichtet werden, um eine Konfiguration zu erstellen, die besser zu Ihrem Handelsstil und Ihrer Sorte passt.
Außerdem müssen die Einstellungen für die Stop-Loss- und die Stop-Loss-Position angemessen sein. Eine zu hohe Stop-Loss-Multiplikation kann dazu führen, dass der Spieler nicht aufhören kann, aus dem Spielfeld zu gehen, und eine zu kleine Stop-Loss-Position ist zu riskant. Dies muss je nach Schwankung der verschiedenen Sorten und der individuellen Risikobereitschaft eingestellt werden.
Optimierungsrichtung
Die Strategie kann in folgenden Bereichen optimiert werden:
Anpassung der Parameter des Coral Trend-Indikators, damit er besser auf Preisänderungen für verschiedene Sorten reagiert
Versuchen Sie, verschiedene Confirm-Indikatoren oder Kombinationen von Indikatoren, wie KDJ, MACD usw., zu verwenden, um die Einstiegssignale genauer zu machen
Die Berechnung von Stop-Loss- und Stop-Off-Lösungen wird an die Schwankungen der verschiedenen Sorten angepasst, um eine bessere Risikokontrolle zu gewährleisten
Erweiterung des Moduls für die Vermögensverwaltung, um die Einzelleistung an die Anzahl der Positionen anzupassen und die Gesamtverluste effektiv zu kontrollieren
Hinzufügung eines Trading Time Control Moduls, um Strategien nur in bestimmten Zeitabschnitten zu betreiben und Verluste in Zeiten starker Volatilität zu vermeiden
Zusammenfassen
Die Strategie nutzt zunächst den Korallen Trend, um die langen mittleren Preistrends zu ermitteln, und dann durch die Beurteilung der Umkehrung, in Verbindung mit dem falschen Durchbruch des Confirm-Signalfilters, um eine zuverlässige Trendverfolgungsstrategie zu erstellen. Gleichzeitig ermöglicht die ausgefeilte Windkontrolle die langfristige Laufzeit der Strategie und die Stabilität der Mittel. Durch weitere Parameter- und Moduloptimierungen wird die Strategie möglicherweise für mehr Sorten geeignet und hat eine bessere Stabilität und Ertragsfähigkeit.
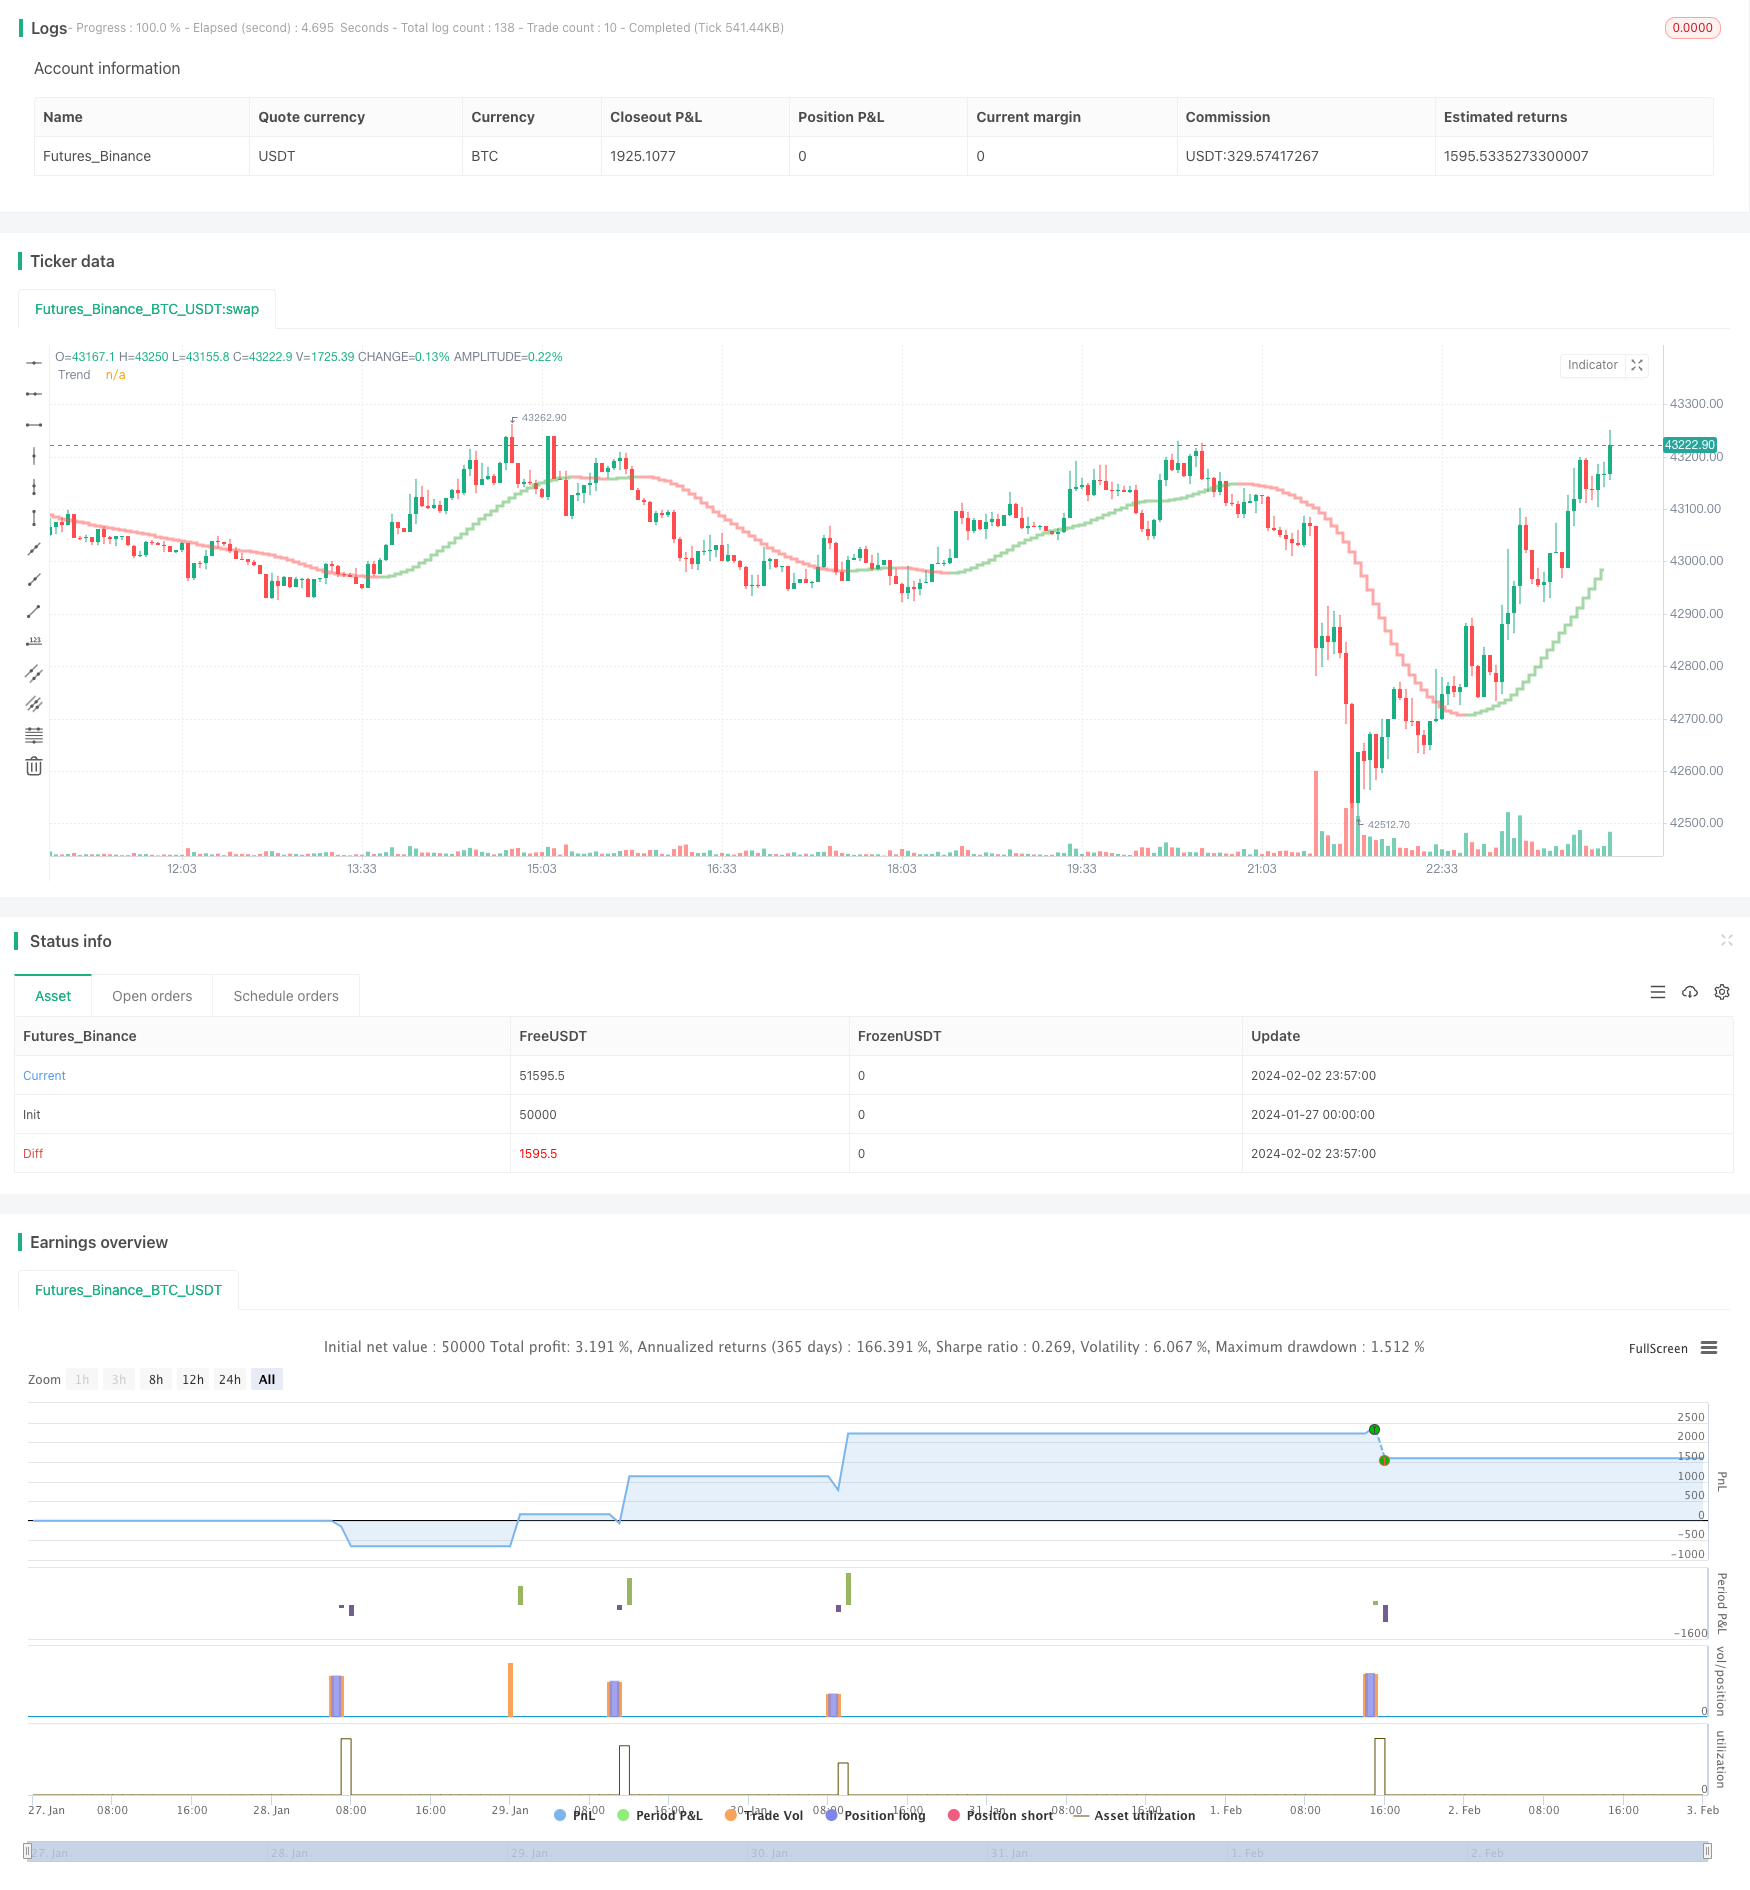
/*backtest
start: 2024-01-27 00:00:00
end: 2024-02-03 00:00:00
period: 3m
basePeriod: 1m
exchanges: [{"eid":"Futures_Binance","currency":"BTC_USDT"}]
*/

// This source code is subject to the terms of the Mozilla Public License 2.0 at https://mozilla.org/MPL/2.0/
// © kevinmck100

// @description
//
// Strategy is taken from the TradeIQ YouTube video called "I Finally Found 80% Win Rate Trading Strategy For Crypto"
// Check out the full video for further details/clarification on strategy entry/exit conditions.
//
// It incorporates the following features:
//
//      - Risk management:  Configurable X% loss per stop loss
//                          Configurable R:R ratio
//
//      - Trade entry:      Conditions outlines below
//
//      - Trade exit:       Conditions outlined below
//
//      - Backtesting:      Configurable backtesting range by date
//
//      - Trade drawings:   TP/SL boxes drawn for all trades (can be turned on and off)
//                          Trade exit information labels (can be turned on and off)
//                          NOTE: Trade drawings will only be applicable when using overlay strategies
//
//      - Debugging:        Includes section with useful debugging techniques
//
// Strategy conditions:
//
//      - Trade entry:      LONG:   C1: Coral Trend is bullish
//                                  C2: At least 1 candle where low is above Coral Trend since last cross above Coral Trend
//                                  C3: Pullback happens and price closes below Coral Trend
//                                  C4: Coral Trend colour remains bullish for duration of pullback
//                                  C5: After valid pullback, price then closes above Coral Trend
//                                  C6: Optional confirmation indicators (choose either C6.1 or C6.2 or NONE):
//                                      C6.1: ADX and DI (Single indicator)
//                                          C6.1.1: Green line is above red line
//                                          C6.1.2: Blue line > 20
//                                          C6.1.3: Blue trending up over last 1 candle
//                                      C6.2: Absolute Strengeh Histogram + HawkEye Volume Indicator (Two indicators combined)
//                                          C6.2.1: Absolute Strengeh Histogram colour is blue
//                                          C6.2.2: HawkEye Volume Indicator colour is green
//                          SHORT:  C1: Coral Trend is bearish
//                                  C2: At least 1 candle where high is below Coral Trend since last cross below Coral Trend
//                                  C3: Pullback happens and price closes above Coral Trend
//                                  C4: Coral Trend colour remains bearish for duration of pullback
//                                  C5: After valid pullback, price then closes below Coral Trend
//                                  C6: Optional confirmation indicators (choose either C6.1 or C6.2 or NONE):
//                                      C6.1: ADX and DI (Single indicator)
//                                          C6.1.1: Red line is above green line
//                                          C6.1.2: Blue line > 20
//                                          C6.1.3: Blue trending up over last 1 candle
//                                      C6.2: Absolute Strengeh Histogram + HawkEye Volume Indicator (Two indicators combined)
//                                          C6.2.1: Absolute Strengeh Histogram colour is red
//                                          C6.2.2: HawkEye Volume Indicator colour is red
//                          NOTE: All the optional confirmation indicators cannot be overlayed with Coral Trend so feel free to add each separately to the chart for visual purposes
//
//
//      - Trade exit:       Stop Loss:      Calculated by recent swing low over previous X candles (configurable with "Local High/Low Lookback")
//                          Take Profit:    Calculated from R:R multiplier * Stop Loss size
//
// @credits
//
// Coral Trend Indicator [LazyBear]     by @LazyBear
// Absolute Strength Histogram | jh     by @jiehonglim
// Indicator: HawkEye Volume Indicator  by @LazyBear
// ADX and DI                           by @BeikabuOyaji

//@version=5
INITIAL_CAPITAL = 1000
DEFAULT_COMMISSION = 0.02
MAX_DRAWINGS = 500
IS_OVERLAY = true

strategy("Coral Trend Pullback Strategy (TradeIQ)", "Coral Trend Pullback", overlay = IS_OVERLAY, initial_capital = INITIAL_CAPITAL, currency = currency.NONE, max_labels_count = MAX_DRAWINGS, max_boxes_count = MAX_DRAWINGS, max_lines_count = MAX_DRAWINGS, default_qty_type = strategy.cash, commission_type = strategy.commission.percent, commission_value = DEFAULT_COMMISSION)

// =============================================================================
// INPUTS
// =============================================================================

// ---------------
// Risk Management
// ---------------
riskReward          = input.float(1.5,  "Risk : Reward        1 :",     group = "Strategy: Risk Management",    inline = "RM1", minval = 0, step = 0.1, tooltip = "Previous high or low (long/short dependant) is used to determine TP level. 'Risk : Reward' ratio is then used to calculate SL based of previous high/low level.\n\nIn short, the higher the R:R ratio, the smaller the SL since TP target is fixed by previous high/low price data.")
accountRiskPercent  = input.float(1,    "Portfolio Risk %        ",     group = "Strategy: Risk Management",    inline = "RM2", minval = 0, step = 0.1, tooltip = "Percentage of portfolio you lose if trade hits SL.\n\nYou then stand to gain\n  Portfolio Risk % * Risk : Reward\nif trade hits TP.")

localHlLookback     = input.int (5,     "Local High/Low Lookback     ", group = "Strategy: Stop Loss Settings", inline = "SL1", minval = 1,             tooltip = "This strategy calculates the Stop Loss value from the recent local high/low. This lookback period determines the number of candles to include for the local high/low.")

// ----------
// Date Range
// ----------
startYear           = input.int (2010,  "Start Date  ",                 group = "Strategy: Date Range",         inline = "DR1", minval    = 1900, maxval = 2100)
startMonth          = input.int (1,     "",                             group = "Strategy: Date Range",         inline = "DR1", options   = [1, 2, 3, 4, 5, 6, 7, 8, 9, 10, 11, 12])
startDate           = input.int (1,     "",                             group = "Strategy: Date Range",         inline = "DR1", options   = [1, 2, 3, 4, 5, 6, 7, 8, 9, 10, 11, 12, 13, 14, 15, 16, 17, 18, 19, 20, 21, 22, 23, 24, 25, 26, 27, 28, 29, 30, 31])
endYear             = input.int (2100,  "End Date    ",                 group = "Strategy: Date Range",         inline = "DR2", minval    = 1900, maxval = 2100)
endMonth            = input.int (1,     "",                             group = "Strategy: Date Range",         inline = "DR2", options   = [1, 2, 3, 4, 5, 6, 7, 8, 9, 10, 11, 12])
endDate             = input.int (1,     "",                             group = "Strategy: Date Range",         inline = "DR2", options   = [1, 2, 3, 4, 5, 6, 7, 8, 9, 10, 11, 12, 13, 14, 15, 16, 17, 18, 19, 20, 21, 22, 23, 24, 25, 26, 27, 28, 29, 30, 31])

// ----------------
// Drawing Settings
// ----------------
showTpSlBoxes       = input.bool(true,  "Show TP / SL Boxes",           group = "Strategy: Drawings",           inline = "D1",  tooltip = "Show or hide TP and SL position boxes.\n\nNote: TradingView limits the maximum number of boxes that can be displayed to 500 so they may not appear for all price data under test.")
showLabels          = input.bool(false, "Show Trade Exit Labels",       group = "Strategy: Drawings",           inline = "D2",  tooltip = "Useful labels to identify Profit/Loss and cumulative portfolio capital after each trade closes.\n\nAlso note that TradingView limits the max number of 'boxes' that can be displayed on a chart (max 500). This means when you lookback far enough on the chart you will not see the TP/SL boxes. However you can check this option to identify where trades exited.")

// ------------------
// Indicator Settings
// ------------------

// Coral Trend
ctSm                = input.int  (25,       "Smoothing Period       ",              group = "Leading Indicator: Coral Trand Settings",                      inline = "CT1")
ctCd                = input.float(0.4,      "Constant D          ",                 group = "Leading Indicator: Coral Trand Settings",                      inline = "CT2", step = 0.1)

// Confirmation indicator inputs
confirmationInd     = input.string("ADX and DI", "Entry Confirmation Method    ",   group = "Confirmation Indicator: Indicator Selection",                  inline = "IS1", options=["None", "ADX and DI", "Absolute Strength Histogram + HawkEye Volume"], tooltip = "Select one of the possible confirmation indicator(s) which can be used to confirm entry signals from the main Coral Trend indicator conditions. See strategy conditions to understand the logic behind each confirmation indicator")
// ADX and DI
adxLen              = input.int(14, "ADX Length           ",                        group = "Confirmation Indicator: ADX and DI Settings",                  inline = "AD1")
midLine             = input.int(20, "Mid Line            ",                         group = "Confirmation Indicator: ADX and DI Settings",                  inline = "AD2", tooltip = "Mid line on standard ADX and DI indicator. In this strategy the DI must be above this line for entry confirmation.")
// Absolute Strength Histogram
ashLength           = input.int(9, "Period of Evaluation       ",                   group = "Confirmation Indicator: Absolute Strength Histogram Settings", inline = "ASH1")
ashSmooth           = input.int(6, "Period of Smoothing      ",                     group = "Confirmation Indicator: Absolute Strength Histogram Settings", inline = "ASH2")
ashSrc              = input.source(close, "Source             ",                    group = "Confirmation Indicator: Absolute Strength Histogram Settings", inline = "ASH3")
ashMode             = input.string("RSI", "Indicator Method       ",                group = "Confirmation Indicator: Absolute Strength Histogram Settings", inline = "ASH4", options=["RSI", "STOCHASTIC", "ADX"])
sahMaType           = input.string("SMA", "MA              ",                       group = "Confirmation Indicator: Absolute Strength Histogram Settings", inline = "ASH5", options=["ALMA", "EMA", "WMA", "SMA", "SMMA", "HMA"])
ashAlmaOffset       = input.float(0.85, "* Arnaud Legoux (ALMA) Offset",            group = "Confirmation Indicator: Absolute Strength Histogram Settings", inline = "ASH6", minval=0, step=0.01)
ashAlmaSigma        = input.int(6, "* Arnaud Legoux (ALMA) Sigma",                  group = "Confirmation Indicator: Absolute Strength Histogram Settings", inline = "ASH7", minval=0)
// HawkEye Volume Indicator
hevLength           = input.int(200, "Length             ",                         group = "Confirmation Indicator: HawkEye Volume Settings",              inline = "HV1")
hevDivisor          = input.float(1.6, "Divisor             ",                      group = "Confirmation Indicator: HawkEye Volume Settings",              inline = "HV2", step=0.1)

// =============================================================================
// INDICATORS
// =============================================================================

// -----------
// Coral Trend
// -----------
src             = close
di              = (ctSm - 1.0) / 2.0 + 1.0
c1              = 2 / (di + 1.0)
c2              = 1 - c1
c3              = 3.0 * (ctCd * ctCd + ctCd * ctCd * ctCd)
c4              = -3.0 * (2.0 * ctCd * ctCd + ctCd + ctCd * ctCd * ctCd)
c5              = 3.0 * ctCd + 1.0 + ctCd * ctCd * ctCd + 3.0 * ctCd * ctCd
var float i1    = na
var float i2    = na
var float i3    = na
var float i4    = na
var float i5    = na
var float i6    = na
i1             := c1 * src + c2 * nz(i1[1])
i2             := c1 * i1  + c2 * nz(i2[1])
i3             := c1 * i2  + c2 * nz(i3[1])
i4             := c1 * i3  + c2 * nz(i4[1])
i5             := c1 * i4  + c2 * nz(i5[1])
i6             := c1 * i5  + c2 * nz(i6[1])

bfr             = -ctCd * ctCd * ctCd * i6 + c3 * i5 + c4 * i4 + c5 * i3
bfrC            = bfr > nz(bfr[1]) ? color.new(color.green, 50) : bfr < nz(bfr[1]) ? color.new(color.red, 50) : color.new(color.blue, 50)
plot(bfr, "Trend", linewidth = 3, style = plot.style_stepline, color = bfrC)

// ----------
// ADX and DI
// ----------
TrueRange                           = math.max(math.max(high - low, math.abs(high - nz(close[1]))), math.abs(low - nz(close[1])))
DirectionalMovementPlus             = high - nz(high[1]) > nz(low[1]) - low ? math.max(high - nz(high[1]), 0) : 0
DirectionalMovementMinus            = nz(low[1]) - low > high - nz(high[1]) ? math.max(nz(low[1]) - low, 0) : 0

SmoothedTrueRange                   = 0.0
SmoothedTrueRange                  := nz(SmoothedTrueRange[1]) - nz(SmoothedTrueRange[1]) / adxLen + TrueRange

SmoothedDirectionalMovementPlus     = 0.0
SmoothedDirectionalMovementPlus    := nz(SmoothedDirectionalMovementPlus[1]) - nz(SmoothedDirectionalMovementPlus[1]) / adxLen + DirectionalMovementPlus

SmoothedDirectionalMovementMinus    = 0.0
SmoothedDirectionalMovementMinus   := nz(SmoothedDirectionalMovementMinus[1]) - nz(SmoothedDirectionalMovementMinus[1]) / adxLen + DirectionalMovementMinus

DIPlus                              = SmoothedDirectionalMovementPlus / SmoothedTrueRange * 100
DIMinus                             = SmoothedDirectionalMovementMinus / SmoothedTrueRange * 100
DX                                  = math.abs(DIPlus - DIMinus) / (DIPlus + DIMinus) * 100
ADX                                 = ta.sma(DX, adxLen)

// ---------------------------
// Absolute Strength Histogram
// ---------------------------
ashMa(ashType, ashSrc, ashLen) =>
    float result = 0
    if ashType == 'SMA'  // Simple
        result := ta.sma(ashSrc, ashLen)
        result
    if ashType == 'EMA'  // Exponential
        result := ta.ema(ashSrc, ashLen)
        result
    if ashType == 'WMA'  // Weighted
        result := ta.wma(ashSrc, ashLen)
        result
    if ashType == 'SMMA'  // Smoothed
        ashWma = ta.wma(ashSrc, ashLen)
        ashSma = ta.sma(ashSrc, ashLen)
        result := na(ashWma[1]) ? ashSma : (ashWma[1] * (ashLen - 1) + ashSrc) / ashLen
        result
    if ashType == 'HMA'  // Hull
        result := ta.wma(2 * ta.wma(ashSrc, ashLen / 2) - ta.wma(ashSrc, ashLen), math.round(math.sqrt(ashLen)))
        result
    if ashType == 'ALMA'  // Arnaud Legoux
        result := ta.alma(ashSrc, ashLen, ashAlmaOffset, ashAlmaSigma)
        result
    result

Price           = ashSrc
Price1          = ashMa('SMA', Price, 1)
Price2          = ashMa('SMA', Price[1], 1)

//RSI
Bulls0          = 0.5 * (math.abs(Price1 - Price2) + Price1 - Price2)
Bears0          = 0.5 * (math.abs(Price1 - Price2) - (Price1 - Price2))

//STOCHASTIC
Bulls1          = Price1 - ta.lowest(Price1, ashLength)
Bears1          = ta.highest(Price1, ashLength) - Price1

//ADX
Bulls2          = 0.5 * (math.abs(high - high[1]) + high - high[1])
Bears2          = 0.5 * (math.abs(low[1] - low) + low[1] - low)

Bulls           = ashMode == 'RSI' ? Bulls0 : ashMode == 'STOCHASTIC' ? Bulls1 : Bulls2
Bears           = ashMode == 'RSI' ? Bears0 : ashMode == 'STOCHASTIC' ? Bears1 : Bears2
AvgBulls        = ashMa(sahMaType, Bulls, ashLength)
AvgBears        = ashMa(sahMaType, Bears, ashLength)

SmthBulls       = ashMa(sahMaType, AvgBulls, ashSmooth)
SmthBears       = ashMa(sahMaType, AvgBears, ashSmooth)

isTrendBullish  = SmthBulls > SmthBears ? true : false

// ------------------------
// HawkEye Volume Indicator
// ------------------------
hevRange1   = high - low
hevRangeAvg = ta.sma(hevRange1, hevLength)
hevVolumeA  = ta.sma(volume, hevLength)

hevHigh1    = high[1]
hevLow1     = low[1]
hevMid1     = hl2[1]

hevU1       = hevMid1 + (hevHigh1 - hevLow1) / hevDivisor
hevD1       = hevMid1 - (hevHigh1 - hevLow1) / hevDivisor

rEnabled1   = hevRange1 > hevRangeAvg and close < hevD1 and volume > hevVolumeA
rEnabled2   = close < hevMid1
rEnabled    = rEnabled1 or rEnabled2

gEnabled1   = close > hevMid1
gEnabled2   = hevRange1 > hevRangeAvg and close > hevU1 and volume > hevVolumeA
gEnabled3   = high > hevHigh1 and hevRange1 < hevRangeAvg / 1.5 and volume < hevVolumeA
gEnabled4   = low < hevLow1 and hevRange1 < hevRangeAvg / 1.5 and volume > hevVolumeA
gEnabled    = gEnabled1 or gEnabled2 or gEnabled3 or gEnabled4

grEnabled1  = hevRange1 > hevRangeAvg and close > hevD1 and close < hevU1 and volume > hevVolumeA and volume < hevVolumeA * 1.5 and volume > volume[1]
grEnabled2  = hevRange1 < hevRangeAvg / 1.5 and volume < hevVolumeA / 1.5
grEnabled3  = close > hevD1 and close < hevU1
grEnabled   = grEnabled1 or grEnabled2 or grEnabled3

// =============================================================================
// STRATEGY LOGIC
// =============================================================================

// ---------
// FUNCTIONS
// ---------

percentAsPoints(pcnt) =>
    math.round(pcnt / 100 * close / syminfo.mintick)

calcStopLossPrice(pointsOffset, isLong) =>
    priceOffset = pointsOffset * syminfo.mintick
    if isLong
        close - priceOffset
    else
        close + priceOffset

calcProfitTrgtPrice(pointsOffset, isLong) =>
    calcStopLossPrice(-pointsOffset, isLong)


printLabel(barIndex, msg) => label.new(barIndex, close, msg)

printTpSlHitBox(left, right, slHit, tpHit, entryPrice, slPrice, tpPrice) =>
    if showTpSlBoxes
        box.new (left = left,   top = entryPrice,   right = right,  bottom = slPrice,   bgcolor = slHit ? color.new(color.red, 60)   : color.new(color.gray, 90), border_width = 0)
        box.new (left = left,   top = entryPrice,   right = right,  bottom = tpPrice,   bgcolor = tpHit ? color.new(color.green, 60) : color.new(color.gray, 90), border_width = 0)
        line.new(x1 = left,     y1 = entryPrice,    x2 = right,     y2 = entryPrice,    color = color.new(color.yellow, 20))
        line.new(x1 = left,     y1 = slPrice,       x2 = right,     y2 = slPrice,       color = color.new(color.red, 20))
        line.new(x1 = left,     y1 = tpPrice,       x2 = right,     y2 = tpPrice,       color = color.new(color.green, 20))

printTpSlNotHitBox(left, right, entryPrice, slPrice, tpPrice) =>
    if showTpSlBoxes
        box.new (left = left,   top = entryPrice,   right = right,  bottom = slPrice,   bgcolor = color.new(color.gray, 90), border_width = 0)
        box.new (left = left,   top = entryPrice,   right = right,  bottom = tpPrice,   bgcolor = color.new(color.gray, 90), border_width = 0)
        line.new(x1 = left,     y1 = entryPrice,    x2 = right,     y2 = entryPrice,    color = color.new(color.yellow, 20))
        line.new(x1 = left,     y1 = slPrice,       x2 = right,     y2 = slPrice,       color = color.new(color.red, 20))
        line.new(x1 = left,     y1 = tpPrice,       x2 = right,     y2 = tpPrice,       color = color.new(color.green, 20))

printTradeExitLabel(x, y, posSize, entryPrice, pnl) =>
    if showLabels
        labelStr = "Position Size: " + str.tostring(math.abs(posSize), "#.##") + "\nPNL: " + str.tostring(pnl, "#.##") + "\nCapital: " + str.tostring(strategy.equity, "#.##") + "\nEntry Price: " + str.tostring(entryPrice, "#.##")
        label.new(x = x, y = y, text = labelStr, color = pnl > 0 ? color.new(color.green, 60) : color.new(color.red, 60), textcolor = color.white, style = label.style_label_down)

printVerticalLine(col) => line.new(bar_index, close, bar_index, close * 1.01, extend = extend.both, color = col)

// ----------
// CONDITIONS
// ----------

inDateRange                 = true

// Condition 1: Coral Trend color matches trend direction (long=green, short=red)
isCoralBullish              = bfr > nz(bfr[1])
isCoralBearish              = bfr < nz(bfr[1])

// Condition 2: At least 1 candle completely above/below (long/short) Coral Trend since last cross above/below (long/short) Coral Trend (could potentially try also with only close above)
sincePrePullbackBullBreakout= ta.barssince(ta.crossover(close, bfr))
sincePrePullbackBearBreakout= ta.barssince(ta.crossunder(close, bfr))
prePullbackBullBreakout     = ta.barssince(low > bfr and high > bfr) < sincePrePullbackBullBreakout[1]
prePullbackBearBreakout     = ta.barssince(low < bfr and high < bfr) < sincePrePullbackBearBreakout[1]

// Condition 3: Pullback closes below/above (long/short) Coral Trend
barssinceBullPullbackStart  = ta.barssince(ta.crossunder(close, bfr))
barssinceBearPullbackStart  = ta.barssince(ta.crossover(close, bfr))
barssincePullbackStart      = isCoralBullish ? barssinceBullPullbackStart : isCoralBearish ? barssinceBearPullbackStart : na

// Condition 4: Coral Trend colour matched trend direction for duration of pullback
sinceBullish                = ta.barssince(ta.crossover(bfr, nz(bfr[1])))
sinceBearish                = ta.barssince(ta.crossunder(bfr, nz(bfr[1])))
barssinceCoralflip          = isCoralBullish ? sinceBullish : isCoralBearish ? sinceBearish : na
isPullbackValid             = barssincePullbackStart < barssinceCoralflip

// Condition 5: After valid pullback, price then closes above/below (long/short) Coral Trend
entryBreakout               = (isCoralBullish and ta.crossover(close, bfr)) or (isCoralBearish and ta.crossunder(close, bfr))

// Condition 6: Confirmation indicators (6.1 or 6.2, optional depending on settings) confirms trade entry
// 6.1:         ADX and DI
//      6.1.1:  Green and red match trend (long=(green > red), short=(red > green))
//      6.1.2:  Blue > 20
//      6.1.3:  Blue trending up over last 1 candle
// 6.2:         Absolute Strengeh Histogram + HawkEye Volume Indicator
//      6.2.1:  Absolute Strengeh Histogram colour matches trend (long=blue, short=red)
//      6.2.2:  HawkEye Volume Indicator colour matches trend (long=green, short=red)
var longTradeConfirmed  = false
var shortTradeConfirmed = false
if confirmationInd      == "ADX and DI"
    isAdxUp             = ADX       > ADX [1]
    isAdxValid          = ADX       > midLine   and isAdxUp
    longTradeConfirmed := DIPlus    > DIMinus   and isAdxValid
    shortTradeConfirmed:= DIMinus   > DIPlus    and isAdxValid
else if confirmationInd == "Absolute Strength Histogram + HawkEye Volume"
    isAshBullish        = SmthBulls > SmthBears ? true : false
    isHevBullish        = not grEnabled     and gEnabled ? true : false
    isHevBearish        = not grEnabled     and rEnabled ? true : false
    longTradeConfirmed := isAshBullish      and isHevBullish
    shortTradeConfirmed:= not isAshBullish  and isHevBearish
else if confirmationInd == "None"
    longTradeConfirmed := true
    shortTradeConfirmed:= true

// Combine all entry conditions
goLong              = inDateRange and isCoralBullish and prePullbackBullBreakout and isPullbackValid and entryBreakout and longTradeConfirmed
goShort             = inDateRange and isCoralBearish and prePullbackBearBreakout and isPullbackValid and entryBreakout and shortTradeConfirmed

// Trade entry and exit variables
var tradeEntryBar   = bar_index
var profitPoints    = 0.
var lossPoints      = 0.
var slPrice         = 0.
var tpPrice         = 0.
var inLong          = false
var inShort         = false
var entryPrice      = 0.

// Entry decisions
openLong            = (goLong and not inLong)
openShort           = (goShort and not inShort)
flippingSides       = (goLong and inShort) or (goShort and inLong)
enteringTrade       = openLong or openShort
inTrade             = inLong or inShort

// Exit calculations
entryPrice         := close
longSlPrice         = ta.lowest(localHlLookback)
shortSlPrice        = ta.highest(localHlLookback)
slAmount            = isCoralBullish ? entryPrice - longSlPrice : shortSlPrice - entryPrice
slPercent           = math.abs((1 - (entryPrice - slAmount) / entryPrice) * 100)
tpPercent           = slPercent * riskReward

// Risk calculations
riskAmt             = strategy.equity * accountRiskPercent / 100
entryQty            = math.abs(riskAmt / slPercent * 100)  / close

if openLong
    if strategy.position_size < 0
        printTpSlNotHitBox(tradeEntryBar + 1, bar_index + 1, strategy.position_avg_price, slPrice, tpPrice)
        printTradeExitLabel(bar_index + 1, math.max(tpPrice, slPrice), strategy.position_size, strategy.position_avg_price, strategy.openprofit)
    strategy.entry("Long", strategy.long, qty = entryQty, alert_message = "Long Entry")
    enteringTrade   := true
    inLong          := true
    inShort         := false

if openShort
    if strategy.position_size > 0
        printTpSlNotHitBox(tradeEntryBar + 1, bar_index + 1, strategy.position_avg_price, slPrice, tpPrice)
        printTradeExitLabel(bar_index + 1, math.max(tpPrice, slPrice), strategy.position_size, strategy.position_avg_price, strategy.openprofit)
    strategy.entry("Short", strategy.short, qty = entryQty, alert_message = "Short Entry")
    enteringTrade   := true
    inShort         := true
    inLong          := false

if enteringTrade
    profitPoints    := percentAsPoints(tpPercent)
    lossPoints      := percentAsPoints(slPercent)
    slPrice         := calcStopLossPrice(lossPoints, openLong)
    tpPrice         := calcProfitTrgtPrice(profitPoints, openLong)
    tradeEntryBar   := bar_index

strategy.exit("TP/SL", profit = profitPoints, loss = lossPoints, comment_profit = "TP Hit", comment_loss = "SL Hit", alert_profit = "TP Hit Alert", alert_loss = "SL Hit Alert")

// =============================================================================
// DRAWINGS
// =============================================================================

// -----------
// TP/SL Boxes
// -----------

slHit           = (inShort and high >= slPrice) or (inLong  and low <= slPrice)
tpHit           = (inLong  and high >= tpPrice) or (inShort and low <= tpPrice)

exitTriggered   = slHit or tpHit
ctEntryPrice    = strategy.closedtrades.entry_price (strategy.closedtrades - 1)
pnl             = strategy.closedtrades.profit      (strategy.closedtrades - 1)
posSize         = strategy.closedtrades.size        (strategy.closedtrades - 1)

// Print boxes for trades closed at profit or loss
if (inTrade and exitTriggered)
    inShort    := false
    inLong     := false
    // printTpSlHitBox(tradeEntryBar, bar_index, slHit, tpHit, ctEntryPrice, slPrice, tpPrice)
    // printTradeExitLabel(bar_index, math.max(tpPrice, slPrice), posSize, ctEntryPrice, pnl)

// Print TP/SL box for current open trade
// if barstate.islastconfirmedhistory and strategy.position_size != 0
//     printTpSlNotHitBox(tradeEntryBar + 1, bar_index + 1, strategy.position_avg_price, slPrice, tpPrice)

// // =============================================================================
// // DEBUGGING
// // =============================================================================

// Data window plots
plotchar(prePullbackBullBreakout,   "prePullbackBullBreakout",  "")
plotchar(prePullbackBearBreakout,   "prePullbackBearBreakout",  "")
plotchar(barssincePullbackStart,    "barssincePullbackStart",   "")
plotchar(isCoralBullish,            "isCoralBullish",           "")
plotchar(isCoralBearish,            "isCoralBearish",           "")
plotchar(barssinceCoralflip,        "barssinceCoralflip",       "")
plotchar(isPullbackValid,           "isPullbackValid",          "")
plotchar(entryBreakout,             "entryBreakout",            "")
plotchar(slHit,                     "slHit",                    "")
plotchar(tpHit,                     "tpHit",                    "")
plotchar(slPrice,                   "slPrice",                  "")

// Label plots
// plotDebugLabels = false
// if plotDebugLabels
//     if bar_index == tradeEntryBar
//         printLabel(bar_index, "Position size: " + str.tostring(entryQty * close, "#.##"))