Dual Range Filter Trendfolgestrategie
Überblick
Die Dual-Range-Filter-Trend-Tracking-Strategie ist eine quantitative Trading-Strategie, die die Doppel-EMA-Range-Filter verwendet, um die Richtung des Trends zu erkennen und den Trend zu verfolgen. Die Strategie kombiniert die Doppel-Equilibrium-Filterung und die ATR-Range-Berechnung, um die Richtung des mittleren und langen Trends effektiv zu erkennen und die Verfolgung von Stopps zu nutzen, um Gewinne zu sichern.
Strategieprinzip
Der Kern der Strategie ist die Doppel-EMA-Range-Filterung. Sie berechnet die ATR-Range der K-Linie und glättet sie, um dann die Position der K-Linie innerhalb der Bandbreite zu bestimmen, um zu beurteilen, ob sie sich derzeit im Trend befindet. Wenn der Preis die Bandbreite durchbricht, zeigt dies eine Trendwende an.
Konkret berechnet die Strategie zunächst die Größe des ATR-Bereichs der K-Linie, um ihn dann in Kombination mit zwei EMAs zu glätten. Der ATR-Bereich repräsentiert die normale Bandbreite der K-Linie. Wenn der Preis über diesen Bereich hinausgeht, bedeutet dies eine Trendänderung.
Nach dem Eintritt nutzt die Strategie einen Floating Stop, um Gewinne zu sperren. Während der Haltung beurteilt sie in Echtzeit, ob die K-Linie außerhalb des Bereichs zurückfällt, und tritt bei einem Rückfall aus der aktuellen Position aus. Dies kann den Gewinn des Trendhandels effektiv sperren.
Analyse der Stärken
Dual-Spanne-Filter-Trend-Tracking-Strategie kombiniert die Vorteile der linearen Filterung und Range-Berechnung, um die Richtung der Tendenz zu bestimmen und zu vermeiden, dass in den Schaukel häufige Ein-und Ausgänge. Die spezifischen Vorteile sind wie folgt:
- Verwenden Sie die ATR-Prinzipien, um die Bandbreite der K-Linien zu bestimmen und zu vermeiden, dass Sie in einen schwankenden Markt ohne Richtung eintreten.
- Doppelte EMA-Filter erhöhen die Richtigkeit der Beurteilung und reduzieren die falschen Signale
- Echtzeit-Floating Stop Loss, um Trendgewinne effektiv abzuschließen
- Strategie-Logik ist einfach, klar, leicht zu verstehen und zu optimieren
Risikoanalyse
Die Strategie birgt auch einige Risiken, die sich auf folgende Bereiche konzentrieren:
- Große Sprünge durchbrechen ATR-Bereich und führen zu vorzeitiger Einreise
- Der Stop-Loss könnte bei starken Trends zu früh ausgelöst werden.
- Fehlende Parameter-Einstellungen beeinflussen auch die Strategie
Diese Risiken können durch geeignete Optimierungsparameter, die Verhinderung von False Breakouts und die Beurteilung der Trendstärke bewältigt werden.
Optimierungsvorschläge
Die Doppel-Spektrum-Filter-Trend-Tracking-Strategie hat Potenzial für weitere Optimierungen.
- Optimierung von ATR-Parametern, Glatte K-Linien
- Vermeidung von False Breakouts in Verbindung mit dem Volumenindikator
- Beurteilung der Trendstärke und Unterscheidung zwischen einem Einmalbruch und einem nachhaltigen Trend
- Optimierung von Stop-Loss-Punkten, um langfristige Trends zu verfolgen, während Sie Gewinne sichern
Durch diese Optimierungen kann die Strategie in einem breiteren Marktumfeld zu stabilen Erträgen führen.
Zusammenfassen
Die Doppel-Spanne-Filter-Trend-Tracking-Strategie integriert die verschiedenen Vorteile der Mittellinien-Filterung und der ATR-Spanne-Beurteilung, um die Richtung und den Zeitpunkt der Eintritt in eine mittellange nachhaltige Tendenz effektiv zu identifizieren. Sie tritt nur ein, wenn sich der Trend ändert, und nutzt die schwimmenden Stop-Losses, um die Gewinne zu sperren. Die Strategie ist logisch einfach und klar und eignet sich hervorragend für den Handel mit mittellangen Trends.
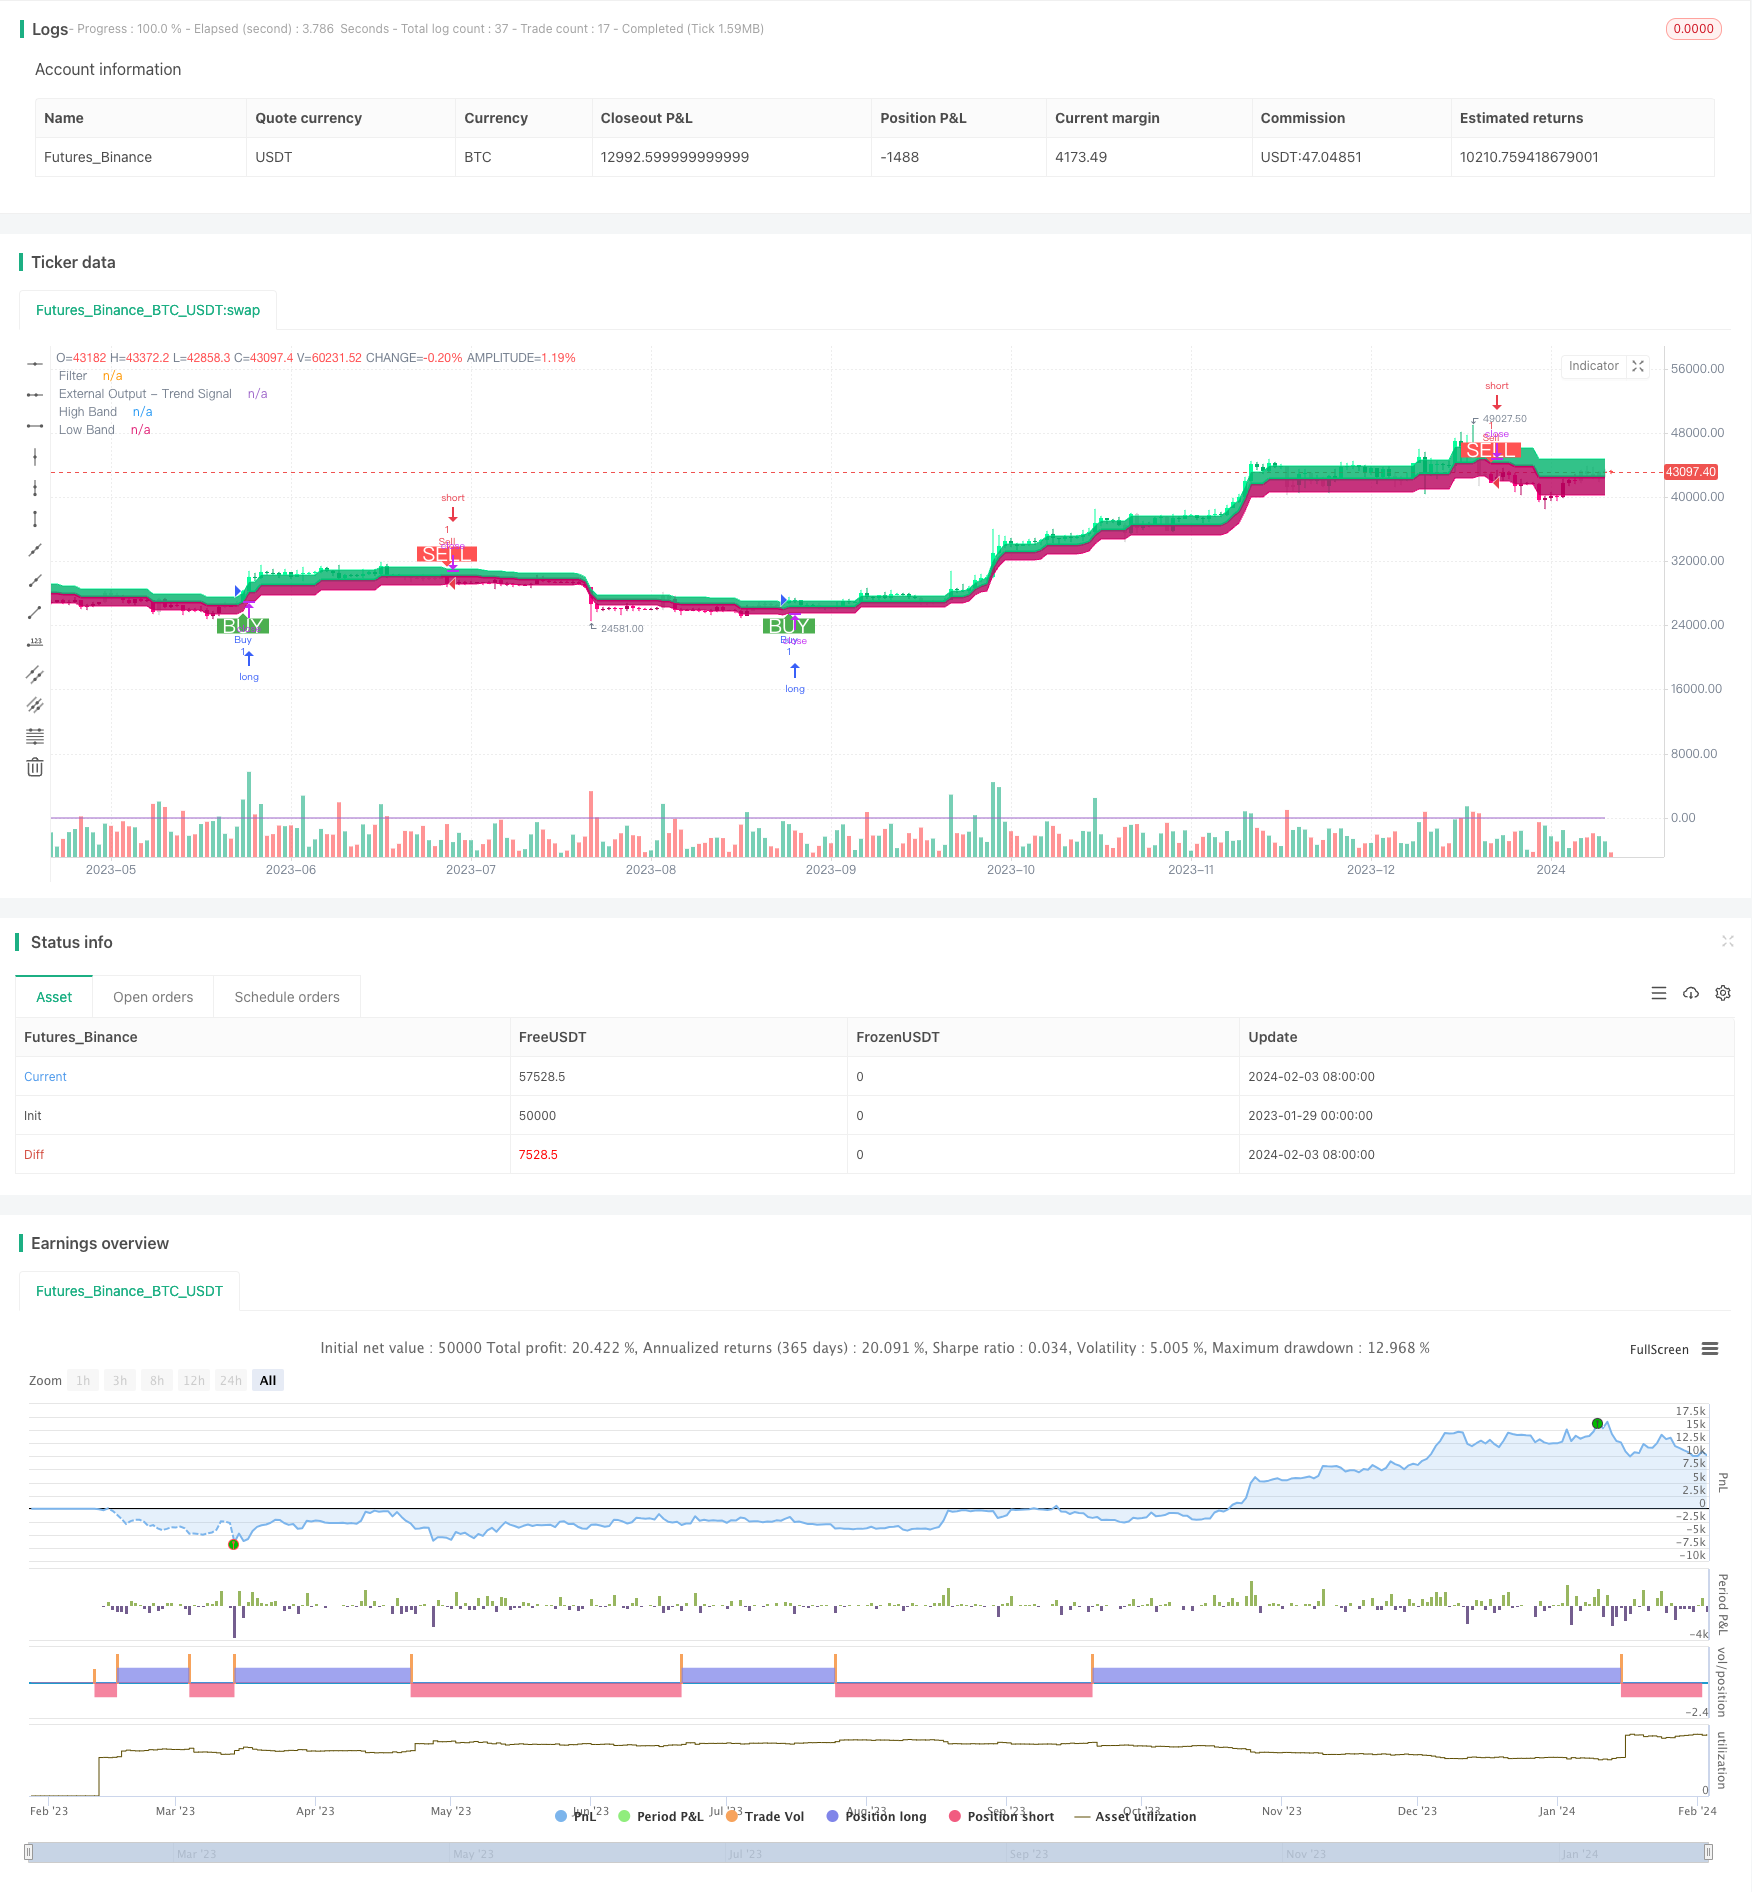
/*backtest
start: 2023-01-29 00:00:00
end: 2024-02-04 00:00:00
period: 1d
basePeriod: 1h
exchanges: [{"eid":"Futures_Binance","currency":"BTC_USDT"}]
*/

//@version=4
strategy("Range Filter [DW] & Labels", shorttitle="RF [DW] & Labels", overlay=true)

//Conditional Sampling EMA Function
Cond_EMA(x, cond, n)=>
    var val     = array.new_float(0)
    var ema_val = array.new_float(1)
    if cond
        array.push(val, x)
        if array.size(val) > 1
            array.remove(val, 0)
        if na(array.get(ema_val, 0))
            array.fill(ema_val, array.get(val, 0))
        array.set(ema_val, 0, (array.get(val, 0) - array.get(ema_val, 0))*(2/(n + 1)) + array.get(ema_val, 0))
    EMA = array.get(ema_val, 0)
    EMA

//Conditional Sampling SMA Function
Cond_SMA(x, cond, n)=>
    var vals = array.new_float(0)
    if cond
        array.push(vals, x)
        if array.size(vals) > n
            array.remove(vals, 0)
    SMA = array.avg(vals)
    SMA

//Standard Deviation Function
Stdev(x, n)=>
    sqrt(Cond_SMA(pow(x, 2), 1, n) - pow(Cond_SMA(x, 1, n), 2))

//Range Size Function
rng_size(x, scale, qty, n)=>
    ATR      = Cond_EMA(tr(true), 1, n)
    AC       = Cond_EMA(abs(x - x[1]), 1, n)
    SD       = Stdev(x, n)
    rng_size = scale=="Pips" ? qty*0.0001 : scale=="Points" ? qty*syminfo.pointvalue : scale=="% of Price" ? close*qty/100 : scale=="ATR" ? qty*ATR :
               scale=="Average Change" ? qty*AC : scale=="Standard Deviation" ? qty*SD : scale=="Ticks" ? qty*syminfo.mintick : qty

//Two Type Range Filter Function
rng_filt(h, l, rng_, n, type, smooth, sn, av_rf, av_n)=>
    rng_smooth = Cond_EMA(rng_, 1, sn)
    r          = smooth ? rng_smooth : rng_
    var rfilt  = array.new_float(2, (h + l)/2)
    array.set(rfilt, 1, array.get(rfilt, 0))
    if type=="Type 1"
        if h - r > array.get(rfilt, 1)
            array.set(rfilt, 0, h - r)
        if l + r < array.get(rfilt, 1)
            array.set(rfilt, 0, l + r)
    if type=="Type 2"
        if h >= array.get(rfilt, 1) + r
            array.set(rfilt, 0, array.get(rfilt, 1) + floor(abs(h - array.get(rfilt, 1))/r)*r)
        if l <= array.get(rfilt, 1) - r
            array.set(rfilt, 0, array.get(rfilt, 1) - floor(abs(l - array.get(rfilt, 1))/r)*r)
    rng_filt1 = array.get(rfilt, 0)
    hi_band1  = rng_filt1 + r
    lo_band1  = rng_filt1 - r
    rng_filt2 = Cond_EMA(rng_filt1, rng_filt1 != rng_filt1[1], av_n)
    hi_band2  = Cond_EMA(hi_band1, rng_filt1 != rng_filt1[1], av_n)
    lo_band2  = Cond_EMA(lo_band1, rng_filt1 != rng_filt1[1], av_n)
    rng_filt  = av_rf ? rng_filt2 : rng_filt1
    hi_band   = av_rf ? hi_band2 : hi_band1
    lo_band   = av_rf ? lo_band2 : lo_band1
    [hi_band, lo_band, rng_filt]

//-----------------------------------------------------------------------------------------------------------------------------------------------------------------
//Inputs
//-----------------------------------------------------------------------------------------------------------------------------------------------------------------

//Filter Type
f_type = input(defval="Type 1", options=["Type 1", "Type 2"], title="Filter Type")

//Movement Source
mov_src = input(defval="Close", options=["Wicks", "Close"], title="Movement Source")

//Range Size Inputs
rng_qty   = input(defval=2.618, minval=0.0000001, title="Range Size")
rng_scale = input(defval="Average Change", options=["Points", "Pips", "Ticks", "% of Price", "ATR", "Average Change", "Standard Deviation", "Absolute"], title="Range Scale")

//Range Period
rng_per = input(defval=14, minval=1, title="Range Period (for ATR, Average Change, and Standard Deviation)")

//Range Smoothing Inputs
smooth_range = input(defval=true, title="Smooth Range")
smooth_per   = input(defval=27, minval=1, title="Smoothing Period")

//Filter Value Averaging Inputs
av_vals    = input(defval=true, title="Average Filter Changes")
av_samples = input(defval=2, minval=1, title="Number Of Changes To Average")

// New inputs for take profit and stop loss
take_profit_percent = input(defval=100.0, minval=0.1, maxval=1000.0, title="Take Profit Percentage", step=0.1)
stop_loss_percent = input(defval=100, minval=0.1, maxval=1000.0, title="Stop Loss Percentage", step=0.1)

//-----------------------------------------------------------------------------------------------------------------------------------------------------------------
//Definitions
//-----------------------------------------------------------------------------------------------------------------------------------------------------------------

//High And Low Values
h_val = mov_src=="Wicks" ? high : close
l_val = mov_src=="Wicks" ? low : close

//Range Filter Values
[h_band, l_band, filt] = rng_filt(h_val, l_val, rng_size((h_val + l_val)/2, rng_scale, rng_qty, rng_per), rng_per, f_type, smooth_range, smooth_per, av_vals, av_samples)

//Direction Conditions
var fdir = 0.0
fdir    := filt > filt[1] ? 1 : filt < filt[1] ? -1 : fdir
upward   = fdir==1 ? 1 : 0
downward = fdir==-1 ? 1 : 0

//Colors
filt_color = upward ? #05ff9b : downward ? #ff0583 : #cccccc
bar_color  = upward and (close > filt) ? (close > close[1] ? #05ff9b : #00b36b) :
             downward and (close < filt) ? (close < close[1] ? #ff0583 : #b8005d) : #cccccc

//-----------------------------------------------------------------------------------------------------------------------------------------------------------------
//Outputs
//-----------------------------------------------------------------------------------------------------------------------------------------------------------------

//Filter Plot
filt_plot = plot(filt, color=filt_color, transp=0, linewidth=3,  title="Filter")

//Band Plots
h_band_plot = plot(h_band, color=#05ff9b, transp=100, title="High Band")
l_band_plot = plot(l_band, color=#ff0583, transp=100, title="Low Band")

//Band Fills
fill(h_band_plot, filt_plot, color=#00b36b, transp=85, title="High Band Fill")
fill(l_band_plot, filt_plot, color=#b8005d, transp=85, title="Low Band Fill")

//Bar Color
barcolor(bar_color)

//External Trend Output
plot(fdir, transp=100, editable=false, display=display.none, title="External Output - Trend Signal")

// Trading Conditions Logic
longCond = close > filt and close > close[1] and upward > 0 or close > filt and close < close[1] and upward > 0
shortCond = close < filt and close < close[1] and downward > 0 or close < filt and close > close[1] and downward > 0

CondIni = 0
CondIni := longCond ? 1 : shortCond ? -1 : CondIni[1]
longCondition = longCond and CondIni[1] == -1
shortCondition = shortCond and CondIni[1] == 1

// Strategy Entry and Exit
strategy.entry("Buy", strategy.long, when = longCondition)
strategy.entry("Sell", strategy.short, when = shortCondition)

// New: Close conditions based on percentage change
long_take_profit_condition = close > strategy.position_avg_price * (1 + take_profit_percent / 100)
short_take_profit_condition = close < strategy.position_avg_price * (1 - take_profit_percent / 100)

long_stop_loss_condition = close < strategy.position_avg_price * (1 - stop_loss_percent / 100)
short_stop_loss_condition = close > strategy.position_avg_price * (1 + stop_loss_percent / 100)

strategy.close("Buy", when = shortCondition or long_take_profit_condition or long_stop_loss_condition)
strategy.close("Sell", when = longCondition or short_take_profit_condition or short_stop_loss_condition)

// Plot Buy and Sell Labels
plotshape(longCondition, title = "Buy Signal", text ="BUY", textcolor = color.white, style=shape.labelup, size = size.normal, location=location.belowbar, color = color.green, transp = 0)
plotshape(shortCondition, title = "Sell Signal", text ="SELL", textcolor = color.white, style=shape.labeldown, size = size.normal, location=location.abovebar, color = color.red, transp = 0)

// Alerts
alertcondition(longCondition, title="Buy Alert", message = "BUY")
alertcondition(shortCondition, title="Sell Alert", message = "SELL")