Dynamische Hüllkurven-Gleitende-Durchschnitts-Strategie
Überblick
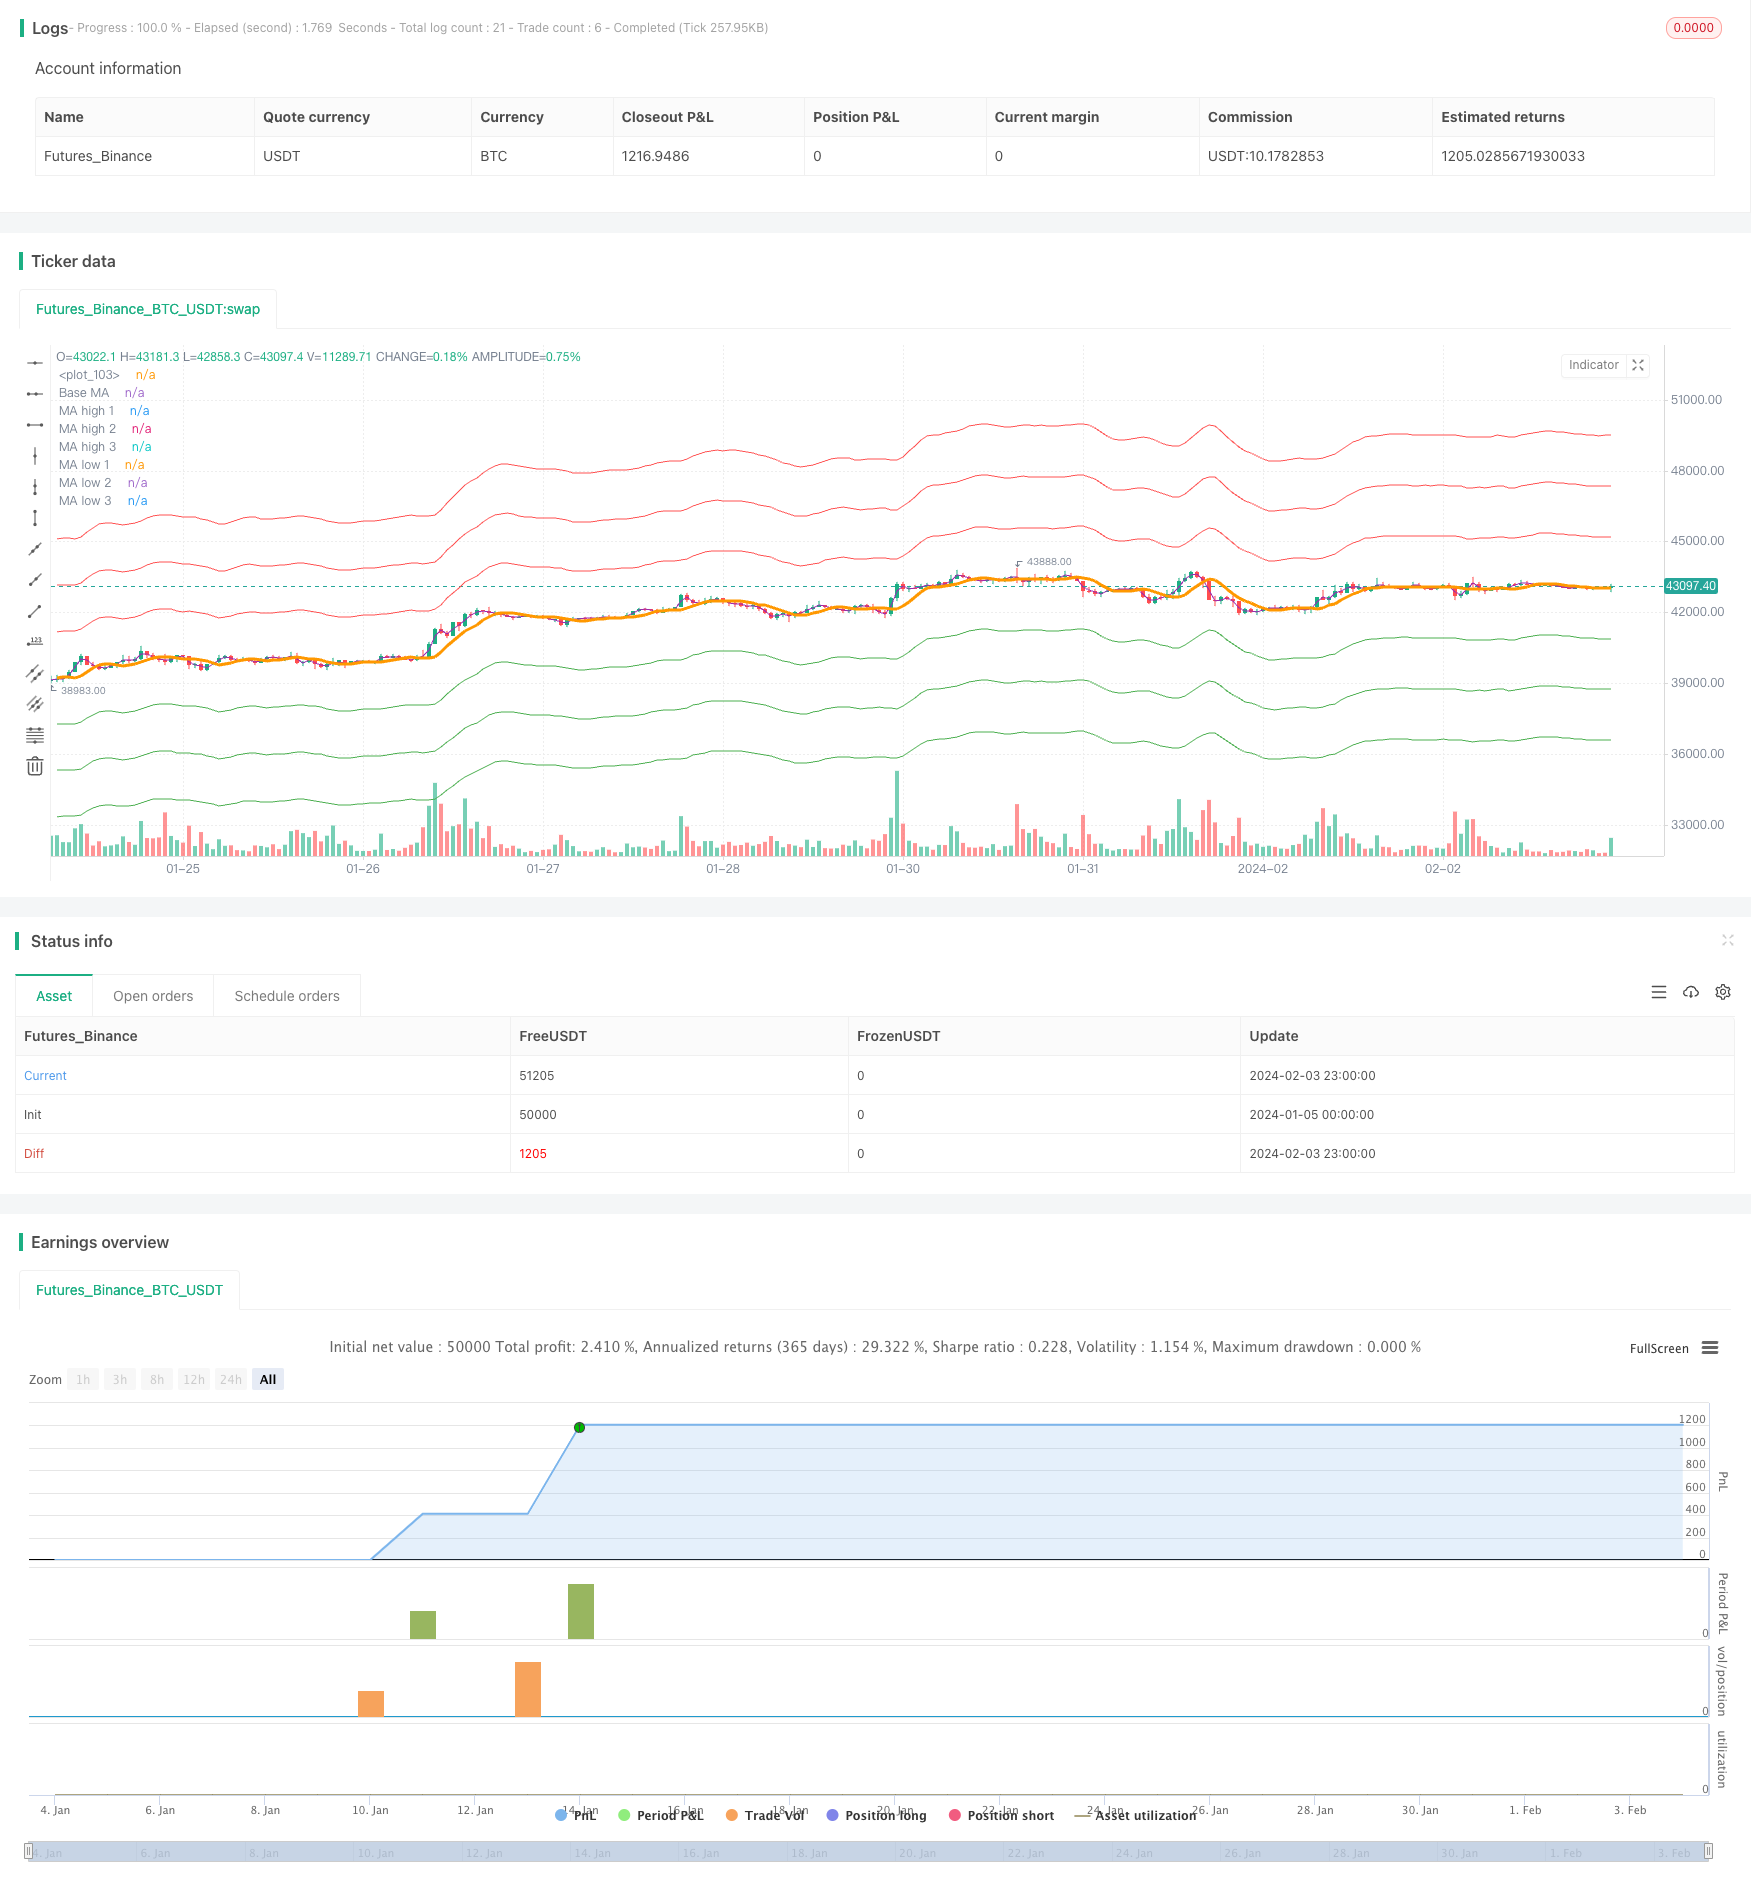
Die Strategie basiert auf Moving Averages und Dynamic Pairing Lines und ermöglicht einen mehrspurigen, wechselseitigen Handel. Sie verfolgt Preise, die die Up-Down-Pairing-Line durchbrechen, um eine Position zu erstellen, und platziert, wenn die Preise wieder unter die Basis-Evenlines fallen. Die Strategie ist für Aktien und digitale Währungen geeignet, bei denen ein Trend deutlich ist.
Strategieprinzip
Zunächst berechnet die Strategie die Basis-Mittelwerte basierend auf den von den Benutzern gewählten Mittelwertarten und -längen. Häufige Mittelwerte umfassen SMA, EMA usw.
Dann berechnen Sie die Auf-und-Abschluss-Linie, basierend auf den vom Benutzer gesetzten Prozentparametern. Zum Beispiel 5% bedeutet, dass bei Preisschwankungen ALLOWED_BRACKET105% eine Position eingerichtet wird. Die Anzahl der Abschlusslinien kann angepasst werden.
Bei der Markteintrittsregel gilt: Wenn man die Unter- und die Obergrenze überschreitet, muss man mehr machen; wenn man die Obergrenze überschreitet, muss man leer machen. Die Regeln sind sehr einfach und klar.
Schließlich werden alle Positionen ausgeglichen, wenn der Preis wieder unter dem Referenzmittelwert fällt. Dies ist ein Ausgangspunkt für die Verfolgung des Trends.
Es ist zu beachten, dass diese Strategie die Aufteilung der Positionen ermöglicht. Wenn mehrere Packet-Linien vorhanden sind, werden die Mittel proportional verteilt. Dies vermeidet das Risiko eines einseitigen Spiels.
Analyse der Stärken
Die größten Vorteile dieser Strategie sind:
Die Funktion, Trends automatisch zu verfolgen, ist realisiert. Es ist sehr üblich, die Richtung der Trends mit der Durchschnittslinie zu bestimmen, so dass dies eine effektive Methode ist.
Durch die Verwendung von Umgebungsleitungen wird ein Teil des Geräusches gefiltert, wodurch ein Problem vermieden wird, das zu empfindlich ist und zu unnötigen Transaktionen führt. Eine vernünftige Einstellung der Parameter kann die Profitabilität der Strategie erheblich optimieren.
Die Aufteilung der Positionen erhöht die strategische Resilienz. Auch wenn ein einseitiger Durchbruch fehlschlägt, können die anderen Richtungen gut weiterlaufen. Dies optimiert die Gesamtrisikogewinnquote.
Es ist möglich, die Anzahl der Durchschnittslinien und Umschlaglinien anzupassen. Dies erhöht die Flexibilität der Strategie, und der Benutzer kann die Parameter für verschiedene Sorten anpassen.
Risikoanalyse
Die Hauptrisiken dieser Strategie sind:
Die Gleichlinien-Systeme sind nicht empfindlich für Gold-Cross-Klasse-Signale. Ohne klare Trends kann die Strategie einige Chancen verpassen.
Eine zu breite Linie erhöht die Anzahl der Transaktionen und die Gefahr von Ausrutschen. Eine zu schmale Linie kann einen größeren Fall verpassen. Die Suche nach einem Ausgleichspunkt erfordert umfangreiche Tests.
In einem bewegten Umfeld kann diese Strategie mit einer höheren Wahrscheinlichkeit eingesetzt werden. Daher ist die Auswahl der Sorten mit einem offensichtlichen Trend besser.
Der Aufbau von Split-Positions begrenzt den Gewinn pro Einheit. Wenn man nur einseitige Risiken eingehen will, braucht man zusätzliche Optimierungen.
Optimierungsrichtung
Die Strategie kann vor allem in folgenden Bereichen optimiert werden:
Umstellung auf andere Indikatoren zur Entscheidung über Lagerbau und Lagerhaltung. Zum Beispiel KDJ-Indikatoren usw. oder Kombination von mehreren Indikatoren zur Einstellung von Filterbedingungen.
Ein zusätzlicher Stop-Loss-System, der einen Teil der Gewinne sichern und einen Teil der Risiken vermeiden kann.
Optimierung der Parameter auf der Suche nach der optimalen Kombination aus Mittellinien und Umschlaglinien. Dies erfordert eine umfassende Rückverfolgung und Optimierung der Suche nach den optimalen Parameterpaaren.
Intelligente Parameteroptimierung in Kombination mit Technologien wie Deep Learning. Lernen und aktualisieren Parameter-Einstellungen mit der Zeit.
Die Varianten und die Marktdifferenzen berücksichtigt werden, indem mehrere Parameter für verschiedene Handelsumgebungen eingestellt werden. Dies erhöht die Strategie-Stabilität erheblich.
Zusammenfassen
Die Dynamic Packet Networks Linear Strategy eignet sich insgesamt sehr gut für Trend-Trading. Sie ist einfach und effizient, leicht zu verstehen und zu optimieren. Als Basisstrategie ist sie sehr plastisch und skalierbar. Durch die Integration mit anderen, komplexeren Systemen können die Gesamtergebnis- und Risikobereitschaftsindikatoren weiter optimiert werden.
/*backtest
start: 2024-01-05 00:00:00
end: 2024-02-04 00:00:00
period: 1h
basePeriod: 15m
exchanges: [{"eid":"Futures_Binance","currency":"BTC_USDT"}]
*/

//@version=5
strategy("Envelope Strategy", overlay=true, default_qty_type=strategy.percent_of_equity, default_qty_value=100, initial_capital=1000, pyramiding = 5, commission_type=strategy.commission.percent, commission_value=0.0)

// CopyRight Crypto Robot

src = input(ohlc4, title="Source", group = "Base MA")
ma_base_window = input.int(5, "Base Mooving Average Window", step = 1, group = "Base MA")
ma_type = input.string(defval='1. SMA', options=['1. SMA', '2. PCMA', '3. EMA', '4. WMA', '5. DEMA', '6. ZLEMA', '7. HMA'], title='MA Type', group = "Base MA")


envelope_1_pct = input.float(0.05, "Envelope 1", step = 0.01, group = "Envelopes")
envelope_2_pct = input.float(0.10, "Envelope 2", step = 0.01, group = "Envelopes")
envelope_3_pct = input.float(0.15, "Envelope 3", step = 0.01, group = "Envelopes")
envelope_4_pct = input.float(0.0, "Envelope 4", step = 0.01, group = "Envelopes")
envelope_5_pct = input.float(0.0, "Envelope 5", step = 0.01, group = "Envelopes")

use_longs = input.bool(true, 'Long Positions')
use_short = input.bool(true, 'Short Positions')

total_envelope = 0
if envelope_1_pct > 0
    total_envelope := total_envelope + 1
if envelope_2_pct > 0
    total_envelope := total_envelope + 1
if envelope_3_pct > 0
    total_envelope := total_envelope + 1
if envelope_4_pct > 0
    total_envelope := total_envelope + 1
if envelope_5_pct > 0
    total_envelope := total_envelope + 1

// ---------------------------------------------
// -------------- INDICATORS -------------------
ma_function(MA_type, MA_length) =>
    zlema_lag = (MA_length - 1) / 2
    hma_src = MA_type == '7. HMA' ? 2 * ta.wma(src, math.floor(MA_length / 2)) - ta.wma(src, MA_length) : na
    MA_type == '1. SMA' ? ta.sma(src, MA_length) : MA_type == '2. PCMA' ? (ta.highest(high, MA_length) + ta.lowest(low, MA_length)) / 2 : MA_type == '3. EMA' ? ta.ema(src, MA_length) : MA_type == '4. WMA' ? ta.wma(src, MA_length) : MA_type == '5. DEMA' ? 2 * ta.ema(src, MA_length) - ta.ema(ta.ema(src, MA_length), MA_length) : MA_type == '6. ZLEMA' ? ta.ema(src + src - src[zlema_lag], MA_length) : MA_type == '7. HMA' ? ta.wma(hma_src, math.floor(math.sqrt(MA_length))) : na


ma_base = ma_function(ma_type, ma_base_window)

ma_high_1 = envelope_1_pct > 0 ? ma_base * (1 + envelope_1_pct) : na
ma_high_2 = envelope_2_pct > 0 ? ma_base * (1 + envelope_2_pct) : na
ma_high_3 = envelope_3_pct > 0 ? ma_base * (1 + envelope_3_pct) : na
ma_high_4 = envelope_4_pct > 0 ? ma_base * (1 + envelope_4_pct) : na
ma_high_5 = envelope_5_pct > 0 ? ma_base * (1 + envelope_5_pct) : na

ma_low_1 = envelope_1_pct > 0 ? ma_base * (1 - envelope_1_pct) : na
ma_low_2 = envelope_2_pct > 0 ? ma_base * (1 - envelope_2_pct) : na
ma_low_3 = envelope_3_pct > 0 ? ma_base * (1 - envelope_3_pct) : na
ma_low_4 = envelope_4_pct > 0 ? ma_base * (1 - envelope_4_pct) : na
ma_low_5 = envelope_5_pct > 0 ? ma_base * (1 - envelope_5_pct) : na

// ---------------------------------------------
// --------------- STRATEGY --------------------
if use_longs
    if envelope_1_pct > 0 and strategy.opentrades < 1
        strategy.entry('long 1', strategy.long, limit=ma_low_1, qty=(strategy.equity / ma_low_1) * (1 / total_envelope))
    if envelope_2_pct > 0 and strategy.opentrades < 2
        strategy.entry('long 2', strategy.long, limit=ma_low_2, qty=(strategy.equity / ma_low_2) * (1 / total_envelope))
    if envelope_3_pct > 0 and strategy.opentrades < 3
        strategy.entry('long 3', strategy.long, limit=ma_low_3, qty=(strategy.equity / ma_low_3) * (1 / total_envelope))
    if envelope_4_pct > 0 and strategy.opentrades < 4
        strategy.entry('long 4', strategy.long, limit=ma_low_4, qty=(strategy.equity / ma_low_4) * (1 / total_envelope))
    if envelope_5_pct > 0 and strategy.opentrades < 5
        strategy.entry('long 5', strategy.long, limit=ma_low_5, qty=(strategy.equity / ma_low_5) * (1 / total_envelope))


if use_short
    if envelope_1_pct > 0 and strategy.opentrades < 1
        strategy.entry('short 1', strategy.short, limit=ma_high_1, qty=(strategy.equity / ma_high_1) * (1 / total_envelope))
    if envelope_2_pct > 0 and strategy.opentrades < 2
        strategy.entry('short 2', strategy.short, limit=ma_high_2, qty=(strategy.equity / ma_high_2) * (1 / total_envelope))
    if envelope_3_pct > 0 and strategy.opentrades < 3
        strategy.entry('short 3', strategy.short, limit=ma_high_3, qty=(strategy.equity / ma_high_3) * (1 / total_envelope))
    if envelope_4_pct > 0 and strategy.opentrades < 4
        strategy.entry('short 4', strategy.short, limit=ma_high_4, qty=(strategy.equity / ma_high_4) * (1 / total_envelope))
    if envelope_5_pct > 0 and strategy.opentrades < 5
        strategy.entry('short 5', strategy.short, limit=ma_high_5, qty=(strategy.equity / ma_high_5) * (1 / total_envelope))


strategy.exit('close', limit=ma_base)


// ---------------------------------------------
// ------------------ PLOT ---------------------

ma_base_plot = plot(ma_base, title = "Base MA", color = color.orange, linewidth = 3, offset = 1)

ma_high_1_plot = plot(ma_high_1, title = "MA high 1", color = color.red, offset = 1)
ma_high_2_plot = plot(ma_high_2, title = "MA high 2", color = color.red, offset = 1)
ma_high_3_plot = plot(ma_high_3, title = "MA high 3", color = color.red, offset = 1)
ma_high_4_plot = plot(ma_high_4, title = "MA high 4", color = color.red, offset = 1)
ma_high_5_plot = plot(ma_high_5, title = "MA high 5", color = color.red, offset = 1)

ma_low_1_plot = plot(ma_low_1, title = "MA low 1", color = color.green, offset = 1)
ma_low_2_plot = plot(ma_low_2, title = "MA low 2", color = color.green, offset = 1)
ma_low_3_plot = plot(ma_low_3, title = "MA low 3", color = color.green, offset = 1)
ma_low_4_plot = plot(ma_low_4, title = "MA low 4", color = color.green, offset = 1)
ma_low_5_plot = plot(ma_low_5, title = "MA low 5", color = color.green, offset = 1)

plot(ohlc4, color=color.purple)

// use_period = input.bool(false, "Période spécifique ?", group="periode")
// startDate = input.time(timestamp("01 Jan 2020"), "Date de début", group="periode")
// endDate = input.time(timestamp("01 Jan 2025"), "Date de fin", group="periode")


//------------------------------------------
//-------------Indicateurs------------------

// inDateRange = use_period ? ((time >= startDate) and (time < endDate)) : true

// //--------------Backtest-------------------

// strategy_pnl = strategy.netprofit + strategy.openprofit
// bnh_strategy_pnl_pcnt = (strategy_pnl / strategy.initial_capital) * 100

// float bnh_start_bar = na
// bnh_start_bar := na(bnh_start_bar[1]) or inDateRange != true? close : bnh_start_bar[1]
// float bnl_buy_hold_equity = na
// bnl_buy_hold_equity :=  inDateRange == true ? ((close - bnh_start_bar)/bnh_start_bar) * 100 : bnl_buy_hold_equity[1]

// bnh_vs_diff = bnh_strategy_pnl_pcnt - bnl_buy_hold_equity
// bnh_diff_color = bnh_vs_diff > 0 ? color.new(color.green, inDateRange ? 60 : 100) : color.new(color.red, inDateRange ? 60 : 100)

// var Table = table.new(position.top_right, columns = 2, rows = 4, border_width = 1, bgcolor = color.black, border_color = color.gray)
// table.cell(table_id = Table, column = 0, row = 0, text_color=(bnh_strategy_pnl_pcnt>bnl_buy_hold_equity)?color.gray:color.green, text_size = size.normal, text = "Buy & hold profit")
// table.cell(table_id = Table, column = 1, row = 0, text_color=(bnh_strategy_pnl_pcnt>bnl_buy_hold_equity)?color.gray:color.green, text_size = size.normal, text = str.tostring(bnl_buy_hold_equity, '#.##') + ' %')
// table.cell(table_id = Table, column = 0, row = 1, text_color=(bnh_strategy_pnl_pcnt<bnl_buy_hold_equity)?color.gray:color.green, text_size = size.normal, text = "Strategy profit")
// table.cell(table_id = Table, column = 1, row = 1, text_color=(bnh_strategy_pnl_pcnt<bnl_buy_hold_equity)?color.gray:color.green, text_size = size.normal, text = str.tostring(bnh_strategy_pnl_pcnt, '#.##') + ' %')
// table.cell(table_id = Table, column = 0, row = 2, text_color=color.yellow, text_size = size.normal, text = "Date de début")
// table.cell(table_id = Table, column = 1, row = 2, text_color=color.yellow, text_size = size.normal, text = str.format("{0,date,dd-MM-YYYY}",strategy.closedtrades.entry_time(1)))