Durchbruch-Momentum-Strategie basierend auf dem gleitenden Durchschnitt des Goldenen Kreuzes
Überblick
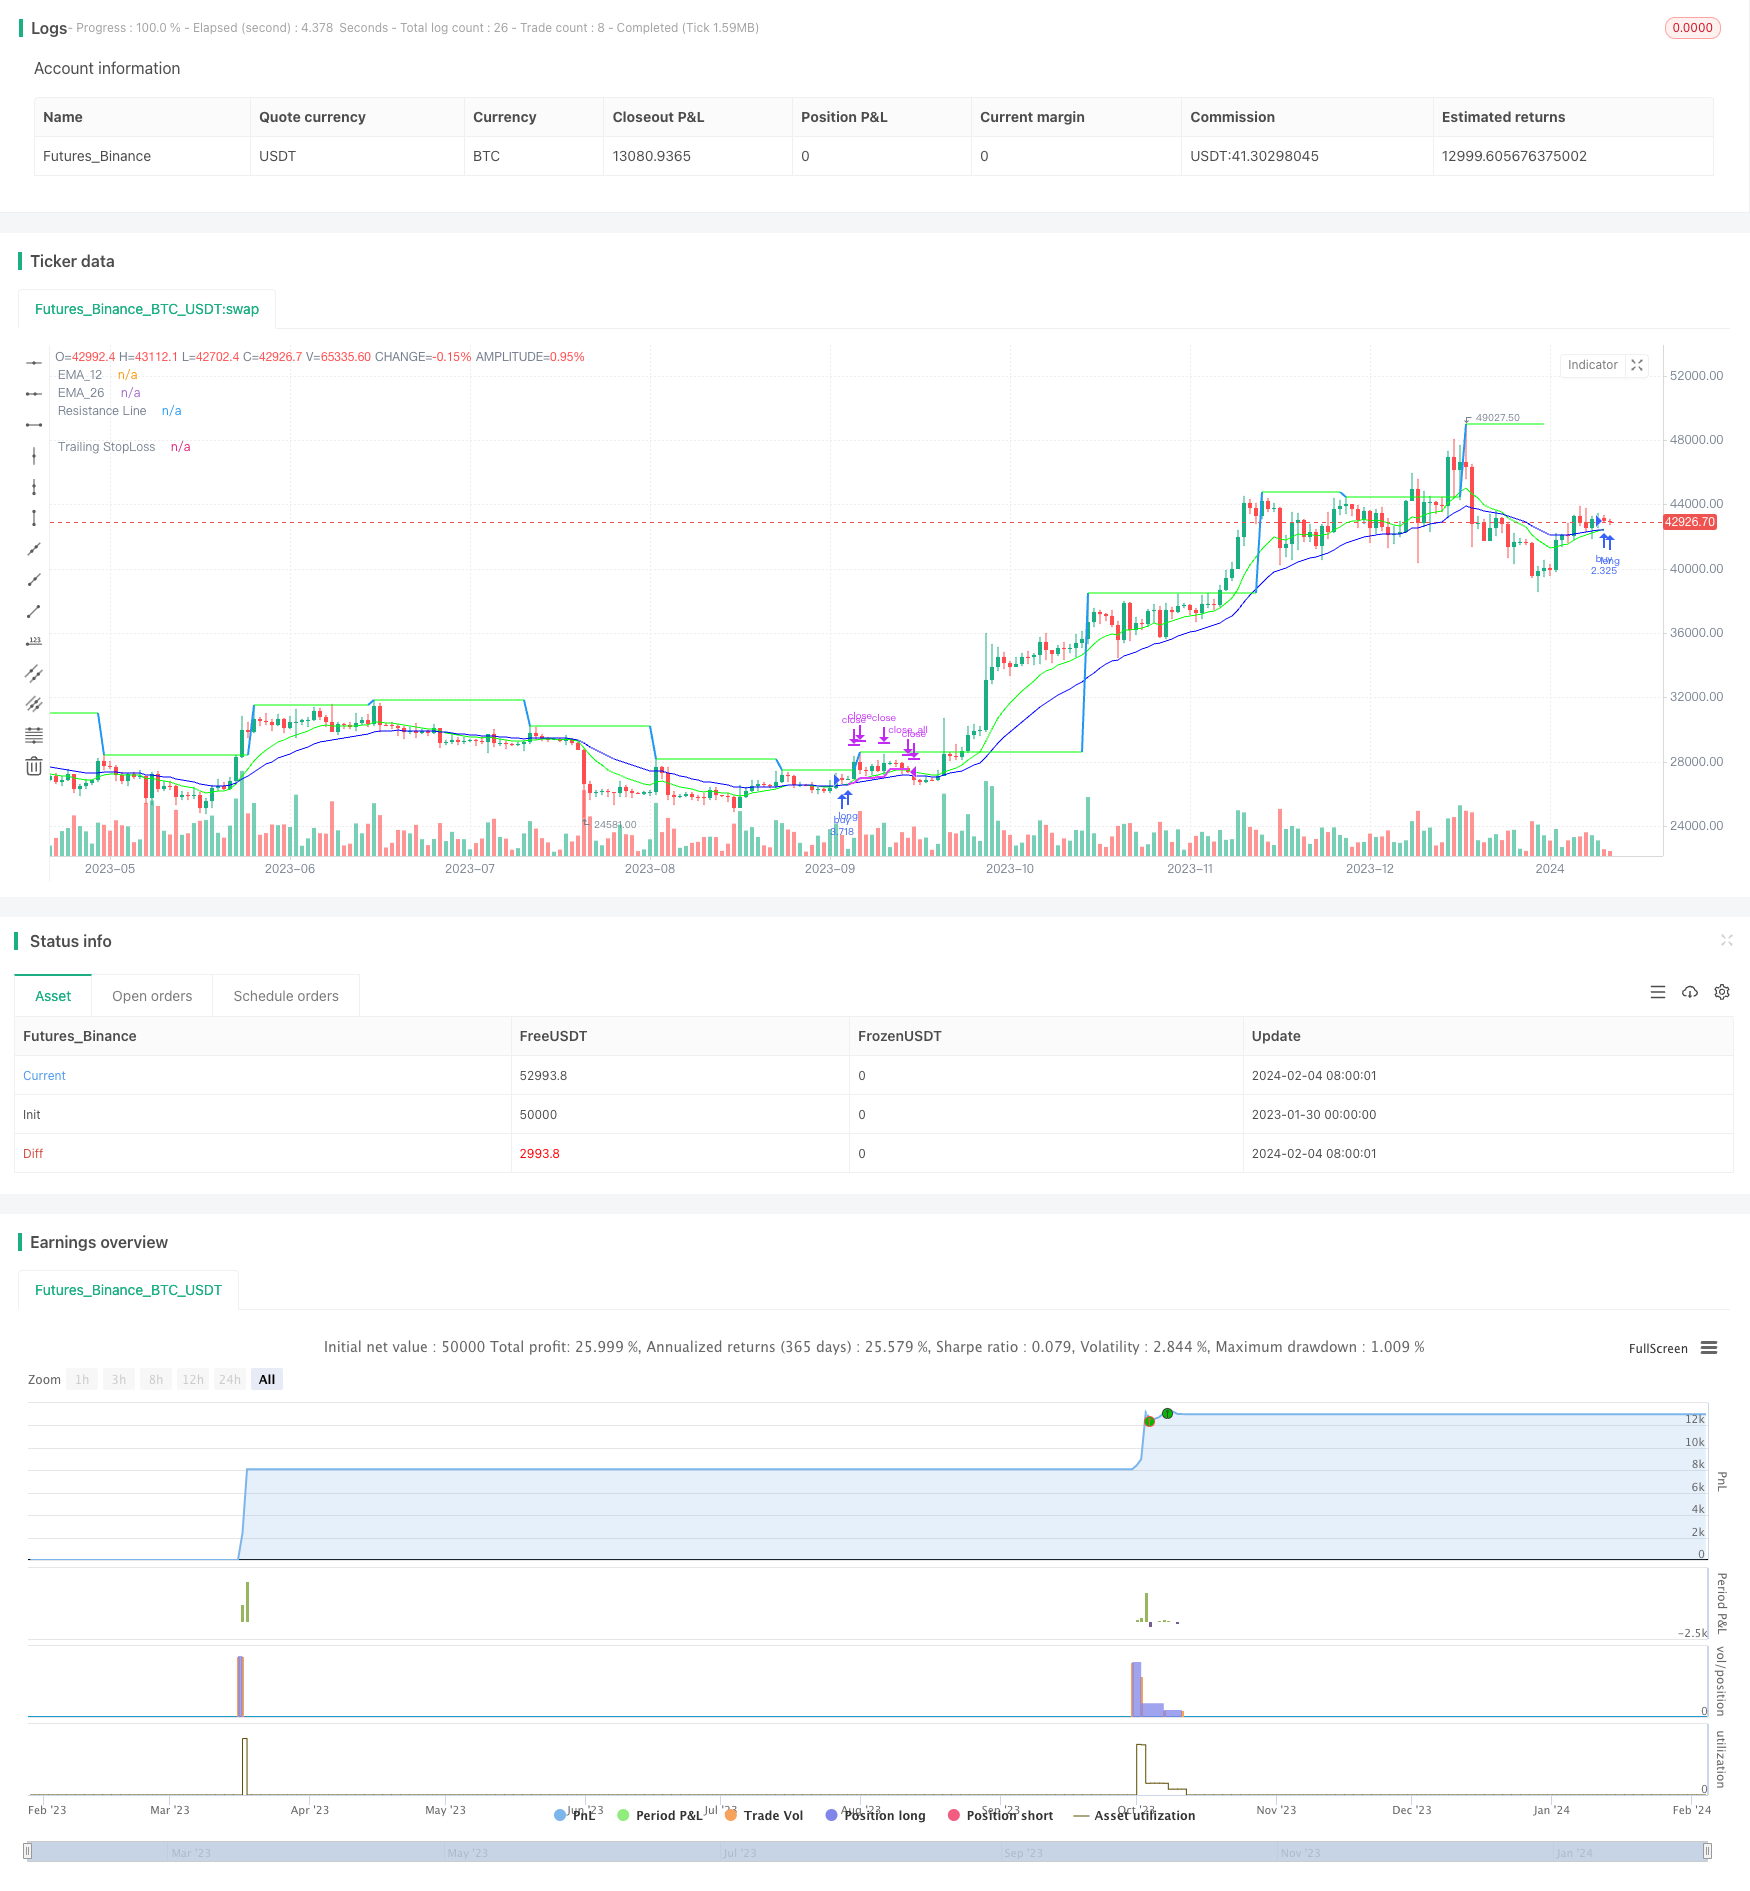
Die Strategie basiert auf dem 12-Tage-Index-Moving-Average (EMA) und dem 26-Tage-EMA als Einstiegssignal. Um falsche Durchbrüche zu filtern, wird der MACD-Indikator eingeführt, um den Markttrend zu beurteilen, und der RSI, um zu beurteilen, ob er sich in einem überkauften und überverkauften Bereich befindet. Die Strategie beurteilt auch, ob der Preis die Widerstandslage durchbricht, um den Trend zu bestätigen.
Die Strategie bietet drei Optionen für den Stop-Loss: Tracking-Stops, Linear-Stops und Linear-Forkings. Für den Stop-Loss bietet die Strategie zwei Sequenz-Stop-Ziele.
Strategieprinzip
Eintrittszeichen
- 12. EMA überschreitet 26. EMA bildet Goldfork
- Der MACD-Indikator ist positiv und die MACD-Linie ist höher als die Signal-Linie
- RSI-Werte liegen innerhalb des festgelegten Bereichs
- Der Schlusskurs liegt über der 21. EMA und der 7. SMA.
Eintrittsbestätigung
- Optionale Beurteilung: Der Preis durchbricht die dynamische Widerstandslage
Verlustbewältigung
- Tracking-Stop: Setzen Sie den Tracking-Stop-Prozentsatz auf Basis des Einstiegspreises und der eingestellten Tracking-Stop-Position
- Durchschnittsstop: Schlusskurs unter dem 7. SMA-Stop
- Durchschnittsschwenk: 12-Tage EMA unter Durchbruch der 26-Tage EMA
Wie man das aufhält
- Setzen Sie zwei aufeinanderfolgende Stop-Off-Ziele, die nach dem ersten Stop-Off-Trigger einen Teil der Menge verkaufen und nach dem zweiten Stop-Off-Trigger die gesamte Menge verkaufen
Strategische Vorteile
- Mit Hilfe eines linearen Filtersystems werden falsche Signale gefiltert, um die Einstiegsgenauigkeit zu verbessern.
- Mehrere Optionen für Stop Loss für verschiedene Arten von Tradern
- Dynamische Tracking-Stopp-Verluste für die Risikokontrolle
- Das Ziel ist es, die Spieler in Gruppen auszuschalten und einen Teil der Gewinne zu sichern.
Strategisches Risiko
- Bei Marktschwankungen erzeugen die EMAs mehr Falschsignale
- Tracking-Stop-Loss kann nach dem Durchbruch aufgelöst werden
- Die mittlere Linie-Fork-Stopp kann nicht rechtzeitig gestoppt werden, wenn sich der Trend umkehrt
Gegenmaßnahmen:
- Der MACD-Indikator wird verwendet, um die tatsächliche Marktentwicklung zu bestimmen.
- Anpassung der Höhe der Tracking-Stopp-Verluste
- Alternative oder kombinierte Stop-Off-Methoden
Richtung der Strategieoptimierung
- Optimierung der EMA-Parameter zur Bestimmung der optimalen Kombination von Parametern
- Verschiedene Stop-Methoden und Parameter testen, um die beste Stop-Solution zu finden
- Verschiedene Bremsparameter testen und die Bremswirkung optimieren
- Zeit für den Einstieg in Kombination mit anderen Indikatoren
- Anpassungen für verschiedene Sorten und Periodenparameter
Zusammenfassen
Die Strategie basiert auf dem Gleichgewichtssystem als Haupthandelssignal und unterstützt die Eintrittsfilterung mit Indikatoren wie MACD, RSI usw. Die Stop-Loss-Methode und das Stop-Stop-Ziel sind optimiert und können mit Parametern angepasst werden, um verschiedene Arten von Anlegern zu entsprechen. Der Spielraum für die Optimierung der Strategie ist groß und kann anhand von Eintrittssignalen, Stop-Loss-Methoden und Stop-Stop-Zielen getestet und verbessert werden.
/*backtest
start: 2023-01-30 00:00:00
end: 2024-02-05 00:00:00
period: 1d
basePeriod: 1h
exchanges: [{"eid":"Futures_Binance","currency":"BTC_USDT"}]
*/

// This source code is subject to the terms of the Mozilla Public License 2.0 at https://mozilla.org/MPL/2.0/
// © AbdulRahimShama
//@version=5


strategy('12/26-IT strategy', overlay=true,initial_capital = 100000)


Show_Only_12_26_Crossover_Entry = input.bool(true, group = "Entry_Exit Criteria")
Show_12_26_Crossover_and_resistance_Entry = input.bool(false, group = "Entry_Exit Criteria")


Show_TSL_StopLoss = input.bool(true, group = "Entry_Exit Criteria")
Show_Crossdown_StopLoss = input.bool(true, group = "Entry_Exit Criteria")
Show_SMA7_StopLoss = input.bool(false, group = "Entry_Exit Criteria")


////////////////////////////////////////////////
////////////////TARGETS INPUT
////////////////////////////////////////////////

////////Target1

TargetPerc1 = input.float(title="Target (%)", minval=0,defval=5, group="Target-1") / 100
TargetPrice1 = strategy.position_avg_price * (1 + TargetPerc1)
Target1_exit_qty = input.int(50, group="Target-1",tooltip = "% qty to sell when Target1 is reached")


////////Target2

TargetPerc2 = input.float(title="Target (%)", minval=0,defval=10, group="Target-2") / 100
TargetPrice2 = strategy.position_avg_price * (1 + TargetPerc2)
Target2_exit_qty = input.int(100, group="Target-2",tooltip = "% qty to sell when Target2 is reached")


////////////////////////////////////////////////
////////////////TRAILING STOP LOSS
////////////////////////////////////////////////


TSLsource = input(low, title="TSL Source", group="Trailing StopLoss")

longTrailPerc = input.float(title='Trail Long Loss (%)', minval=0.0, step=0.1, defval=1, group="Trailing StopLoss") * 0.01

TrailStopPrice = 0.0

TrailStopPrice := if strategy.position_size > 0
    sPIVOT_highValue = TSLsource * (1 - longTrailPerc)
    math.max(sPIVOT_highValue, TrailStopPrice[1])
else
    0

TSL = close < TrailStopPrice
plot(series=strategy.position_size > 0 and Show_TSL_StopLoss ? TrailStopPrice : na, color=color.new(color.fuchsia, 0), style=plot.style_linebr, linewidth=2, title='Trailing StopLoss')


////////////////////////////////////////////////
////////////////Moving Averages
////////////////////////////////////////////////


EMA_12=ta.ema(close, 12)
EMA_26=ta.ema(close, 26)
EMA_21=ta.ema(close,21)

plot(EMA_12, title="EMA_12", color=color.rgb(0, 255, 0), offset=0, linewidth=1)
plot(EMA_26, title="EMA_26", color=color.rgb(0, 0, 255), offset=0, linewidth=1)
plot(Show_SMA7_StopLoss ? ta.sma(close,7) : na, title="SMA_7", color=color.rgb(255, 0, 0), offset=0, linewidth=1)


////////////////////////////////////////////////
////////////////RESISTANCE INPUT and PLOTTING
////////////////////////////////////////////////

CrossOverLookbackCandles = input.int(10, group= "RESISTANCE")

resistanceSRC = input(high, group= "RESISTANCE")
resistanceLEFT = input(10, group= "RESISTANCE")
resistanceRIGHT = input(10, group= "RESISTANCE")

hih = ta.pivothigh(resistanceSRC, resistanceLEFT, resistanceRIGHT)
top = ta.valuewhen(hih, resistanceSRC[resistanceRIGHT], 0)

res = plot(top, color=top != top[1] ? na : color.new(#00ff00, 50), offset=-resistanceLEFT, linewidth=2, title="Resistance Line")

EMA_12_Low = ta.lowest(EMA_12, CrossOverLookbackCandles)
EMA_26_Low = ta.lowest(EMA_26, CrossOverLookbackCandles)


////////////////////////////////////////////////
////////////////RSI INPUT and PLOTTING
////////////////////////////////////////////////
RSI = ta.rsi(close, 14)
RSILowerRange = input.int(50, tooltip = "RSI value should be ABOVE this value for entry", group = "RSI")
RSIUpperRange = input.int(70, tooltip = "RSI value should be BELOW this value for entry", group = "RSI")


////////////////////////////////////////////////
////////////////MACD
////////////////////////////////////////////////
fast_length = 12
slow_length = 26
MACD_src = close
signal_length = 9

fast_ma = ta.ema(MACD_src, fast_length)
slow_ma = ta.ema(MACD_src, slow_length)
macd = fast_ma - slow_ma
signal = ta.ema(macd, signal_length)
hist = macd - signal


////////////////////////////////////////////////
////////////////ENTRY CRITERIA
////////////////////////////////////////////////


BUYVALUE= input(100000, tooltip = "Buy qty displayed on chart will be based on this value")

BASEENTRY = macd > signal and RSI > RSILowerRange and RSI < RSIUpperRange and close > EMA_21 and close > ta.sma(close, 7)


Entry= ta.crossover(EMA_12, EMA_26) and BASEENTRY
Entry2 = ta.crossover(close, top) and EMA_12_Low < EMA_26_Low and EMA_12 > EMA_26 and RSI < 70

////////////////////////////////////////////////
////////////////BUY SELL STRATEGY
////////////////////////////////////////////////

if ((Entry and Show_Only_12_26_Crossover_Entry))
    strategy.entry("buy", strategy.long, qty=BUYVALUE/close)

if (Entry2 and Show_12_26_Crossover_and_resistance_Entry)
    strategy.entry("buy", strategy.long, qty=BUYVALUE/close)

strategy.exit("Tg1", "buy", limit=TargetPrice1, qty_percent = Target1_exit_qty)
strategy.exit("Tg2", "buy", limit=TargetPrice2, qty_percent = Target2_exit_qty)


if TSL and Show_TSL_StopLoss and close < EMA_12
    strategy.close_all ("sl")

if ta.crossunder(EMA_12, EMA_26) and Show_Crossdown_StopLoss
    strategy.close_all ("sl")

if ta.crossunder(close, ta.sma(close, 7)) and Show_SMA7_StopLoss
    strategy.close_all ("sl")