Basierend auf der Two-Way Movement Index Strategie
Überblick
Die Strategie erzeugt ein Kaufsignal, wenn die DI+ über die DI+ liegt und die ADX über 25 liegt. Die Stop-Loss-Signal ist die DI+ über die DI+ liegt und die ADX über 30 liegt.
Strategieprinzip
Berechnen von DI+, DI- und ADX
- Der Aufruf der Funktion ta.dmi () berechnet DI+, DI- und ADX
- DI+/DI-Reflektieren der Preisrichtung
- Der ADX zeigt die durchschnittliche Größe der Preisänderungen
Berechnung des Index Moving Average EMA
- Berechnen Sie EMA mit der benutzerdefinierten Funktion my_ema ()
- Die EMA kann die Preise wirkungsvoll glätten
Handelssignale erzeugt
- Kaufsignal: DI+ auf DI- und ADX> 20 und Schlusskurs> EMA
- Die Preisentwicklung zeigt einen höheren Trend und größere Veränderungen.
- Verkaufssignal: DI-unter DI+ und ADX> 25 und Schlusskurs < EMA
- Die Preisentwicklung ist nach unten geführt und die Veränderungen sind größer.
- Kaufsignal: DI+ auf DI- und ADX> 20 und Schlusskurs> EMA
Stop-Loss-Transaktionen
- Kaufen Sie Stop-Loss: DI+ auf DI und ADX> 30
- Die Umkehrung der Preise
- Verkauf von Stop-Loss: DI+ unter DI- und ADX> 30
- Die Umkehrung der Preise
- Kaufen Sie Stop-Loss: DI+ auf DI und ADX> 30
Zusammenfassend kann man sagen, dass die Strategie die Bewegungsmenge und die Trendindikatoren kombiniert, um ein Handelssignal zu erzeugen, wenn die Preisentwicklung stark ist. Gleichzeitig werden die Stop-Loss-Bedingungen festgelegt, um den Verlust zu begrenzen.
Analyse der Stärken
- Vermeidung von Falschsignalen mit Dual-DI
- Ein einzelner DI ist leicht zu Fehlschlägen, die Kombination von DI+ und DI- gewährleistet Trends
- ADX-Bedingungen sorgen für größere Preisänderungen
- Händler sollten nur bei starken Preisschwankungen handeln, um Marktschwankungen zu vermeiden.
- EMA-Bedingungen für die DI
- Die EMA kann die langfristigen Trends in den Preisen erkennen.
- Strenge Stop-Loss-Bedingungen
- Schnelle Verringerung der Verluste und Vermeidung von Verlusten
Risikoanalyse
- Häufige Schadenersatz
- Wenn es zu starken Erschütterungen kommt, sind die Verluste zu häufig.
- Parameterabhängigkeit
- Die DI- und ADX-Parameter müssen optimiert werden, um die beste Kombination zu finden
- Niedrige Handelsfrequenz
- Strengere Handelsbedingungen verringern die Handelsfrequenz
Die Optimierung kann durch Erweiterung der Stop-Loss-Marge, Anpassung der Parameterkombination oder Hinzufügen zusätzlicher Filterbedingungen zur Erhöhung der Handelsfrequenz erfolgen.
Optimierungsrichtung
- Parameteroptimierung
- Optimierung der DI- und ADX-Parameter, um die optimale Kombination zu finden
- Filter hinzufügen
- Filterbedingungen wie Hinzufügen von Transaktionsmengen, Abweichungen usw.
- Erweiterung der Stop-Loss-Marge
- Entspannung bei den Stop-Loss-Bedingungen und weniger häufige Stop-Loss-Bedingungen
Zusammenfassen
Die Strategie integriert die Bewegungsmessung mit der Trendanalyse und erzeugt Handelssignale, wenn die Preisentwicklung stark ist. Die Strategie kann durch die Optimierung der Parameter, die Erhöhung der Signalfilter und die angemessene Erweiterung der Stop-Loss-Marge weiter verbessert werden.
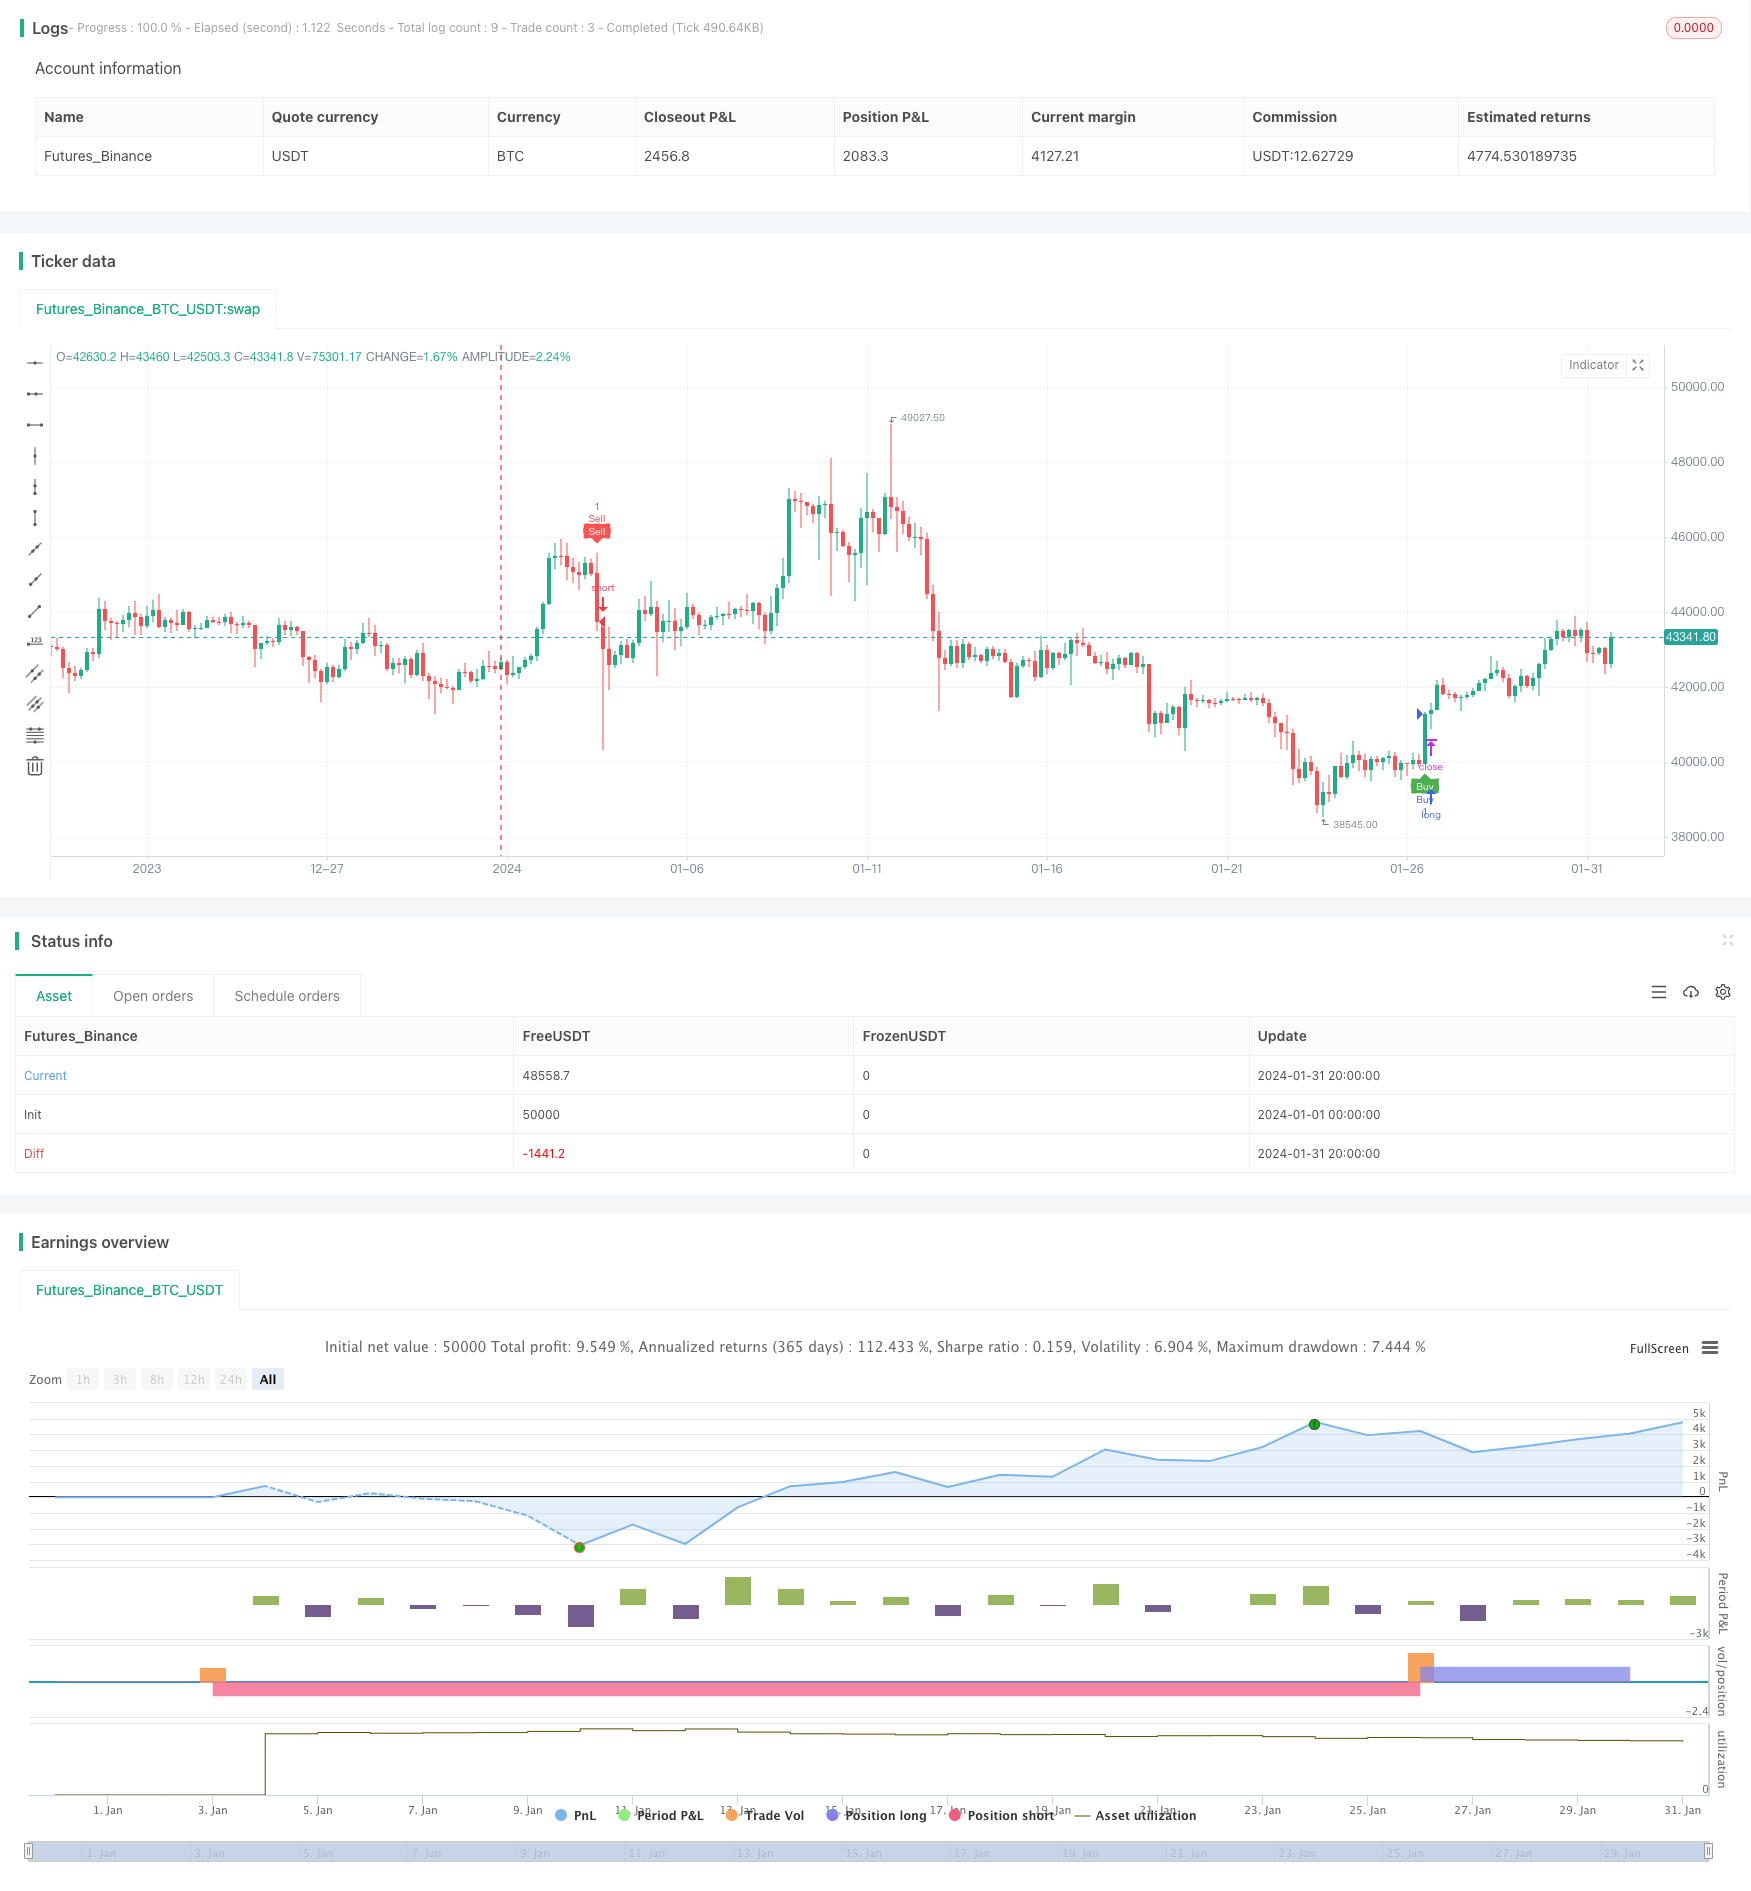
/*backtest
start: 2024-01-01 00:00:00
end: 2024-01-31 23:59:59
period: 4h
basePeriod: 15m
exchanges: [{"eid":"Futures_Binance","currency":"BTC_USDT"}]
*/

// This Pine Script™ code is subject to the terms of the Mozilla Public License 2.0 at https://mozilla.org/MPL/2.0/
// © Tamil_FNO_Trader

//@version=5
strategy("Overlay Signals by TFOT", overlay=true)

// Calculate DMI
len = input.int(14, minval=1, title="DI Length")
lensig = input.int(14, title="ADX Smoothing", minval=1, maxval=50)
[diplus, diminus, adx] = ta.dmi(len, lensig)

// Get EMA
emalen = input.int(26, minval=1, title = "EMA Length")
emasrc = input.source(close, title = "EMA Source")

my_ema(src, length) =>
    alpha = 2 / (length + 1)
    sum = 0.0
    sum := na(sum[1]) ? src : alpha * src + (1 - alpha) * nz(sum[1])
EMA2 = my_ema(emasrc, emalen)

// Variables
var bool buycondition1 = false
var bool sellcondition1 = false

var int firstbuybar = na
var int firstsellbar = na

var int buyexitbar = na
var int sellexitbar = na

var bool buyexit1 = false
var bool sellexit1 = false

// Buy & Sell Conditions
buycondition1 := (ta.crossover(diplus, diminus)) and (adx > 20) and (close > EMA2) and na(firstbuybar)
sellcondition1 := (ta.crossover(diminus, diplus)) and (adx > 25) and (close < EMA2) and na(firstsellbar)

buyexit1 := ta.crossover(diminus, diplus) and (adx > 30) and na(buyexitbar)
sellexit1 := ta.crossover(diplus, diminus) and (adx > 30) and na(sellexitbar)

if buycondition1
    if(na(firstbuybar))
        firstbuybar := bar_index
        buyexitbar := na
        firstsellbar := na
        strategy.entry("Buy", strategy.long)

if sellcondition1
    if(na(firstsellbar))
        firstsellbar := bar_index
        sellexitbar := na
        firstbuybar := na
        strategy.entry("Sell", strategy.short)

if buyexit1 and not na(firstbuybar)
    if(na(buyexitbar))
        buyexitbar := bar_index
        firstbuybar := na
        firstsellbar := na
        strategy.close("Buy")

if sellexit1 and not na(firstsellbar)
    if(na(sellexitbar))
        sellexitbar := bar_index
        firstsellbar := na
        firstbuybar := na
        strategy.close("Sell")

// Plot signals on chart
hl = input.bool(defval = true, title = "Signal Labels")

plotshape(hl and buycondition1 and bar_index == firstbuybar ? true : na, "Buy", style = shape.labelup, location = location.belowbar, color = color.green, text = "Buy", textcolor = color.white, size = size.tiny)
plotshape(hl and sellcondition1 and bar_index == firstsellbar ? true : na, "Sell", style = shape.labeldown, location = location.abovebar, color = color.red, text = "Sell", textcolor = color.white, size = size.tiny)

plotshape(hl and buyexit1 and bar_index == buyexitbar ? true : na, "Buy Exit", style = shape.labelup, location = location.belowbar, color = color.red, text = "Buy X", textcolor = color.white, size = size.tiny)
plotshape(hl and sellexit1 and bar_index == sellexitbar ? true : na, "Sell Exit", style = shape.labeldown, location = location.abovebar, color = color.red, text = "Sell X", textcolor = color.white, size = size.tiny)