MACD-Strategie zur dynamischen Trendbeurteilung basierend auf dem gleitenden Durchschnitt

1
Follow
1782
Followers
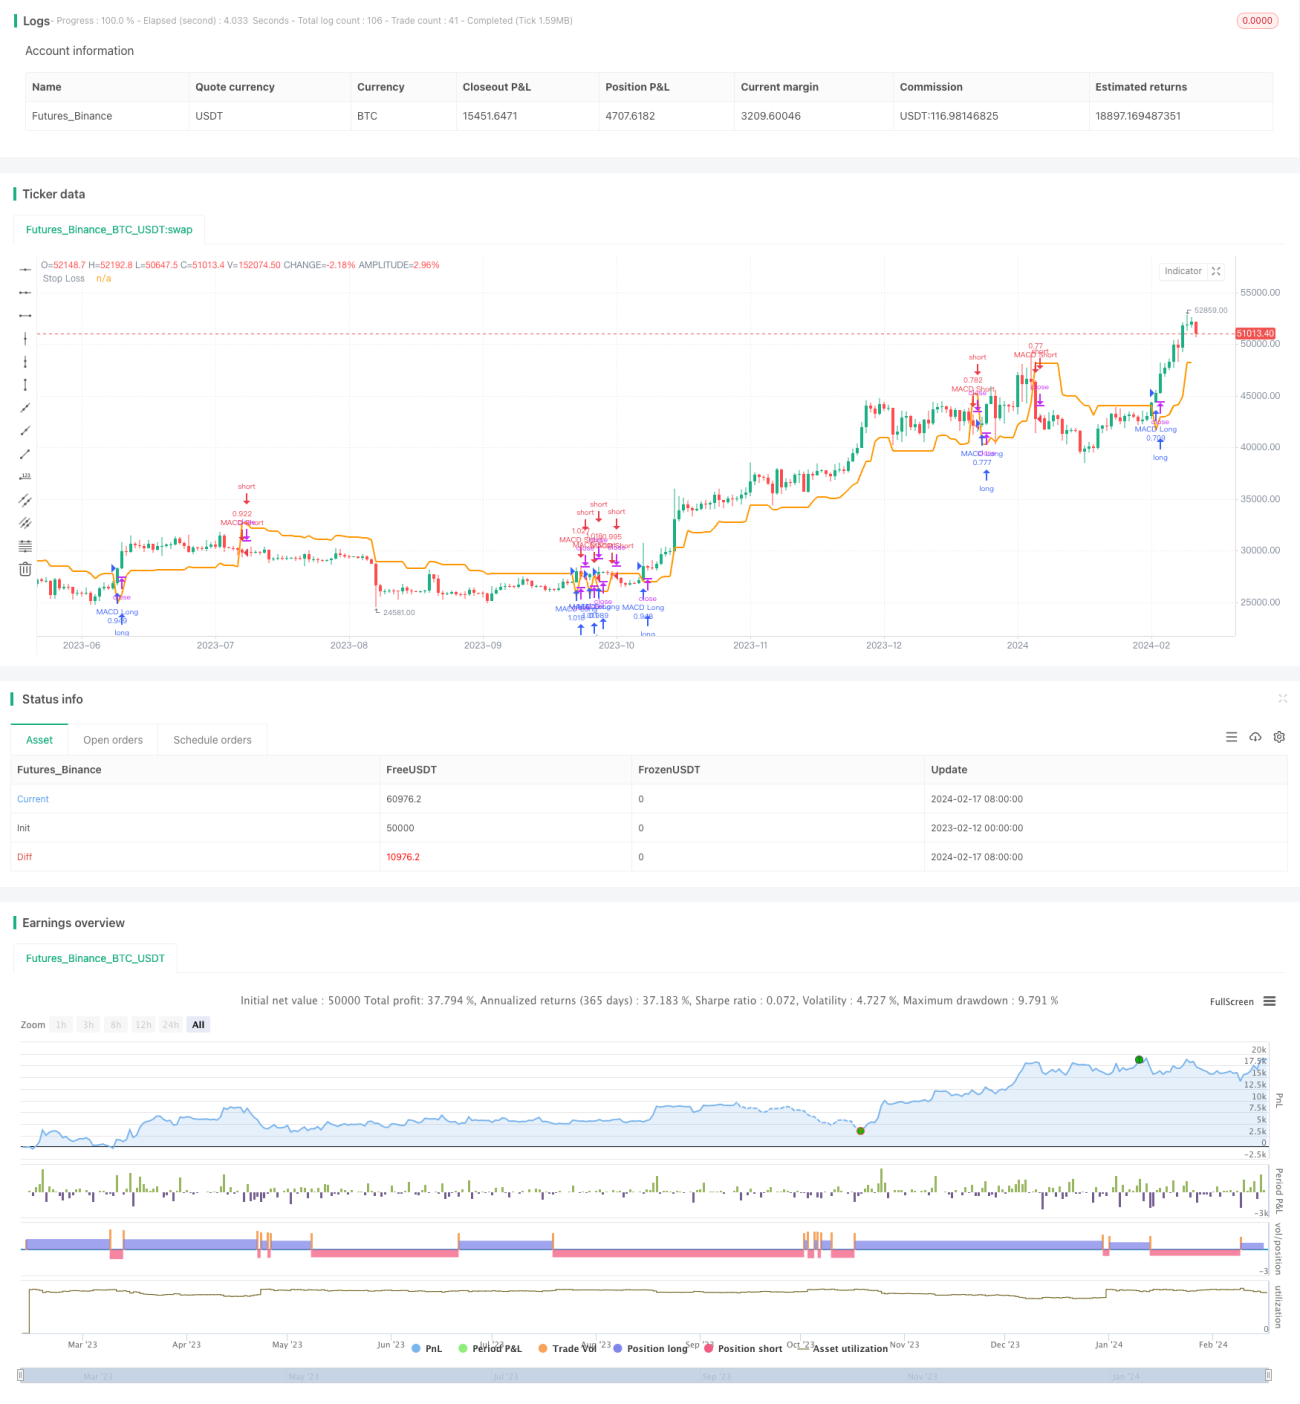
Überblick
Die Strategie basiert auf einer Kombination von MACD-Indikatoren mit einer durchschnittlichen Linie und ermöglicht die Beurteilung von dynamischen Trends über Zeiträume. Sie ist eine klassische Trendverfolgungsstrategie. Sie beurteilt die Richtung und Stärke des aktuellen Trends hauptsächlich anhand der Abweichung der MACD-Distributionslinie und der Beziehung zwischen ihrer Signallinie und der schnellen Durchschnittlinie.
Strategieprinzip
- Beurteilung der aktuellen Trendrichtung anhand der Differenz zwischen dem MACD-Indikator und seiner Signallinie
- Die MACD-Differenz wird als Multi-Signal und als Hintergrundsignal übertragen.
- Die Einführung von MACD-Differenz und MACD-Säulen zur Gleichgewichtung der Strategie-Signalverstärkung
- Hinzufügung eines Moduls für die Über-Zyklus-Beschlüsse, wobei die MACD-Anzeige für die höheren Zeitzyklen als Grundlage für die Signalfilterung und Positionsregelung verwendet wird
- Positionsdynamik, Positionsverringerung bei schwachen, Positionserhöhung bei starken Signalen
Analyse der Stärken
- Der MACD-Indikator selbst ist ein sehr effektiver Trendsensor.
- Kombination von MACD-Differenz und Doppel-Verifizierung der Säulenlinie zur Verbesserung der Signalgenauigkeit
- Überkreislauf-Urteil verbessert die Stabilität der Strategie und verhindert, dass sie durch Hochfrequenzsignale fehlgeleitet wird
- Die dynamische Positionsanpassung ermöglicht es der Strategie, die Chancen zu nutzen und die Überschüsse zu erhöhen.
Risikoanalyse und Lösungsansätze
- MACD-Signal verspätet sich und kann zu einer leichten Effektivität führen
- Lösung: Erhöhung der Abweichung zwischen schnellen und langsamen Mittellinien, um das Signal früher zu erfassen
- Überkreislaufsignale sind nicht unbedingt genau und können Strategien irreführen
- Lösung: Einführung eines dynamischen Anpassungsmechanismus für die Positionen, der die Hauptzyklusstrategie dominiert
- Mehrfaktorische Kombinationsstrategien könnten zu wenig Stabilität bewirken
- Die Lösung: Eine sorgfältige Anpassung der Strategieparameter, um die Gesamtheit zu gewährleisten
Optimierungsrichtung
- Testen der Wirkung verschiedener Kombinationen von Periodenparametern
- Testen Sie die Auswirkungen verschiedener über die Periode kombinierter Strategien auf die Wirksamkeit
- Anpassung von MACD-Parametern, wie z. B. schnelle und langsame Durchschnitts-Perioden, Signal-Perioden usw.
- Test der Wirkung verschiedener Positionsregulatoren
- Rückmeldung bei anderen Sorten
Zusammenfassen
Die MACD kombiniert die Vorteile klassischer Indikatorurteile mit den Vorteilen von mehreren Zeitrahmen. Durch die Optimierung von Parametern und Kombinationstests kann eine stabilere und ertragreichere Trendverfolgungsstrategie erstellt werden.
Source
Pine
Strategy parameters
Related strategies
Comment
All comments (0)
No data
- 1