DEMA Crossover Trendfolgestrategie
Überblick
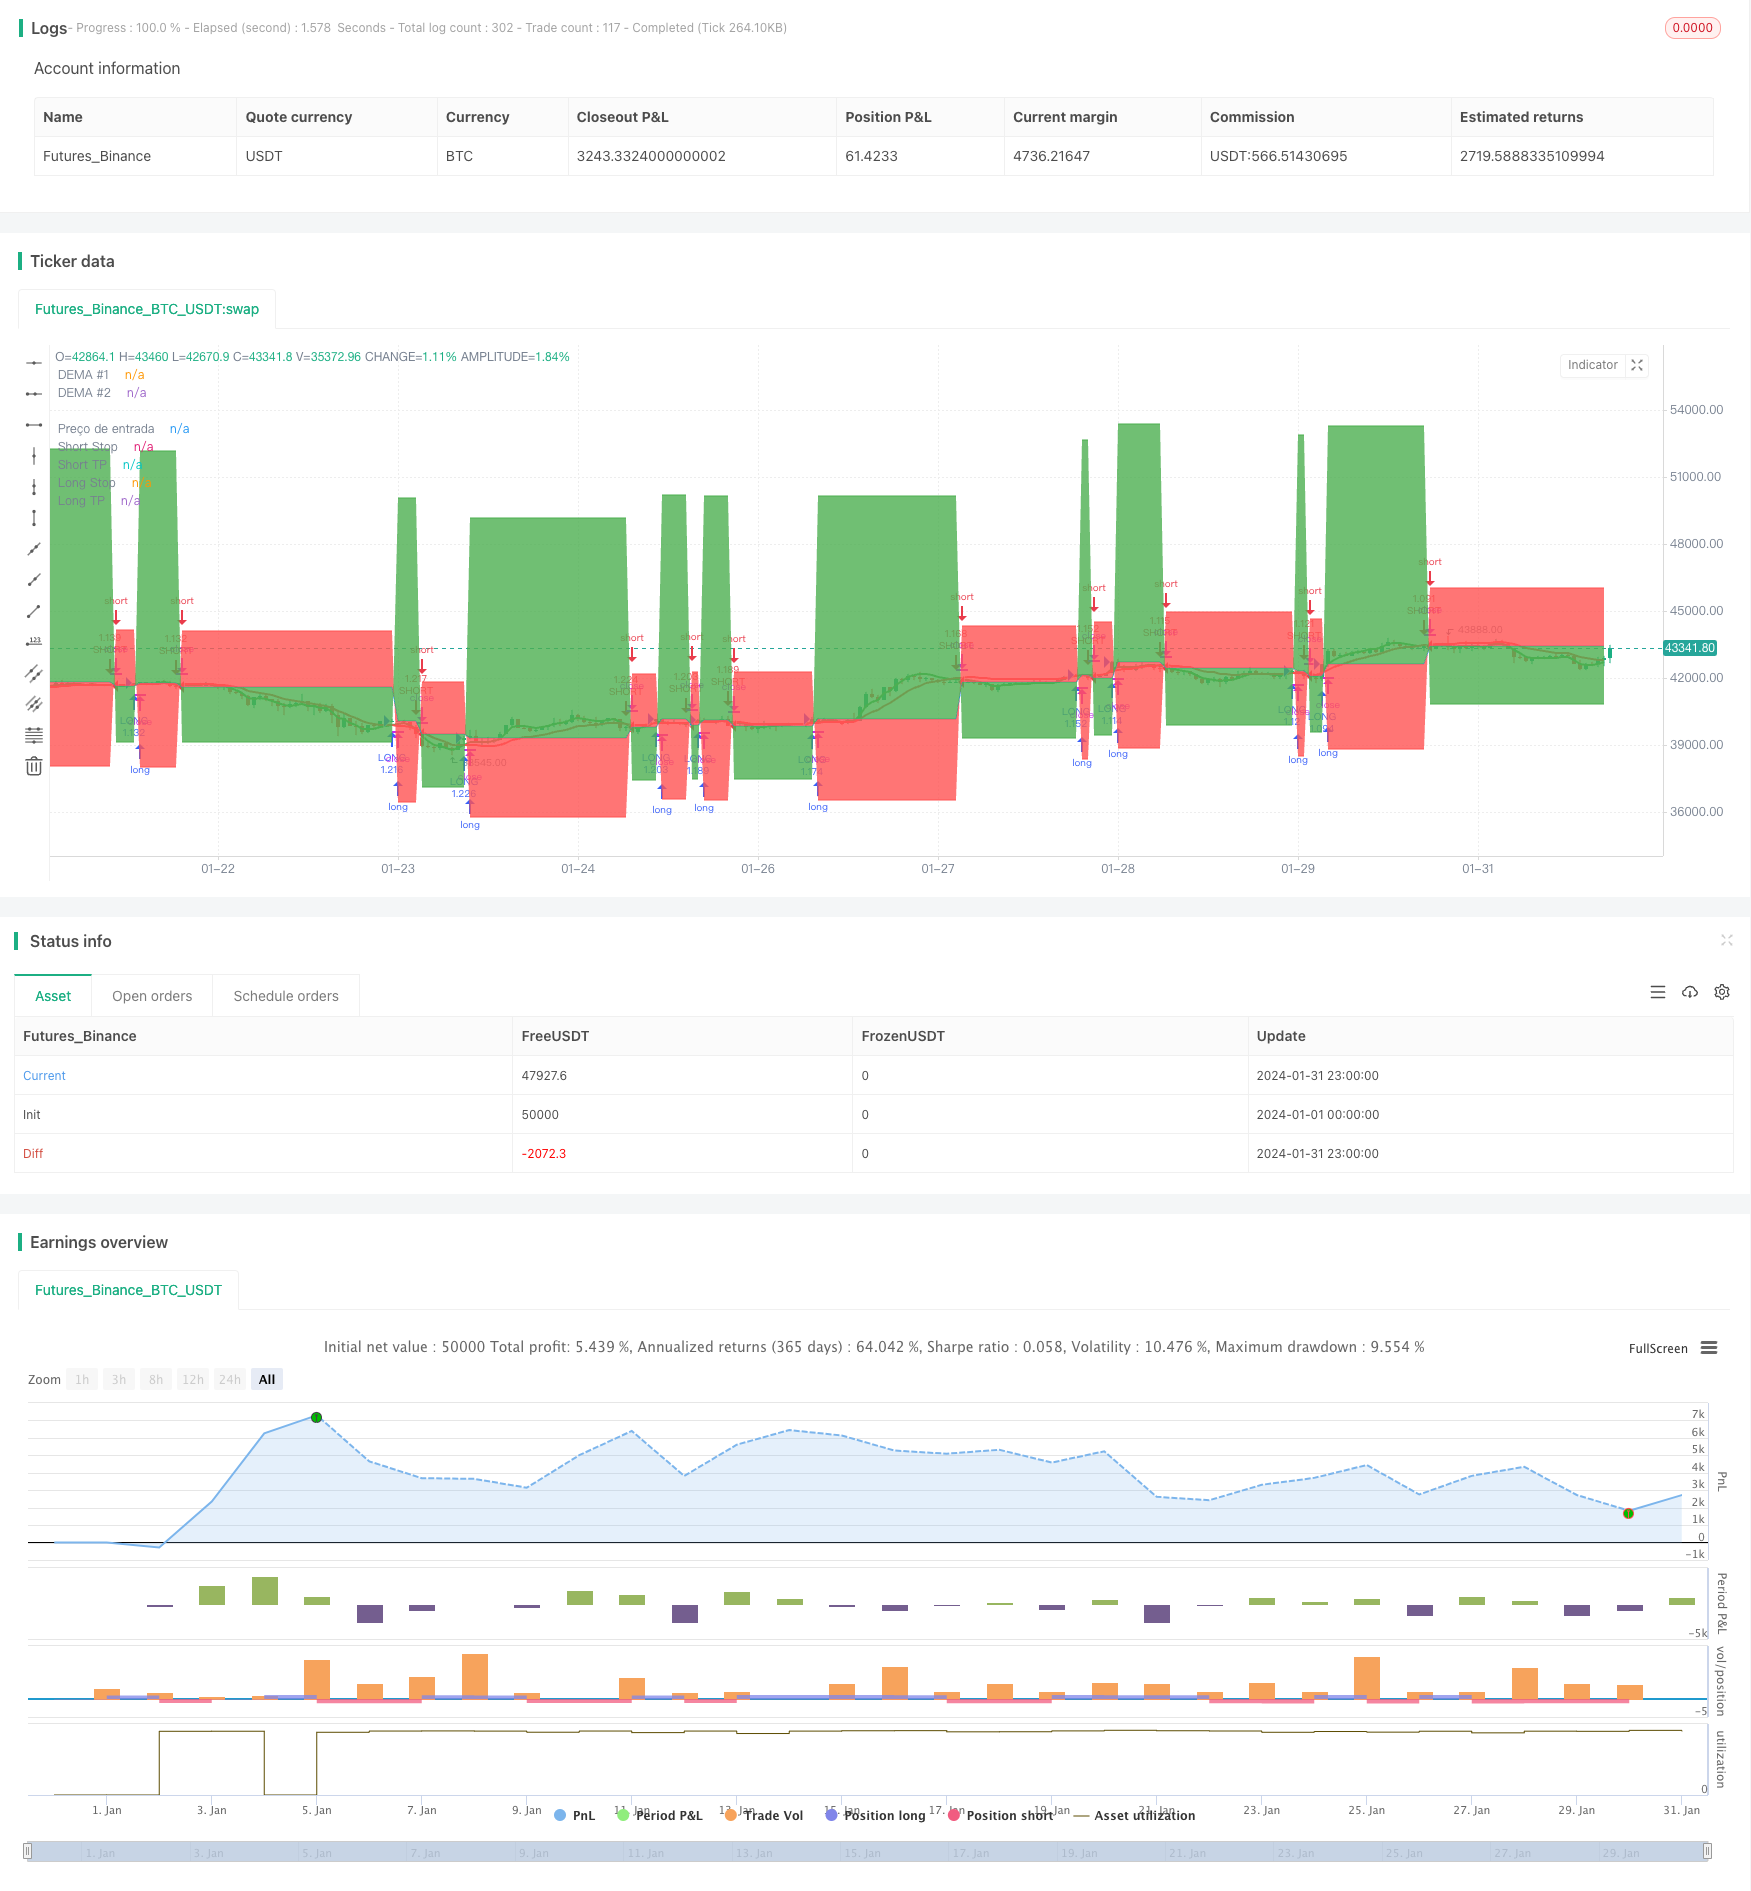
Die Strategie basiert auf der Überschneidung des DEMA als Handelssignal, verwendet eine Trendverfolgungsmethode und setzt automatisch Stopps und Stopps ein. Die Strategie hat den Vorteil, dass die Handelssignale klar sind und die Stop-Loss-Stopps flexibel eingestellt werden können, um das Risiko effektiv zu kontrollieren.
Strategieprinzip
Berechnen Sie die Schnell-DEMA (8.), die Langzeit-DEMA (24.) und die Hilfs-DEMA (konfigurierbar).
Wenn die schnelle Linie durch die langsame Linie ein Goldforksignal erzeugt, machen Sie mehr; wenn die schnelle Linie unterhalb der langsamen Linie ein Todesforksignal erzeugt, machen Sie leere.
Hinzugefügt wurde ein Filter für Handelssignale, der nur dann ein Signal erzeugt, wenn der Tageswert der Hilfslinie höher ist als der des Vortages, um falsche Durchbrüche zu vermeiden.
Die Stop-Line ist ein Trend-Tracking-Stopp-Mechanismus, der sich an die Preisentwicklung anpasst, um sicherzustellen, dass der Stop-Loss-Punkt einen Teil des Gewinns sperrt.
Die Einrichtung von Stop-Loss- und Stop-Stops mit festen Anteilen ermöglicht die Kontrolle des maximalen Verlustes und des maximalen Gewinns eines einzelnen Handels.
Strategische Vorteile
Die Handelssignale sind klar und es ist leicht zu bestimmen, wann man ein- und ausgeht.
Die doppelte DEMA-Algorithmus ist geschmeidiger, vermeidet Überoptimierung und ist zuverlässiger.
Hilfsleiterfilter erhöhen die Signalentscheidung und reduzieren die Falschsignale.
Die Verwendung von Trend-Tracking-Stopp-Losses ermöglicht es, einen Teil der Gewinne zu sperren und das Risiko effektiv zu kontrollieren.
Setzen Sie eine Stop-Loss-Schranke mit einem festen Prozentsatz, um den maximalen Verlust für einen einzelnen Handel zu kontrollieren und zu vermeiden, dass die Risiken überschritten werden.
Strategisches Risiko
In einem turbulenten Umfeld kann es zu häufigen Transaktionen kommen, die leicht zu einer Erhöhung der Posure führen, was zu strategischen Verlusten führt.
Die Fixed Stop-Ratio ist zu hoch und kann bei außergewöhnlichen Umständen zu einem hohen Stop-Loss führen.
DEMA-Kreuzsignale sind nachlässig und erhöhen das Verlustrisiko, wenn man in schnellen Zeiten in der Nähe von Markthochpunkten kauft.
Bei der Bereitstellung von Festplatten beeinflussen die Gleitpunktkosten die Profitabilität und müssen die Stop-Loss-Parameter angepasst werden.
Strategieoptimierung
Die DEMA-Parameter können an die Marktlage angepasst werden, um die optimale Balance zu finden.
In der Realität sollten die Gleitpunktkosten berücksichtigt werden, um den festen Stop-Loss-Bereich angemessen zu erweitern.
Es können weitere Hilfsindikatoren wie MACD hinzugefügt werden, um die Signalwirkung zu verbessern.
Es ist möglich, den Stop-Loss-Schritt zu verfolgen und die Stop-Loss-Logik zu optimieren.
Zusammenfassen
Die Strategie nutzt die Trendentscheidung von DEMA in Kombination mit dem Trendverfolgungsmechanismus, um das Risiko zu kontrollieren. Sie ist typisch für die Handelsstrategie von Determine Trend Direction. Insgesamt ist die Strategie mit klaren Signalen und vernünftigen Stop-Loss-Sets eine leicht zu handhabende, risikobeherrschende Handelsstrategie.
/*backtest
start: 2024-01-01 00:00:00
end: 2024-01-31 23:59:59
period: 1h
basePeriod: 15m
exchanges: [{"eid":"Futures_Binance","currency":"BTC_USDT"}]
*/

// This source code is subject to the terms of the Mozilla Public License 2.0 at https://mozilla.org/MPL/2.0/
// © zeguela
//@version=4
strategy(title="ZEGUELA DEMABOT", commission_value=0.063, commission_type=strategy.commission.percent, initial_capital=100, default_qty_value=90, default_qty_type=strategy.percent_of_equity, overlay=true, process_orders_on_close=true)

// Step 1. Script settings

// Input options
srcData = input(title="Source Data", type=input.source, defval=close)

// Length settings
len1 = input(title="Length DEMA #1", type=input.integer, defval=8, minval=1)
len2 = input(title="Length DEMA #2", type=input.integer, defval=24, minval=0)
len3 = input(title="Length DEMA #3", type=input.integer, defval=0, minval=0)

// Step 2. Calculate indicator values
// Function that calculates the DEMA
DEMA(series, length) =>
    if (length > 0)
        emaValue = ema(series, length)
        2 * emaValue - ema(emaValue, length)
    else
        na

// Calculate the DEMA values
demaVal1 = DEMA(srcData, len1)
demaVal2 = DEMA(srcData, len2)
demaVal3 = DEMA(srcData, len3)

// Step 3. Determine indicator signals
// See if there's a DEMA crossover
demaCrossover = if (len2 > 0) and (len3 > 0)
    crossover(demaVal1, demaVal2) and (demaVal3 > demaVal3[1])
else
    if (len2 > 0) and (len3 == 0)
        crossover(demaVal1, demaVal2)
    else
        if (len3 > 0) and (len2 == 0)
            crossover(demaVal1, demaVal3)
        else
            crossover(close, demaVal1)

// Check if there's a DEMA crossunder
demaCrossunder = if (len2 > 0) and (len3 > 0)
    crossunder(demaVal1, demaVal2) and (demaVal3 < demaVal3[1])
else
    if (len2 > 0) and (len3 == 0)
        crossunder(demaVal1, demaVal2)
    else
        if (len3 > 0) and (len2 == 0)
            crossunder(demaVal1, demaVal3)
        else
            crossunder(close, demaVal1)

// Step 4. Output indicator data
// Plot DEMAs on the chart
plot(series=demaVal1, color=color.green, linewidth=2, title="DEMA #1")
plot(series=demaVal2, color=color.red, linewidth=2, title="DEMA #2")
plot(series=demaVal3, color=color.fuchsia, linewidth=2, title="DEMA #3")

//TRAILING STOP CODE
a = input(title="Usar Trailing Stop?", type=input.bool, defval=false)

stopPerlong = input(9.0, title='Stop Loss Long %', type=input.float, group="Stop Loss & Take Profit Settings") / 100
stopPershort = input(6.0, title='Stop Loss Short %', type=input.float, group="Stop Loss & Take Profit Settings") / 100
take1Perlong = input(25.0, title='Take Profit Long % 1', type=input.float, group="Stop Loss & Take Profit Settings") / 100
take1Pershort = input(6.0, title='Take Profit Short % 1', type=input.float, group="Stop Loss & Take Profit Settings") / 100

// Determine stop loss price
longStopPrice  = strategy.position_avg_price * (1 - stopPerlong)
shortStopPrice = strategy.position_avg_price * (1 + stopPershort)
longTake1Price = strategy.position_avg_price * (1 + take1Perlong)
shortTake1Price = strategy.position_avg_price * (1 - take1Pershort)

// Determine trail stop loss prices

longStopPriceTrail = 0.0

longStopPriceTrail := if (strategy.position_size > 0)
    stopValue = close * (1 - stopPerlong)
    max(stopValue, longStopPriceTrail[1])
else
    0

// Determine trailing short price
shortStopPriceTrail = 0.0

shortStopPriceTrail := if (strategy.position_size < 0)
    stopValue = close * (1 + stopPershort)
    min(stopValue, shortStopPriceTrail[1])
else
    999999

//calcular qual stop usar
longStop = a ? longStopPriceTrail : longStopPrice
shortStop = a ? shortStopPriceTrail : shortStopPrice


//calcula o valor do stop e TP pra lançar no alerta
longStopEntrada = close  * (1 - stopPerlong)
shortStopEntrada = close  * (1 + stopPershort)
longTPEntrada = close * (1 + take1Perlong)
shortTPEntrada = close * (1 - take1Pershort)

//armazena o preço de entrada e valor do SL e TP

price_entryL = 0.0
price_entryL := na(price_entryL) ? na : price_entryL[1]
price_entryS = 0.0
price_entryS := na(price_entryS) ? na : price_entryS[1]
stopL = 0.0
stopL := na(stopL) ? na : stopL[1]
stopS = 0.0
stopS := na(stopS) ? na : stopS[1]
takeL = 0.0
takeL := na(takeL) ? na : takeL[1]
takeS = 0.0
takeS := na(takeS) ? na : takeS[1]

if (demaCrossover)
    price_entryL := close
    stopL := close  * (1 - stopPerlong)
    takeL := close * (1 + take1Perlong)

if (demaCrossunder)
    price_entryS := close
    stopS := close  * (1 + stopPershort)
    takeS := close * (1 - take1Pershort)

resultadoL = ((close - price_entryL)/price_entryL) * 100
resultadoLexit = "(SL = 1% e TP = 0,5%)"
resultadoS = ((price_entryS - close)/price_entryS) * 100
resultadoSexit = "(SL = 1% e TP = 0,5)%"
// Make input options that configure backtest date range
_startDate = input(title="Start Date", type=input.integer,
     defval=1, minval=1, maxval=31, group="BackTest Period")
_startMonth = input(title="Start Month", type=input.integer,
     defval=1, minval=1, maxval=12, group="BackTest Period")
_startYear = input(title="Start Year", type=input.integer,
     defval=2018, minval=1800, maxval=2100, group="BackTest Period")

_endDate = input(title="End Date", type=input.integer,
     defval=31, minval=1, maxval=31, group="BackTest Period")
_endMonth = input(title="End Month", type=input.integer,
     defval=12, minval=1, maxval=12, group="BackTest Period")
_endYear = input(title="End Year", type=input.integer,
     defval=2031, minval=1800, maxval=2100, group="BackTest Period")

// Look if the close time of the current bar
// falls inside the date range
_inDateRange = (time >= timestamp(syminfo.timezone, _startYear,
         _startMonth, _startDate, 0, 0)) and
     (time < timestamp(syminfo.timezone, _endYear, _endMonth, _endDate, 0, 0))

//Alert configuration

_alertMessageOpenLong="OpenLong"
_alertMessageCloseLong="CloseLong"
_alertmessageExitLong="ExitLong - TP/SL"

_alertMessageOpenShort="OpenShort"
_alertMessageCloseShort="CloseShort"
_alertMessageExitShort="ExitShort - TP/SL"

if (_inDateRange)
    //ENTER SOME SETUP TRADES FOR TSL EXAMPLE
    if (demaCrossover)
        strategy.entry("LONG", strategy.long, comment = _alertMessageOpenLong)
    if (demaCrossunder)
        strategy.entry("SHORT", strategy.short, comment = _alertMessageOpenShort)
    //EXIT TRADE @ TSL
    if strategy.position_size > 0
        strategy.exit("TP/SL", "LONG", stop=longStop, limit=longTake1Price, comment=_alertmessageExitLong, alert_message=_alertmessageExitLong)
    if strategy.position_size < 0
        strategy.exit("TP/SL", "SHORT", stop=shortStop, limit=shortTake1Price, comment =_alertMessageExitShort, alert_message=_alertMessageExitShort)


//Look & Feel - Plot stop loss and take profit areas
p1=plot(strategy.position_avg_price, color=color.blue, style=plot.style_linebr, linewidth=1, title="Preço de entrada")
p2=plot(series=strategy.position_size > 0 ? longStop : na, color=color.red, style=plot.style_linebr, linewidth=1, title="Long Stop")
p3=plot(series=strategy.position_size > 0 ? longTake1Price : na, color=color.green, style=plot.style_linebr, linewidth=1, title="Long TP")
p4=plot(series=strategy.position_size < 0 ? shortStop : na, color=color.red, style=plot.style_linebr, linewidth=1, title="Short Stop")
p5=plot(series=strategy.position_size < 0 ? shortTake1Price : na, color=color.green, style=plot.style_linebr, linewidth=1, title="Short TP")
fill(p1, p2, color=color.red)
fill(p1, p3, color=color.green)
fill(p1, p4, color=color.red)
fill(p1, p5, color=color.green)

// Insert label with value
stopLossOnLong = "Stop Loss = " + tostring(longStop)
stopLossOnShort = "Stop Loss = " + tostring(shortStop)
takeprofitOnLong = "Take Profit = " + tostring(longTake1Price)
takeprofitOnShort = "Take Profit = " + tostring(shortTake1Price)
precoentrada = "Entrada = " + tostring(strategy.position_avg_price)

var label FinalLabelpriceL = na
var label FinalLabelpriceS = na
var label slFinalLabelL = na
var label slFinalLabelS = na
var label slFinalLabelTPL = na
var label slFinalLabelTPS = na


//Draw entry and stop loss lines and labels

if strategy.position_size > 0

    //write the price above the end of the stoploss line
    slFinalLabelL := label.new(bar_index, longStop, stopLossOnLong, style=label.style_none, size=size.normal, textcolor=color.red)
    slFinalLabelTPL := label.new(bar_index, longTake1Price, takeprofitOnLong, style=label.style_none, size=size.normal, textcolor=color.green)
    FinalLabelpriceL := label.new(bar_index, strategy.position_avg_price, precoentrada, style=label.style_none, size=size.normal, textcolor=color.blue)

    // Delete previous label when there is a consecutive new high, as there's no line plot in that case.
    if strategy.position_size > 0[1]
        label.delete(slFinalLabelL[1])
        label.delete(slFinalLabelTPL[1])
        label.delete(FinalLabelpriceL[1])

if strategy.position_size < 0

    //write the price above the end of the stoploss line
    slFinalLabelS := label.new(bar_index, shortStop, stopLossOnShort, style=label.style_none, size=size.normal, textcolor=color.red)
    slFinalLabelTPS := label.new(bar_index, shortTake1Price, takeprofitOnShort, style=label.style_none, size=size.normal, textcolor=color.green)
    FinalLabelpriceS := label.new(bar_index, strategy.position_avg_price, precoentrada, style=label.style_none, size=size.normal, textcolor=color.blue)

    // Delete previous label when there is a consecutive new high, as there's no line plot in that case.
    if strategy.position_size < 0[1]
        label.delete(slFinalLabelS[1])
        label.delete(slFinalLabelTPS[1])
        label.delete(FinalLabelpriceS[1])


// Exit open market position when date range ends
if (not _inDateRange)
    strategy.close_all()