Flaggenausbruchsstrategie
Überblick
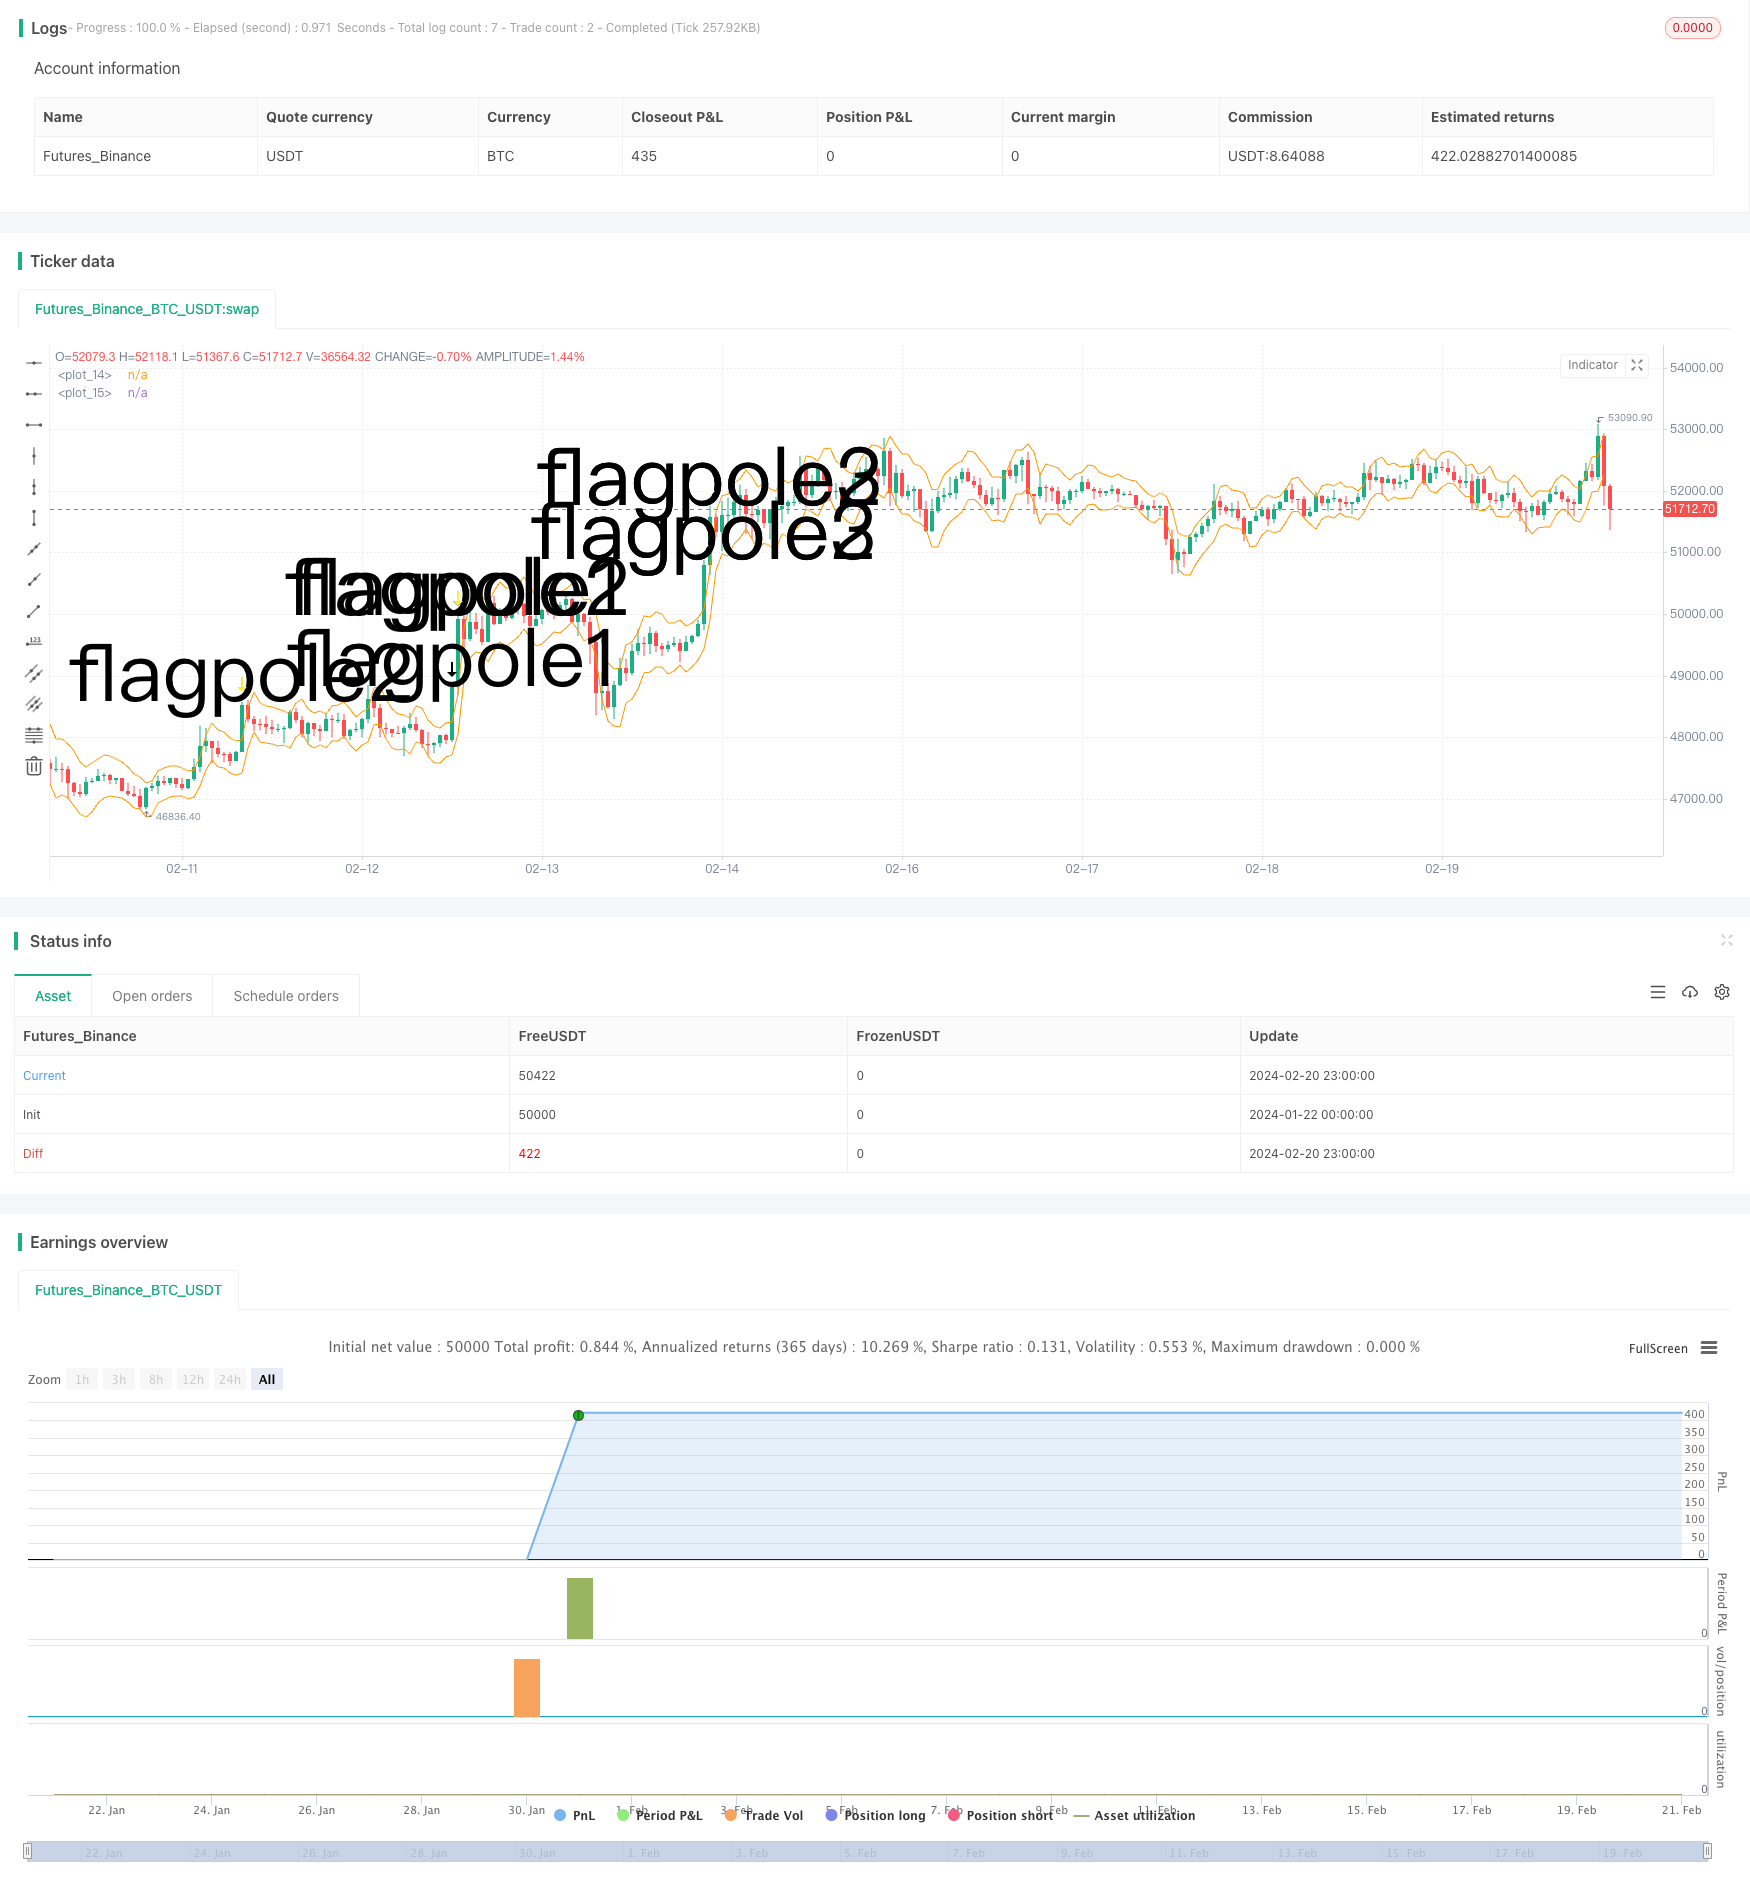
Eine Flaggen-Breakout-Strategie ist eine technische Analyse-Strategie, die den Beginn eines Trends erfasst, indem sie Flaggen-Grafiken erkennt und an den Breakout-Punkten einsteigt. Die Strategie verwendet die mittlere reelle Bandbreite (ATR) als Hilfsberechtigung, um die Flaggen-Bereichsberechtigung nach dem eindeutigen Flagg zu beurteilen, um so Einstiegsmöglichkeiten auszuwählen.
Strategieprinzip
Die Strategie besteht aus folgenden Schritten:
- Es ist notwendig, die hohe Preisinnovation und den Durchbruch des ATR-Kanals zu erreichen.
- Bestimmung der Fahnenstangenhöhe: Messen Sie die Entfernung zwischen der Spitze der Fahnenstange und dem vorherigen SMA.
- Festlegung des Flaggbereichs: Der Tiefpunkt der Flagge ist 33% der Fahnenmasthöhe, als der kleinste Bereich der Flagge.
- Feststellung der Flaggenart: Beurteilen Sie, ob die ersten drei K-Linien alle im Bereich der Flagge liegen.
- Eintritt: Bei einem Flaggenzeichen mehr.
- Ausgang: Festhalte von 6 K-Linien nach der Liquidation.
Bei der Beurteilung von Flaggen und Flaggen verwendet die Strategie geschickt die ATR-Anzeige, um deutliche Durchbrüche zu ermitteln, und die Flaggenhöhe ist streng auf 33% der Flaggenhöhe begrenzt, um zu viele Falschsignale zu vermeiden. Darüber hinaus ist die Beurteilung, dass 3 aufeinanderfolgende K-Linien eine Flagge bilden, sehr zuverlässig.
Analyse der Stärken
Diese Strategie hat folgende Vorteile:
- Die Flaggenstrukturen sind die klassischsten Methoden der technischen Analyse, mit einer hohen Erfolgsrate.
- Die ATR-Anzeige und die strenge Reichweitenbeschränkung verhindern eine große Anzahl von Falschsignalen und verbessern die Eingangsgenauigkeit.
- Die Festlegung von 6 K-Linien kann einen Teil der Gewinne sichern und das Risiko einer Trendwende vermeiden.
- Die Regeln der Strategie sind klar, einfach umzusetzen, leicht zu erlernen und zu befolgen.
- Sie können in verschiedenen Situationen nach Möglichkeiten suchen und sind flexibler.
Risikoanalyse
Die wichtigsten Risiken dieser Strategie sind:
- Es gibt auch Fälle, in denen Flag-Typen die Trends nicht vollständig beurteilen können und scheitern.
- Die 6 K-Linien sind zu willkürlich und könnten zu früh aussteigen.
- Wenn die Situation zu dramatisch wird, kann es zu False Flags kommen.
- Ein einzelner Verlust kann nicht wirksam kontrolliert werden.
Um diese Risiken abzudecken, können wir eine Stop-Loss-Strategie einrichten oder den Ausstieg optimieren, um rechtzeitig zu profitieren, wenn der Gewinn einen bestimmten Prozentsatz erreicht. Darüber hinaus können wir auch in Kombination mit anderen Indikatoren filtern, um falsche Signale zu vermeiden, wenn der Markt zu schwankend ist.
Optimierungsrichtung
Die Strategie kann in folgenden Richtungen optimiert werden:
- Vermeiden Sie falsche Signale bei Erschütterungen durch die Kombination von MACD und KD.
- Das ATR-Multiplikator, die Laufzeit usw. werden nach Marktkategorien parametriert, um die Strategie anpassungsfähiger zu machen.
- Setzen Sie einen beweglichen Stop-Loss oder erwägen Sie einen Gewinnrückzug im Vergleich zu einem dynamischen Start.
- Versuchen Sie, mit Hilfe von maschinellen Lernmethoden die Flaggenhöhe zu bestimmen, um genauere Merkmale zu finden.
- Beurteilung der tatsächlichen Gewinn- und Verlustquote und dynamische Anpassung der Positionsgröße.
Zusammenfassen
Insgesamt betrachtet, ist die Flagship-Breakthrough-Strategie, die die Tendenz zur Nutzung von Technologiemodellen ausnutzt, eine eher klassische Methode, die in der Eintrittsregel-Design wirklich streng ist und eine große Anzahl von Falschsignalen filtern kann. Es gibt jedoch noch Optimierungsmöglichkeiten für die Risikokontrolle und den Ausstiegsmechanismus, die wir aus einer Gesamtperspektive betrachten können, damit die Strategie in verschiedenen Märkten stabil funktioniert.
/*backtest
start: 2024-01-22 00:00:00
end: 2024-02-21 00:00:00
period: 1h
basePeriod: 15m
exchanges: [{"eid":"Futures_Binance","currency":"BTC_USDT"}]
*/

// © smith26
//This strategy enters on a bull flag and closes position 6 bars later.  Average true range is used instead of a moving average.
//The reason for ATR instead of MA is because with volatile securities, the flagpole must stand up a noticable "distance" above the trading range---which you can't determine with a MA alone.
//This is broken up into multiple parts: Defining a flagpole, defining the pole height, and defining the flag, which will be constrained to the top third (33%) of the pole height to be considered a flag.
//@version=4
strategy("Bull Flag v1.00", overlay=true)

ATR = atr(10) //Average True Range over last 10 bars.

upperATR = ohlc4[1] + ATR[1]  //Open + High + Low + Close divided by 4, + prior ATR.  Just used here for visually plotting the ATR upper channel.
lowerATR = ohlc4[1] - ATR[1] //Open + High + Low + Close divided by 4, - prior ATR.  Just used here for visually plotting the ATR lower channel.

//uncomment these two lines to see ATR channels
plot(upperATR, color=color.orange)
plot (lowerATR, color=color.orange)

//Current close higher than previous close, and current close minus current open is greater than 3 times the previous ATR.  "3x ATR" is chosen because any less was not a noticeable distance above the trading range.
flagpole1 = close>close[1] and (close-open) > (ATR[1] * 3)
plotshape(flagpole1, text="flagpole1", style=shape.arrowdown, size=size.huge) //Plots an arrow for flagpole1 for QA testing

//Two consecutive close higer than their previous close, and current close minus PREVIOUS open is greater than 3 times the previous ATR.
flagpole2 = close>close[1] and close[1]>close[2] and (close-open[1]) > (ATR[1] * 3)
plotshape(flagpole2, text="flagpole2", style=shape.arrowdown, size=size.huge, color=color.yellow) //Plots an arrow for flagpole2 for QA testing

//Three consecutive close higer than their previous close, and current close minus open from 2 bars ago is greater than 3 times the previous ATR.
flagpole3 = close>close[1] and close[1]>close[2] and close[2]>close[3] and (close-open[2]) > (ATR[1] * 3)
plotshape(flagpole3, text="flagpole3", style=shape.arrowdown, size=size.huge, color=color.white) //Plots an arrow for flagpole3 for QA testing

//A flagpole can be any of the three definitions of flagpole.
flagpole = flagpole1 or flagpole2 or flagpole3

//This will return the number of bars since "flagpole" was true.  Not being used, but could be useful.
//since_flagpole = barssince(flagpole)

after_pole_1 = flagpole[1] //This marks the bar directly after a flagpole.
//plotshape(after_pole_1, text="after_pole_1", style=shape.cross, size=size.large, color=color.white) //Plots a cross for after_pole_1 for QA testing
after_pole_2 = flagpole[2] //This marks the bar two bars after a flagpole.
after_pole_3 = flagpole[3] //This marks the bar three bars after a flagpole.

//This returns the price at the "top" of the flagpole (using close price) at the most recent occurence, 0.
pole_top = valuewhen(flagpole, close, 0)
//plot(pole_top, trackprice=true)  //plots a horizontal line at the most recent pole_top

//Measures the distance between last pole top and the previous SMA.
pole_height = pole_top - sma(close, 10)[1]
//plot(pole_height)

//This marks 33% below the pole_top, which will be the lowest point a flag can be.
flag_bottom = pole_top - (.33 * pole_height)
//plot(flag_bottom)

//The first, second, and third bars after the pole are considered part of a flag when open and close are between the pole_top and flag_bottom
flag1 = after_pole_1 and (open >= flag_bottom) and (open <= pole_top) and (close >= flag_bottom) and (close <= pole_top)
//plotshape(flag1, text="flag1", style=shape.flag, size=size.large, color=color.teal)
flag2 = after_pole_2 and (open >= flag_bottom) and (open <= pole_top) and (close >= flag_bottom) and (close <= pole_top)
//plotshape(flag2, text="flag2", style=shape.flag, size=size.large, color=color.teal)
flag3 = after_pole_3 and (open >= flag_bottom) and (open <= pole_top) and (close >= flag_bottom) and (close <= pole_top)
//plotshape(flag3, text="flag3", style=shape.flag, size=size.large, color=color.teal)

//When all three bars after a flagpole are a flag, the criteria are met and we have a "bull_flag"
//Specifically, when current bar is flag3, previous bar is flag2, and 2 bars ago is flag1, we have a bull_flag.
bull_flag = flag3 and flag2[1] and flag1[2]
plotshape(bull_flag, text="bull_flag", style=shape.flag, size=size.large, color=color.white) //Plots a flag for bull_flag for QA testing


if (bull_flag)
    strategy.entry("Long", strategy.long)

if barssince(bull_flag) == 6 //close 6 bars after entry.
    strategy.close("Long")