Historische Trendmutationsstrategie
Überblick
Die historische Trend-Trick-Strategie nutzt die Flow-Indikatoren, um Trendwendepunkte zu identifizieren und in Kombination mit den Index-Moving Averages Handelssignale zu erzeugen, um die Favor-Strategie zu erfassen. Die Strategie kombiniert geschickt die Vorteile der Verwendung von Flow-Indikatoren und Moving Averages, um die Marktentwicklung effektiv zu beurteilen und Handelsleitlinien bereitzustellen.
Ursprüngliche Analyse
Flussindikatoren- Beurteilen Sie die Richtung und Stärke eines Trends, indem Sie die positive und negative Bewegung des Preises analysieren. Die wichtigsten Parameter sind die Dauer der Periode, die Multiplikation und die Abnahme.
Indikatorische Moving Averages- Indikatoren für die Schließung der Preise zu glätten, um eine reibungslosere Trendentscheidung. Die längere Periode der Moving Averages, die Trendentscheidung ist stabiler.
Die Strategie verwendet einen Flow-Index, um die Haupttrendrichtung des Marktes zu bestimmen. Sie erzeugt ein Handelssignal, wenn die Leinwand die Schwelle überschreitet. Sie wird in Verbindung mit dem Moving Average gefiltert, um falsche Signale zu vermeiden. Insbesondere erzeugt sie ein Kaufsignal, wenn der Flow-Index die Schwelle überschreitet und der Preis höher als der Moving Average ist.
Analyse der Stärken
- Die Rückwärtserkennung von Flowmetern ermöglicht die rechtzeitige Erfassung potenzieller Trendwendechancen.
- Signalfilterung in Kombination mit einem Moving Average, um Fehltrading bei Erschütterungen zu vermeiden
- Optimierung der Strategie durch Parameter und Anpassung der Strategieempfindlichkeit für verschiedene Marktumgebungen
- Intuitive Benutzeroberfläche und klare Handelssignale für den Betrieb in der virtuellen Welt
Risikoanalyse
- Systemrisiken, bei denen ein Unvorhergesehenes zu einem Ausfall der Indikatoren führen kann
- In den letzten Jahren hat sich die Zahl der Fehlsignale erhöht.
- Die falsche Einstellung der Parameter kann zu radikal oder konservativ sein.
- Die Einzelschäden müssen mit geeigneter Stop-Loss-Kontrolle kombiniert werden.
Das Risiko kann durch die Einrichtung zusätzlicher Filter, die Kombination von mehreren Indikatoren, die Optimierung der Parameter-Einstellungen und die Einrichtung eines angemessenen Stop-Losses beantwortet werden.
Optimierungsrichtung
- Versuche verschiedene Arten von Moving Averages, um die beste Kombination zu finden
- Anpassung der Parameter für den Flow-Index und den Moving-Average zur optimalen Rendite
- Überprüfung der Strategie-Stabilität über mehrere Zeiträume
- Hinzufügen von Filtersignalen für Kennzahlen wie Brinband
- Parameter für bestimmte Sorten
Zusammenfassen
Die historische Trendwechselstrategie ist insgesamt relativ robust und hat eine gewisse Filterfähigkeit, während sie potenzielle Trendwechsel erfasst. Mit Hilfe von Parameteroptimierung und Risikomanagement kann die Strategie eine ausgezeichnete Rendite erzielen. Es wird empfohlen, dass Händler eine umfassende Überprüfung im Rahmen von realen Positionen nachvollziehen und versuchen, auf der Grundlage der Strategie innovative Erweiterungen vorzunehmen.
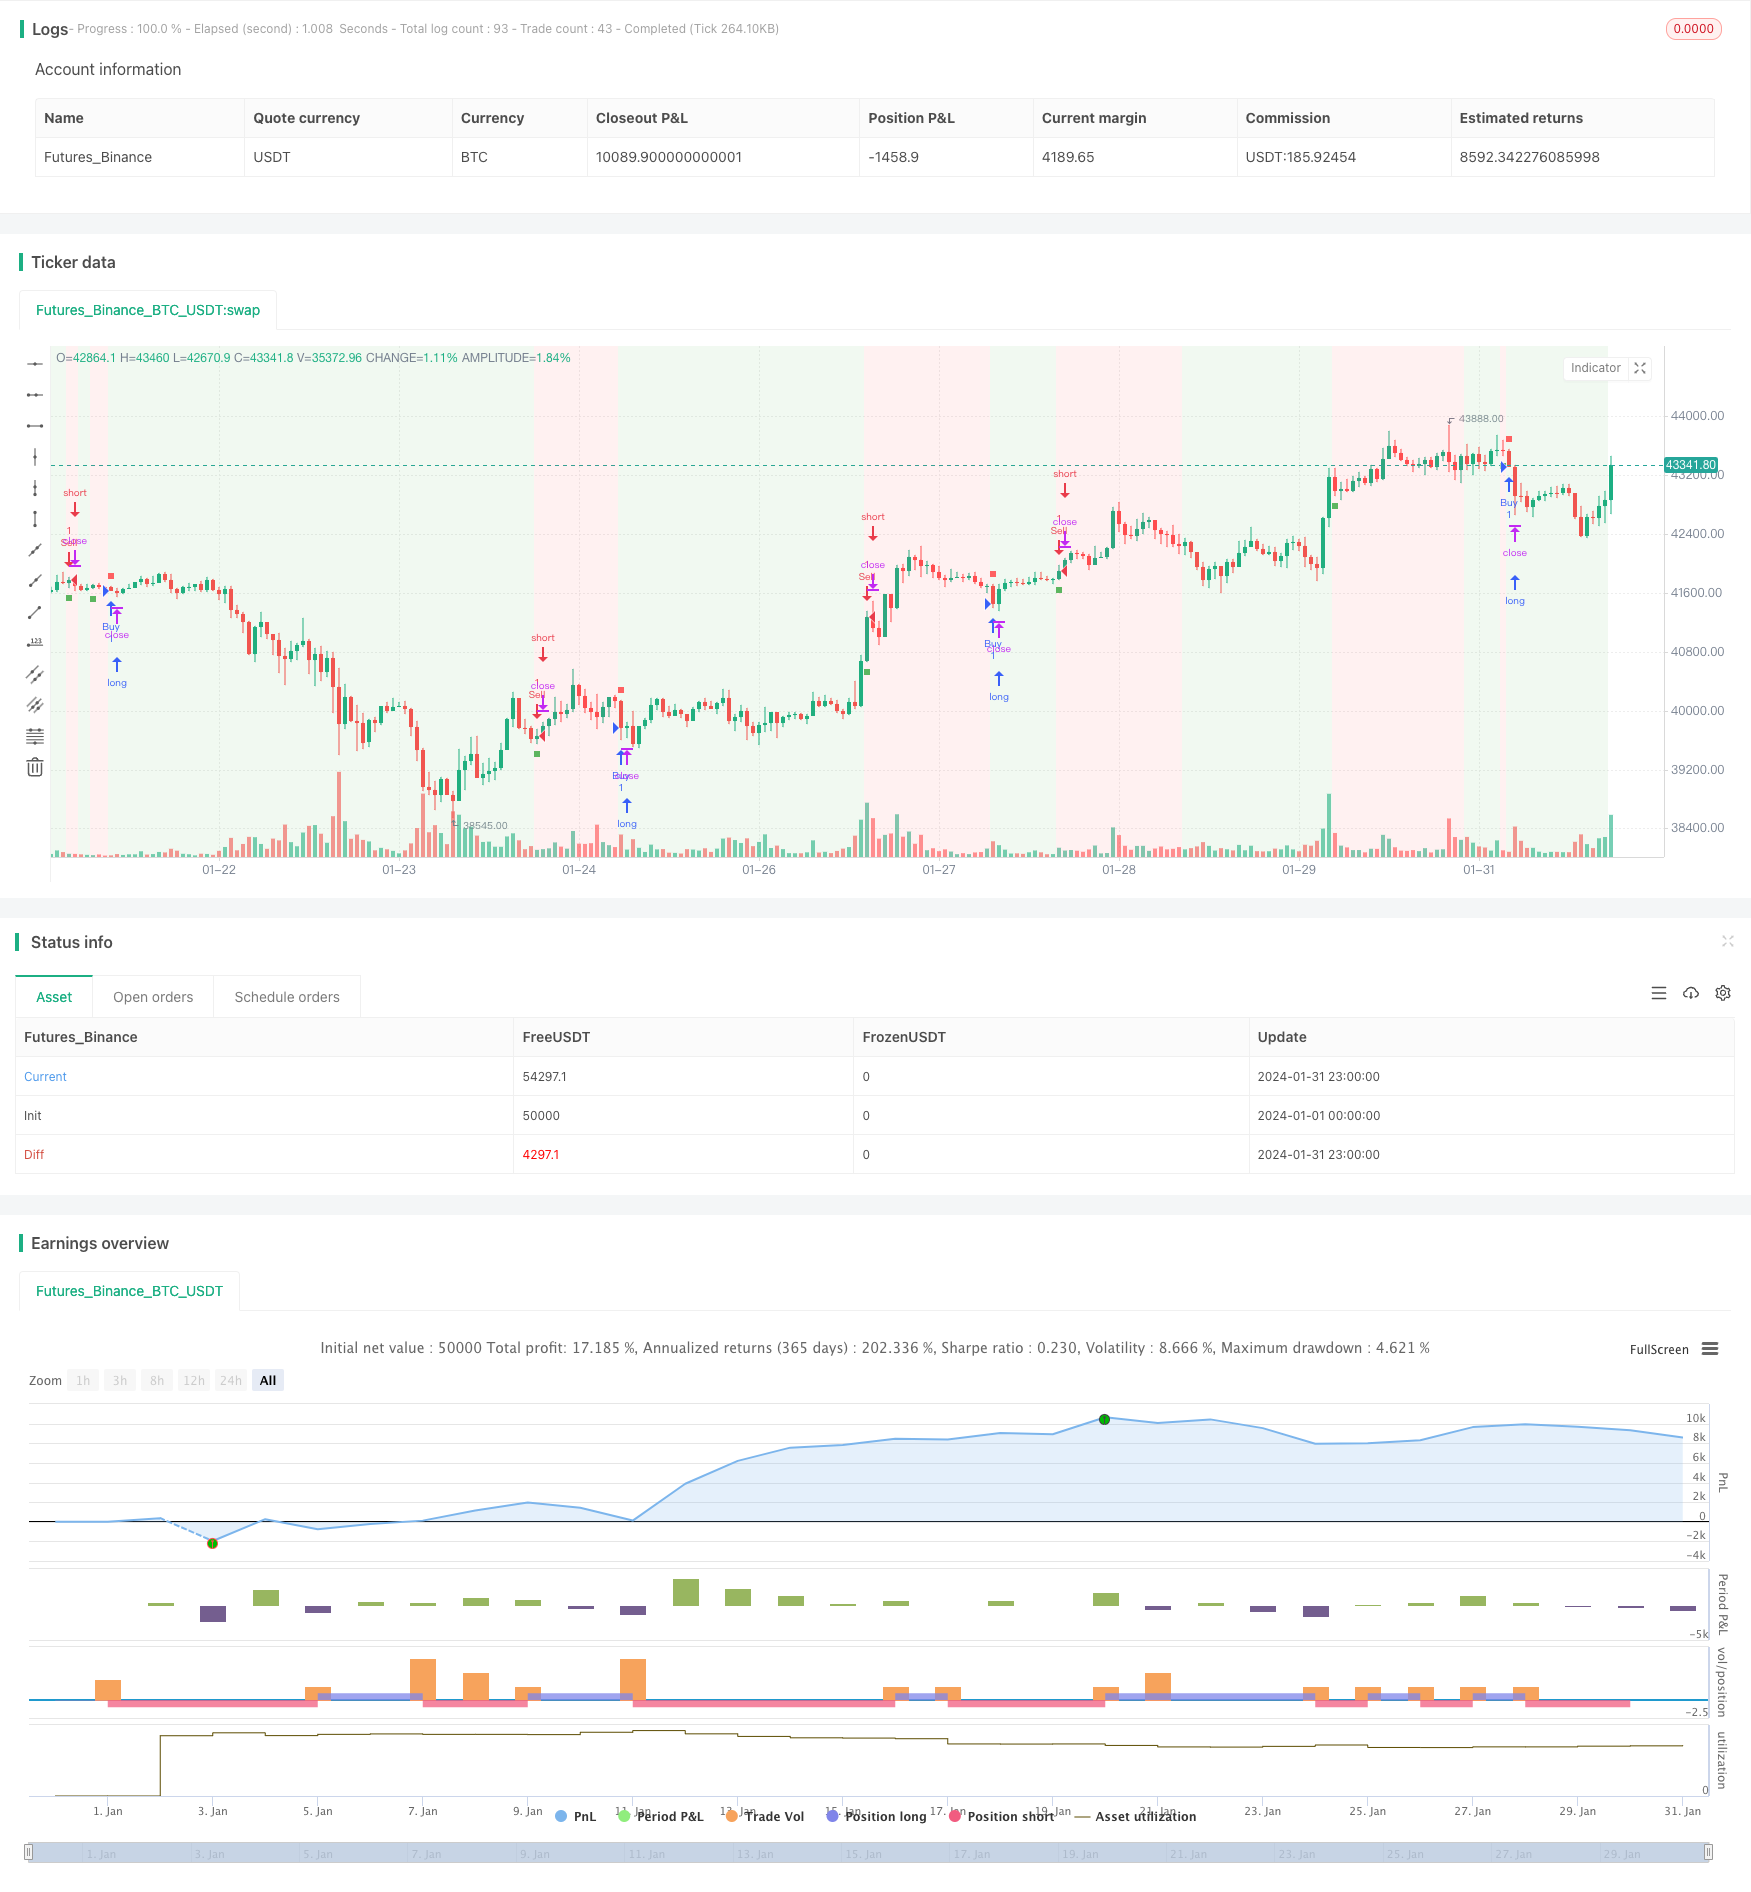
/*backtest
start: 2024-01-01 00:00:00
end: 2024-01-31 23:59:59
period: 1h
basePeriod: 15m
exchanges: [{"eid":"Futures_Binance","currency":"BTC_USDT"}]
*/

// This work is licensed under a Attribution-NonCommercial-ShareAlike 4.0 International (CC BY-NC-SA 4.0) https://creativecommons.org/licenses/by-nc-sa/4.0/
// © AstroHub

//@version=5
strategy("Vortex Strategy [AstroHub]", shorttitle="VS [AstroHub]", overlay=true)

// Vortex Indicator Settings
length = input(14, title="Length", group ="AstroHub Vortex Strategy", tooltip="Number of bars used in the Vortex Indicator calculation. Higher values may result in smoother but slower responses to price changes.")
mult = input(1.0, title="Multiplier", group ="AstroHub Vortex Strategy", tooltip="Multiplier for the Vortex Indicator calculation. Adjust to fine-tune the sensitivity of the indicator to price movements.")
threshold = input(0.5, title="Threshold",group ="AstroHub Vortex Strategy",  tooltip="Threshold level for determining the trend. Higher values increase the likelihood of a trend change being identified.")
emaLength = input(20, title="EMA Length", group ="AstroHub Vortex Strategy", tooltip="Length of the Exponential Moving Average (EMA) used in the strategy. A longer EMA may provide a smoother trend indication.")

// Calculate Vortex Indicator components
a = math.abs(close - close[1])
b = close - ta.sma(close, length)
shl = ta.ema(b, length)
svl = ta.ema(a, length)

// Determine trend direction
upTrend = shl > svl
downTrend = shl < svl

// Define Buy and Sell signals
buySignal = ta.crossover(shl, svl) and close > ta.ema(close, emaLength) and (upTrend != upTrend[1])
sellSignal = ta.crossunder(shl, svl) and close < ta.ema(close, emaLength) and (downTrend != downTrend[1])

// Execute strategy based on signals
strategy.entry("Sell", strategy.short, when=buySignal)
strategy.entry("Buy", strategy.long, when=sellSignal)

// Background color based on the trend
bgcolor(downTrend ? color.new(color.green, 90) : upTrend ? color.new(color.red, 90) : na)

// Plot Buy and Sell signals with different shapes and colors
buySignal1 = ta.crossover(shl, svl) and close > ta.ema(close, emaLength)
sellSignal1 = ta.crossunder(shl, svl) and close < ta.ema(close, emaLength)

plotshape(buySignal1, style=shape.square, color=color.new(color.green, 10), size=size.tiny, location=location.belowbar, title="Buy Signal")
plotshape(sellSignal1, style=shape.square, color=color.new(color.red, 10), size=size.tiny, location=location.abovebar, title="Sell Signal")
plotshape(buySignal1, style=shape.square, color=color.new(color.green, 90), size=size.small, location=location.belowbar, title="Buy Signal")
plotshape(sellSignal1, style=shape.square, color=color.new(color.red, 90), size=size.small, location=location.abovebar, title="Sell Signal")