Trendfolgestrategie mit dreifacher Bestätigung
Überblick
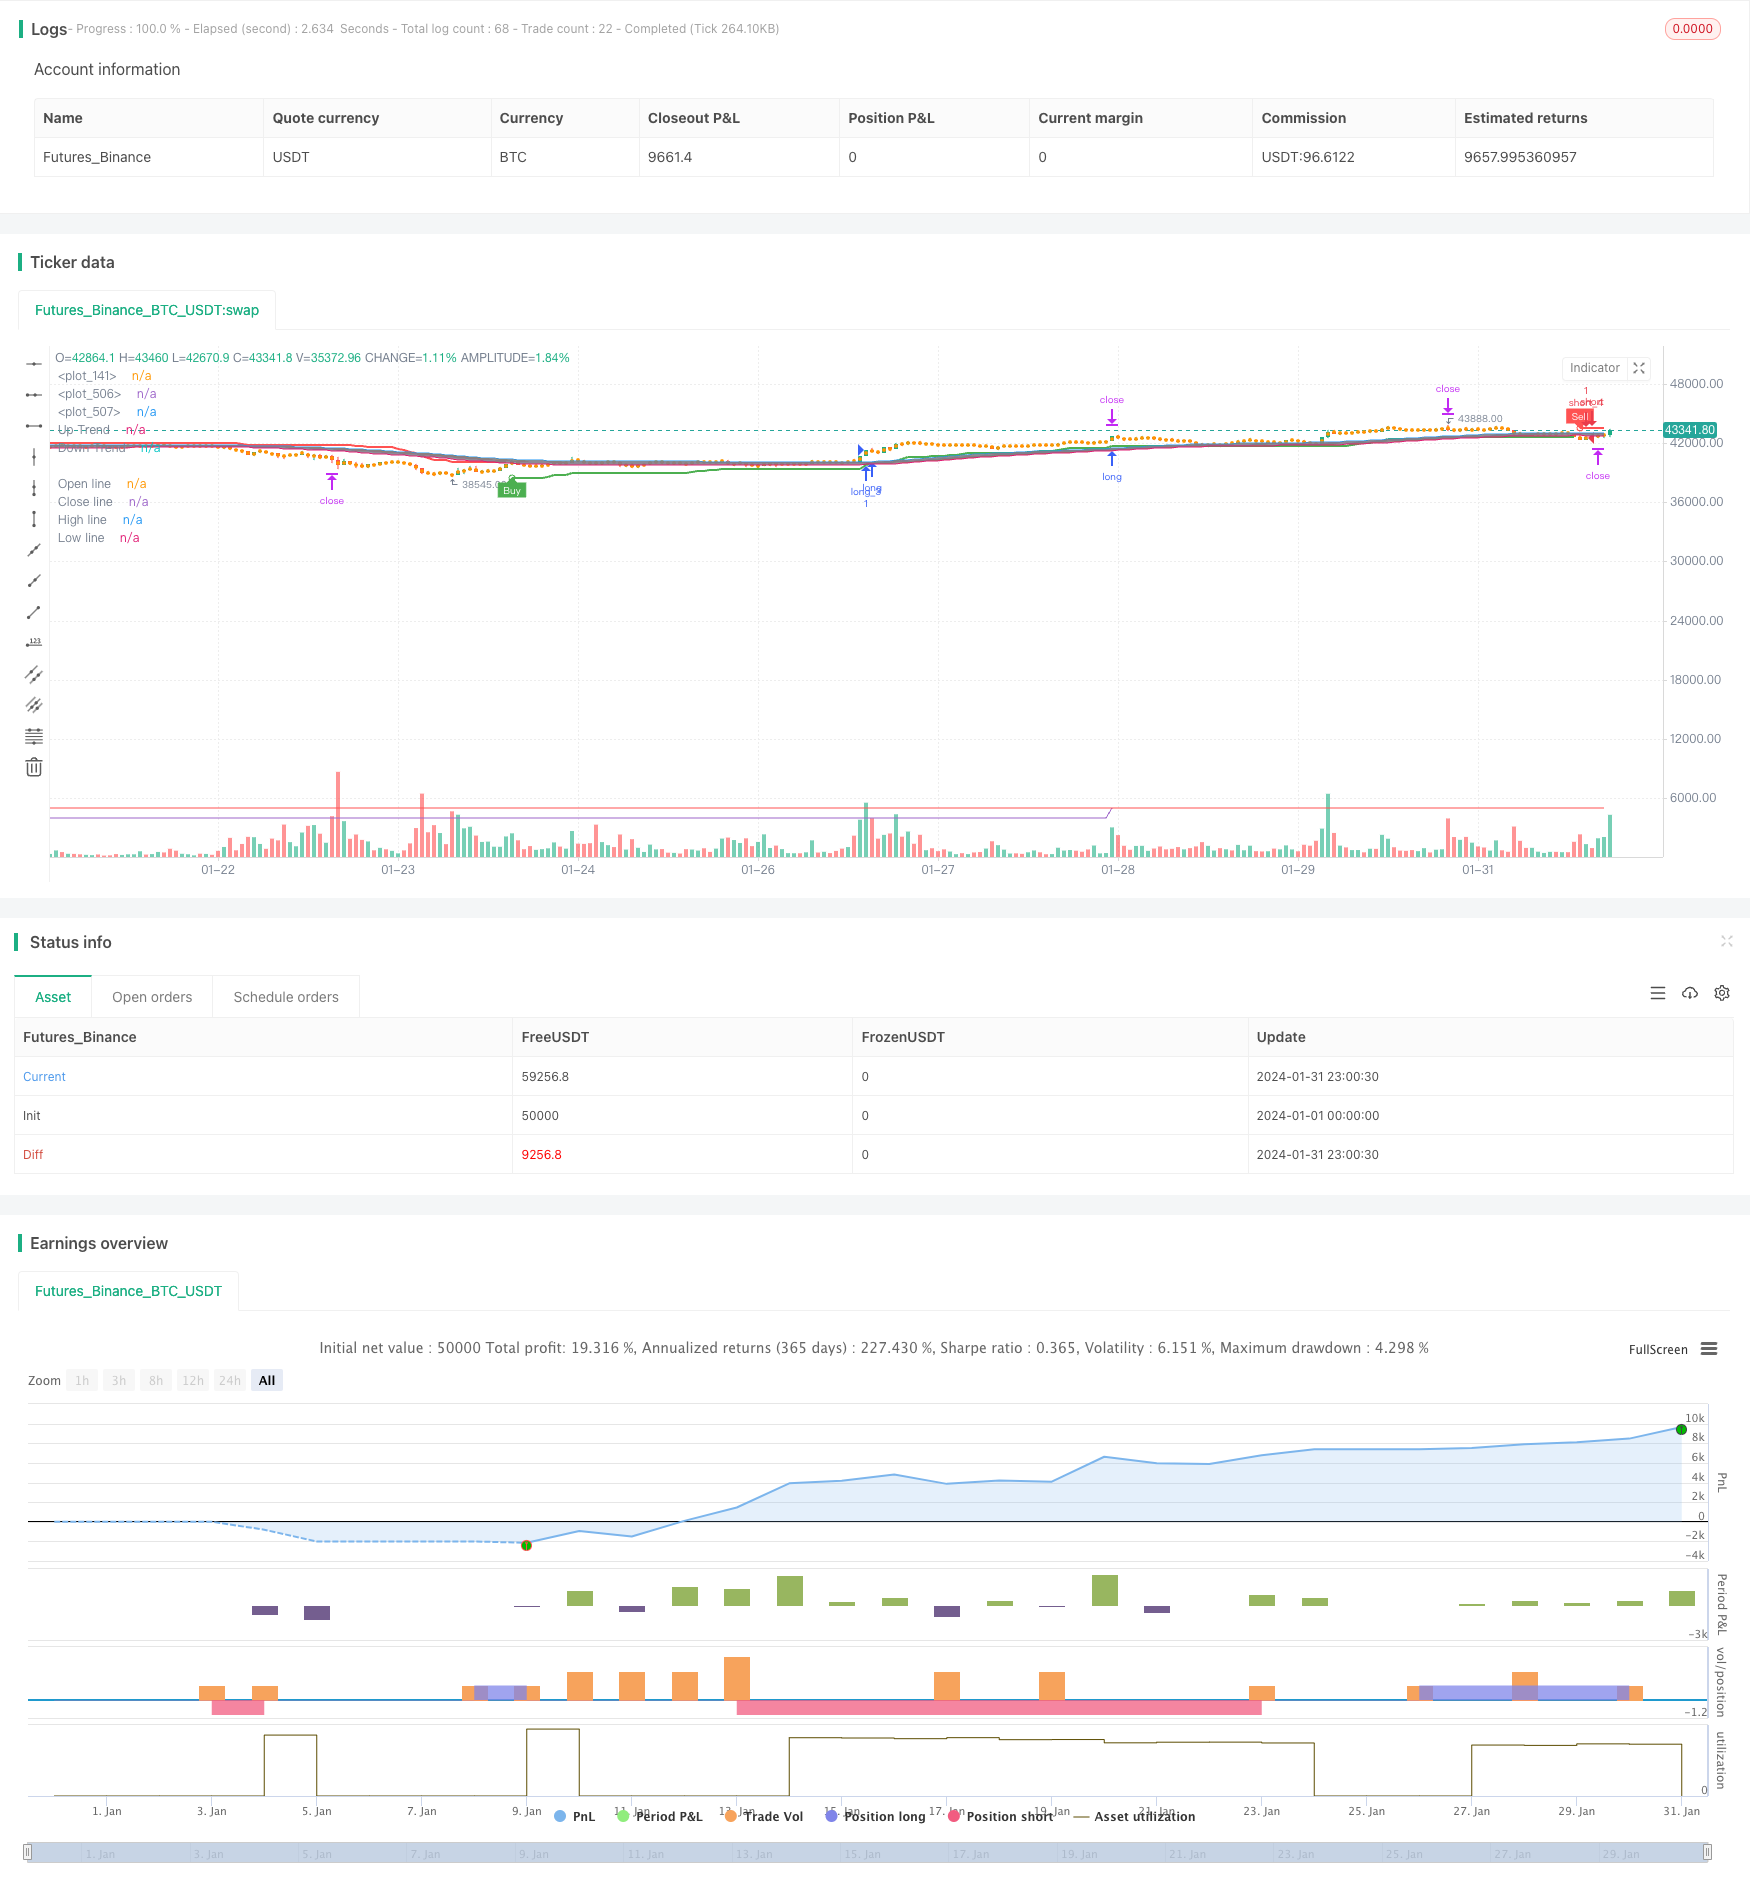
Dreifache Bestätigung Trend-Tracking-Strategie durch die Kombination der Verwendung von drei Indikatoren wie die Durchschnittslinie, die Gedächtnislinie und Supertrend Signal, um eine hohe Wahrscheinlichkeit für den Trend zu fangen. Wenn die drei großen Indikatoren gleichzeitig senden, kaufen oder verkaufen Signal, die Strategie wird in der Zeit eingegeben, den Trend zu verfolgen; wenn der Trend umgekehrt, die Strategie wird schnell zu stoppen, die Gegenseite leer.
Strategieprinzip
Durchschnittliche Beurteilung der Haupttrends
Die Strategie verwendet eine Durchschnittslinie mit einer Länge von 52 Zyklen, um die Richtung des Haupttrends zu bestimmen. Wenn der Preis die Durchschnittslinie überschreitet, wird er als Aufwärtstrend beurteilt; wenn der Preis die Durchschnittslinie unterbricht, wird er als Abwärtstrend beurteilt.
Mind-line-Erkenntnis-Unterstufe-Umkehrung
Die Strategie verwendet gleichzeitig die Vergessungslinie, um eine kurzfristige Unterreaktion zu erkennen. Die Vergessungslinie wird ähnlich wie die Durchschnittslinie berechnet, aber der CLOSE-Preis wird durch den Eröffnungspreis ersetzt, um die Preisumkehrmeldung schneller zu reflektieren. Wenn der Preis eine absteigende Vergessungslinie überschreitet, signalisiert dies ein Signal für einen stabilen Aufschwung der kurzen Preise; wenn der Preis eine steigende Vergessungslinie überschreitet, signalisiert dies einen kurzen Rückgang der Preislinie.
Der Wendepunkt der Supertrends
Die Strategie kombiniert außerdem wichtige Wendepunkte mit dem Supertrend-Indikator. Der Supertrend-Indikator kombiniert die Fensterphase und die Preisdaten des ATR-Indikators, um die Kanäle dynamisch auf und ab zu korrigieren und so den Zeitpunkt der Wende zu bestimmen.
Dreifach bestätigte Signalfilterung
Wenn die drei Indikatoren gleichzeitig ein Kaufsignal senden, wird die Strategie mehr tun. Wenn die drei Indikatoren gleichzeitig ein Verkaufssignal senden, wird die Strategie leer. Durch die Triple-Indikator-Bestätigung können falsche Signale effektiv gefiltert und die Wahrscheinlichkeit des Eintritts erhöht werden.
Analyse der Stärken
Mehrdimensionale Beurteilung, hohe Wahrscheinlichkeit
Die Strategie kombiniert die drei Indikatoren der Durchschnittslinie, der Vergessenslinie und des Supertrends, um Trends und Wendepunkte aus verschiedenen Dimensionen zu beurteilen und eine hohe Eintrittswahrscheinlichkeit zu gewährleisten.
Schnelle Reaktion und Echtzeit-Verfolgung
Die Einführung der Abweichlinie gewährleistet, dass die Strategie schnell auf die kurze Umkehr der Kurse reagieren kann. Die ATR passt sich an die Supertrend-Indikatoren des Kanals an und kann die Preisänderungen in Echtzeit verfolgen.
Automatische Stop-Loss-Systeme, um Risiken zu kontrollieren
Die Strategie verfügt über eine automatische Stop-Stop-Logik, die den Stop-Stop-Loss-Punkt entsprechend der ATR-Dynamik anpasst, um Einzelschäden wirksam zu kontrollieren.
Risiken und Lösungen
Risiken einer zu hohen Handelsfrequenz
Da Strategie-Trading-Signale häufig sind, kann es zu Übertrieben kommen. Die Parameter für die Durchschnittslinie-Periode können entsprechend vergrößert und die Handelsfrequenz verringert werden.
Unsicherheitsrisiken
Die Wirksamkeit der Vergessenslinie und der Supertrend-Indikatoren bei der Bestimmung des Wendepunkts ist unsicher, es besteht ein Risiko für Fehleinschätzungen. Die Filterbedingungen für die Indikatorparameter können erhöht werden, um ein Wendezeichen mit höherer Wahrscheinlichkeit zu gewährleisten.
Risiko von Verlusten durch Erschütterungen
In einem wackligen Zustand kann die Strategie aufgrund von wiederholten Kreuzungen häufig Positionen eröffnen und verlieren, was zu einem Verlustrisiko führt. Ein wackliger Zustand kann erkannt werden und der Strategiehandel kann in dieser Phase ausgesetzt werden.
Optimierungsrichtung
In Verbindung mit der Volatilitätsindikator
Es kann in Verbindung mit Volatilitätsindikatoren, wie z. B. Bollinger Bands, in Betracht gezogen werden. Wenn die Preise in der Nähe der Bollinger Bands nach unten gehen, sollten Sie keine neuen Positionen eröffnen, um das Risiko eines Marktschocks zu vermeiden.
Erhöhung der Eintrittsfilter
Versuchen Sie, zusätzliche Hilfsindikatoren wie KDJ, MACD und andere hinzuzufügen, nur wenn sie gleichzeitig Signale senden. Dies filtert weitere falsche Signale und reduziert unnötige Transaktionen.
Optimierung der Stop-Loss-Strategie
Optimierte Stop-Loss-Strategien wie beispielsweise Moving Stop, Index Moving Stop, Halb-Stand-Spacer Stop, können den Gewinn erhöhen und stabilisieren.
Zusammenfassen
Die Dreifach-Bestätigung-Trend-Tracking-Strategie nutzt die Vorteile der drei Hauptindikatoren der Durchschnittslinie, der Vergessenslinie und des Supertrends, um eine hohe Wahrscheinlichkeit für die Trend-Beurteilung und -Einnahme zu erreichen. Gleichzeitig wird ein automatischer Stop-Loss-Mechanismus eingerichtet, um die Einzelschäden wirksam zu steuern. Es lohnt sich, weiter zu optimieren, dass die Stop-Loss-Strategie in Kombination mit anderen Hilfsindikatoren gefiltert werden kann, um die Strategie praktischer zu machen.
/*backtest
start: 2024-01-01 00:00:00
end: 2024-01-31 23:59:59
period: 1h
basePeriod: 15m
exchanges: [{"eid":"Futures_Binance","currency":"BTC_USDT"}]
*/

//@version=5


//custom variables
hei_col = 0  //1 for green 0 for red
qqe_col = 0  //1 for blue 0 for red
supa_col = 0  //1 for buy 0 for sell
float upratr=0
float lwratr=0
//end


strategy(title='Death_star', overlay=true,calc_on_every_tick = true)

ma_type = input.string(title='MA Type', defval='EMA', options=['EMA', 'SMA', 'SWMA', 'VWMA', 'WMA'])
ma_period = input.int(title='MA Period (Length)', defval=52, minval=1)
ma_period_smoothing = input.int(title='MA Period smoothing (Length)', defval=10, minval=1)

color_positive = input(title='Positive color (Bullish)', defval=color.new(#26A69A, 50))
color_negative = input(title='Negative color (Bearish)', defval=color.new(#EF5350, 50))
color_hl = input(title='High & Low cloud color', defval=color.new(#808080, 80))

show_line = input(title='Show (lines)', defval=false)
show_hl_cloud = input(title='Show (High & Low cloud)', defval=true)
show_oc_cloud = input(title='Show (Open & Close cloud)', defval=true)

//————————————————————————————————————————————————————————————————————————————————
// I.2. Settings, Function definition — — — — — — — — — — — — — — — — — — — — — —
//————————————————————————————————————————————————————————————————————————————————

f_ma_type(input_ma_type, input_source, input_ma_period) =>
    result = float(na)

    if input_ma_type == 'EMA'
        result := ta.ema(input_source, input_ma_period)
        result
    if input_ma_type == 'SMA'
        result := ta.sma(input_source, input_ma_period)
        result
    if input_ma_type == 'SWMA'
        result := ta.swma(input_source)
        result
    if input_ma_type == 'VWMA'
        result := ta.vwma(input_source, input_ma_period)
        result
    if input_ma_type == 'WMA'
        result := ta.wma(input_source, input_ma_period)
        result

    result

//————————————————————————————————————————————————————————————————————————————————
// II.1. Calculations, MA — — — — — — — — — — — — — — — — — — — — — — — — — — — —
//————————————————————————————————————————————————————————————————————————————————

o = f_ma_type(ma_type, open, ma_period)
c = f_ma_type(ma_type, close, ma_period)
h = f_ma_type(ma_type, high, ma_period)
l = f_ma_type(ma_type, low, ma_period)

//————————————————————————————————————————————————————————————————————————————————
// II.2. Calculations, Heikin Ashi — — — — — — — — — — — — — — — — — — — — — — — —
//————————————————————————————————————————————————————————————————————————————————

ha = ticker.heikinashi(syminfo.tickerid)

ha_o = request.security(ha, timeframe.period, o)
ha_c = request.security(ha, timeframe.period, c)
ha_h = request.security(ha, timeframe.period, h)
ha_l = request.security(ha, timeframe.period, l)

//————————————————————————————————————————————————————————————————————————————————
// II.3. Calculations, MA (Smoothing) — — — — — — — — — — — — — — — — — — — — — —
//————————————————————————————————————————————————————————————————————————————————

ha_o_smooth = f_ma_type(ma_type, ha_o, ma_period_smoothing)
ha_c_smooth = f_ma_type(ma_type, ha_c, ma_period_smoothing)
ha_h_smooth = f_ma_type(ma_type, ha_h, ma_period_smoothing)
ha_l_smooth = f_ma_type(ma_type, ha_l, ma_period_smoothing)

//————————————————————————————————————————————————————————————————————————————————
// III.1. Display, Colors — — — — — — — — — — — — — — — — — — — — — — — — — — — —
//————————————————————————————————————————————————————————————————————————————————

tren = ha_c_smooth >= ha_o_smooth

color_trend = tren ? color_positive : color_negative

hei_col := tren ? 1 : 0

color_show_line_positive = show_line ? color_positive : na
color_show_line_negative = show_line ? color_negative : na

color_show_hl_cloud = show_hl_cloud ? color_hl : na
color_show_oc_cloud = show_oc_cloud ? color_trend : na

//————————————————————————————————————————————————————————————————————————————————
// III.2. Display, Plotting & Filling — — — — — — — — — — — — — — — — — — — — — —
//————————————————————————————————————————————————————————————————————————————————

o_line = plot(ha_o_smooth, color=color_show_line_positive, title='Open line')
c_line = plot(ha_c_smooth, color=color_show_line_negative, title='Close line')

h_line = plot(ha_h_smooth, color=color_show_line_positive, title='High line')
l_line = plot(ha_l_smooth, color=color_show_line_negative, title='Low line')

fill(o_line, c_line, color=color_show_oc_cloud, title='Open & Close Trendcloud', transp=90)
fill(h_line, l_line, color=color_show_hl_cloud, title='High & Low Trendcloud', transp=90)

upratr:=(ha_h_smooth)
lwratr:=(ha_l_smooth)
// supa


Periods = input(title='ATR Period', defval=9)
src = input(hl2, title='Source')
Multiplier = input.float(title='ATR Multiplier', step=0.1, defval=3.9)
changeATR = input(title='Change ATR Calculation Method ?', defval=true)
showsignals = input(title='Show Buy/Sell Signals ?', defval=true)
highlighting = input(title='Highlighter On/Off ?', defval=true)
atr2 = ta.sma(ta.tr, Periods)
atr = changeATR ? ta.atr(Periods) : atr2
up = src - Multiplier * atr
up1 = nz(up[1], up)
up := close[1] > up1 ? math.max(up, up1) : up
dn = src + Multiplier * atr
dn1 = nz(dn[1], dn)
dn := close[1] < dn1 ? math.min(dn, dn1) : dn
trend = 1
trend := nz(trend[1], trend)
trend := trend == -1 and close > dn1 ? 1 : trend == 1 and close < up1 ? -1 : trend
upPlot = plot(trend == 1 ? up : na, title='Up Trend', style=plot.style_linebr, linewidth=2, color=color.new(color.green, 0))
buySignal = trend == 1 and trend[1] == -1
plotshape(buySignal ? up : na, title='UpTrend Begins', location=location.absolute, style=shape.circle, size=size.tiny, color=color.new(color.green, 0))
plotshape(buySignal and showsignals ? up : na, title='Buy', text='Buy', location=location.absolute, style=shape.labelup, size=size.tiny, color=color.new(color.green, 0), textcolor=color.new(color.white, 0))
dnPlot = plot(trend == 1 ? na : dn, title='Down Trend', style=plot.style_linebr, linewidth=2, color=color.new(color.red, 0))
sellSignal = trend == -1 and trend[1] == 1
plotshape(sellSignal ? dn : na, title='DownTrend Begins', location=location.absolute, style=shape.circle, size=size.tiny, color=color.new(color.red, 0))
plotshape(sellSignal and showsignals ? dn : na, title='Sell', text='Sell', location=location.absolute, style=shape.labeldown, size=size.tiny, color=color.new(color.red, 0), textcolor=color.new(color.white, 0))
mPlot = plot(ohlc4, title='', style=plot.style_circles, linewidth=0)
longFillColor = highlighting ? trend == 1 ? color.green : color.white : color.white
shortFillColor = highlighting ? trend == -1 ? color.red : color.white : color.white
supa_col := trend == 1 ? 1 : 0
fill(mPlot, upPlot, title='UpTrend Highligter', color=longFillColor, transp=90)
fill(mPlot, dnPlot, title='DownTrend Highligter', color=shortFillColor, transp=90)
alertcondition(buySignal, title='SuperTrend Buy', message='SuperTrend Buy!')
alertcondition(sellSignal, title='SuperTrend Sell', message='SuperTrend Sell!')
changeCond = trend != trend[1]
alertcondition(changeCond, title='SuperTrend Direction Change', message='SuperTrend has changed direction!')

//QQE


//By Glaz, Modified
//study("QQE MOD")
RSI_Period = input(6, title='RSI Length')
SF = input(5, title='RSI Smoothing')
QQE = input(3, title='Fast QQE Factor')
ThreshHold = input(3, title='Thresh-hold')
//

srctt = input(close, title='RSI Source')
//

//
Wilders_Period = RSI_Period * 2 - 1


Rsi = ta.rsi(srctt, RSI_Period)
RsiMa = ta.ema(Rsi, SF)
AtrRsi = math.abs(RsiMa[1] - RsiMa)
MaAtrRsi = ta.ema(AtrRsi, Wilders_Period)
dar = ta.ema(MaAtrRsi, Wilders_Period) * QQE

longband = 0.0
shortband = 0.0
trenda = 0

DeltaFastAtrRsi = dar
RSIndex = RsiMa
newshortband = RSIndex + DeltaFastAtrRsi
newlongband = RSIndex - DeltaFastAtrRsi
longband := RSIndex[1] > longband[1] and RSIndex > longband[1] ? math.max(longband[1], newlongband) : newlongband
shortband := RSIndex[1] < shortband[1] and RSIndex < shortband[1] ? math.min(shortband[1], newshortband) : newshortband
cross_1 = ta.cross(longband[1], RSIndex)
trenda := ta.cross(RSIndex, shortband[1]) ? 1 : cross_1 ? -1 : nz(trenda[1], 1)
FastAtrRsiTL = trenda == 1 ? longband : shortband
////////////////////


length = input.int(50, minval=1, title='Bollinger Length')
mult = input.float(0.35, minval=0.001, maxval=5, step=0.1, title='BB Multiplier')
basis = ta.sma(FastAtrRsiTL - 50, length)
dev = mult * ta.stdev(FastAtrRsiTL - 50, length)
upper = basis + dev
lower = basis - dev
color_bar = RsiMa - 50 > upper ? #00c3ff : RsiMa - 50 < lower ? #ff0062 : color.gray


//
// Zero cross
QQEzlong = 0
QQEzlong := nz(QQEzlong[1])
QQEzshort = 0
QQEzshort := nz(QQEzshort[1])
QQEzlong := RSIndex >= 50 ? QQEzlong + 1 : 0
QQEzshort := RSIndex < 50 ? QQEzshort + 1 : 0
//

//Zero = hline(0, color=color.rgb(116, 26, 26), linestyle=hline.style_dotted, linewidth=1)

////////////////////////////////////////////////////////////////

RSI_Period2 = input(6, title='RSI Length')
SF2 = input(5, title='RSI Smoothing')
QQE2 = input(1.61, title='Fast QQE2 Factor')
ThreshHold2 = input(3, title='Thresh-hold')

src2 = input(close, title='RSI Source')
//

//
Wilders_Period2 = RSI_Period2 * 2 - 1


Rsi2 = ta.rsi(src2, RSI_Period2)
RsiMa2 = ta.ema(Rsi2, SF2)
AtrRsi2 = math.abs(RsiMa2[1] - RsiMa2)
MaAtrRsi2 = ta.ema(AtrRsi2, Wilders_Period2)
dar2 = ta.ema(MaAtrRsi2, Wilders_Period2) * QQE2
longband2 = 0.0
shortband2 = 0.0
trend2 = 0

DeltaFastAtrRsi2 = dar2
RSIndex2 = RsiMa2
newshortband2 = RSIndex2 + DeltaFastAtrRsi2
newlongband2 = RSIndex2 - DeltaFastAtrRsi2
longband2 := RSIndex2[1] > longband2[1] and RSIndex2 > longband2[1] ? math.max(longband2[1], newlongband2) : newlongband2
shortband2 := RSIndex2[1] < shortband2[1] and RSIndex2 < shortband2[1] ? math.min(shortband2[1], newshortband2) : newshortband2
cross_2 = ta.cross(longband2[1], RSIndex2)
trend2 := ta.cross(RSIndex2, shortband2[1]) ? 1 : cross_2 ? -1 : nz(trend2[1], 1)
FastAtrRsi2TL = trend2 == 1 ? longband2 : shortband2


//
// Zero cross
QQE2zlong = 0
QQE2zlong := nz(QQE2zlong[1])
QQE2zshort = 0
QQE2zshort := nz(QQE2zshort[1])
QQE2zlong := RSIndex2 >= 50 ? QQE2zlong + 1 : 0
QQE2zshort := RSIndex2 < 50 ? QQE2zshort + 1 : 0
//

hcolor2 = RsiMa2 - 50 > ThreshHold2 ? color.silver : RsiMa2 - 50 < 0 - ThreshHold2 ? color.silver : na
// plot(FastAtrRsi2TL - 50, title='QQE Line', color=color.new(color.white, 0), linewidth=2)
// plot(RsiMa2 - 50, color=hcolor2, title='Histo2', style=plot.style_columns, transp=50)

Greenbar1 = RsiMa2 - 50 > ThreshHold2
Greenbar2 = RsiMa - 50 > upper

Redbar1 = RsiMa2 - 50 < 0 - ThreshHold2
Redbar2 = RsiMa - 50 < lower
// plot(Greenbar1 and Greenbar2 == 1 ? RsiMa2 - 50 : na, title='QQE Up', style=plot.style_columns, color=color.new(#00c3ff, 0))
// plot(Redbar1 and Redbar2 == 1 ? RsiMa2 - 50 : na, title='QQE Down', style=plot.style_columns, color=color.new(#ff0062, 0))

qqe_col:=Greenbar1 and Greenbar2 == 1 ?1:(Redbar1 and Redbar2 == 1 ?0:-1)


//lab=label.new(bar_index,50,str.tostring(qqe_col))


// ////////////////////////////////////////////////////////////////

// //custom code

// ////////////////////////////////////////////////////////////////


// sma=((lhitt+shitt)/cnt)
// plot(sma*1000)
// plot(250,color=color.red)


//begin


sess=input("0916-1200","time for reversals!!")
v=time(timeframe.period,sess)
rr=input.float(1,"enter the reward..def is 3")
on=na(v)?false:true
bool daybreak=input.bool(false,"daybreak ? true means day end close")
bool apply_on=input.bool(true,"do u want time for reversal?")
apply_on:=not apply_on
test=input.int(2,"train(0) test(1) all(2)?")
// if str.tonumber(timeframe.period)!=5
//     runtime.error("backtests and stocks only valid for 5 min tf!!")
on:=apply_on or on


pts=1/syminfo.mintick
var float sl=0
var float profit=0
// var dud=0
// var counter=0
var con_win=0
var con_lose=0
var tempwin=0
var templose=0
//adding analytics variables
var float[] stararr=array.new_float(10,-1)
var float[] sslarr=array.new_float(10,-1)
var float skipper=-1
var float[] ltararr=array.new_float(10,-1)
var float[] lslarr=array.new_float(10,-1)

var float lhit=0
var float shit=0
var float miss=0
var float cnt=0
var lflag=0
var sflag=0
var i=0
var dud=0
var gap=0
float begin=0
float end=0
// ei_col = 0  //1 for green 0 for red
// qqe_col = 0  //1 for blue 0 for red
// supa_col = 0
//plot(i)
//code begins here
if test==0
    begin:=0
    end:=5500/2
else if test==1
    begin:=5500/2
    end:=bar_index
else if test==2
    begin:=0
    end:=bar_index


if  hei_col==1 and qqe_col==1 and supa_col==1 and lflag==0 and low>upratr and bar_index>=begin and bar_index<=end and on
    lflag:=1
    sflag:=0
    if array.get(lslarr,i)!=-1
        dud:=dud+1
    array.set(lslarr,i,upratr)
    array.set(ltararr,i,(close+rr*(close-upratr)))
    cnt:=cnt+1
    skipper:=i
   // lab=label.new(bar_index,close+100,str.tostring(array.get(lslarr,i)) +"\n"+  str.tostring(array.get(ltararr,i)) +"\n"+str.tostring(i))
    i:=(i+1)%9
    strategy.order("long_"+str.tostring(i-1),strategy.long,1)
    strategy.order("sl_l"+str.tostring(i-1),strategy.short,stop=upratr,oca_name = "exit"+str.tostring(i-1))
    strategy.order("target_l"+str.tostring(i-1),strategy.short,limit=((close+rr*(close-upratr))),oca_name = "exit"+str.tostring(i-1))

if  hei_col==0 and qqe_col==0 and supa_col==0 and sflag==0 and high<lwratr and bar_index>=begin and bar_index<=end and on
    sflag:=1
    lflag:=0
    if array.get(sslarr,i)!=-1
        dud:=dud+1
    array.set(sslarr,i,lwratr)
    array.set(stararr,i,(close-rr*(lwratr-close)))
    skipper:=i
  //  lab=label.new(bar_index,close+100,str.tostring(array.get(sslarr,i)) +"\n"+  str.tostring(array.get(stararr,i)) +"\n"+str.tostring(i))
    i:=(i+1)%9
    cnt:=cnt+1
    strategy.order("short_"+str.tostring(i-1),strategy.short,1)
    strategy.order("sl_s"+str.tostring(i-1),strategy.long,stop=lwratr,oca_name = "exit"+str.tostring(i-1))
    strategy.order("target_s"+str.tostring(i-1),strategy.long,limit=((close-rr*(lwratr-close))),oca_name = "exit"+str.tostring(i-1))


for j=0 to 9
    if array.get(lslarr,j)!=-1 and j!=skipper
        if low < array.get(lslarr,j)  and array.get(lslarr,j)!=-1// and open>array.get(lslarr,j)
            miss:=miss+1
            array.set(ltararr,j,-1)
            array.set(lslarr,j,-1)

        else if high > array.get(ltararr,j)  and array.get(lslarr,j)!=-1 //and open<array.get(ltararr,j)
            lhit:=lhit+1
            array.set(ltararr,j,-1)
            array.set(lslarr,j,-1)

    if array.get(sslarr,j)!=-1 and j!=skipper


        if high > array.get(sslarr,j) and array.get(sslarr,j)!=-1 //and open<array.get(sslarr,j)
            miss:=miss+1
            array.set(stararr,j,-1)
            array.set(sslarr,j,-1)
        else if low < array.get(stararr,j) and array.get(sslarr,j)!=-1 //and open>array.get(stararr,j)
            shit:=shit+1
            array.set(stararr,j,-1)
            array.set(sslarr,j,-1)
skipper:=-1
var day_miss=0
string ender=""
if (timeframe.period)=="1"
    ender:="1528-1529"
else if (timeframe.period)=="5"
    ender:="1520-1525"
else if (timeframe.period)=="15"
    ender:="1500-1515"
else if (timeframe.period)=="60"
    ender:="1330-1430"
else
    //runtime.error("not accounted tf!!")
    daybreak:=false
if time(timeframe.period,ender) and daybreak
    if strategy.position_size!=0
        day_miss+=1
        strategy.cancel_all()
        strategy.close_all("day_end_close")
        for k=0 to (array.size(stararr)==0?na:(array.size(stararr)-1))
            array.set(stararr,k,-1)
            array.set(sslarr,k,-1)

            array.set(ltararr,k,-1)
            array.set(lslarr,k,-1)
    i:=0


if (lhit+shit)>(lhit[1]+shit[1])
    tempwin:=tempwin+1
    templose:=0

else if (miss)>(miss[1])
    templose:=templose+1
    tempwin:=0

if tempwin>con_win
    con_win:=tempwin
if templose>con_lose
    con_lose:=templose


// //*********************adding randomness indicator************

var float nhit=0,var float nphit=0
if cnt%10==0 and cnt>0
    nhit:=(lhit+shit)-nphit
    nphit:=(lhit+shit)

t=table.new(position.top_right,1,6,bgcolor = color.rgb(236, 172, 172))
table.cell(t,0,0,str.tostring(((lhit+shit)/cnt)*100))
table.cell(t,0,1,str.tostring(((lhit+shit)/(lhit+shit+miss))*100))
table.cell(t,0,2,"daymiss "+str.tostring(day_miss))
//table.cell(t,0,1,str.tostring(((lhit)/cnt)*100))
//table.cell(t,0,2,str.tostring(((shit)/cnt)*100))
table.cell(t,0,3,str.tostring(con_win))
// table.cell(t,0,4,str.tostring(gap))
table.cell(t,0,4,str.tostring(con_lose))
table.cell(t,0,5,str.tostring(cnt))
//plot(1000*cnt,color =color.rgb(105, 28, 28))
// // plot(40000+lhit+shit,color=strategy.closedtrades%10==0?color.green:color.white,style=plot.style_circles)
//plot(1000*(lhit+shit),color=color.green)
//plot(1000*miss,color=color.red)

// // hitrate=strategy.wintrades/strategy.closedtrades
// // plot(hitrate*100)
// // plot(strategy.wintrades)
//plot(nhit*10000)
//dud is overwritten trades whereas day_miss are the trades closed at days end

// sma=(lhit+shit)/(lhit+shit+miss)
// plot(sma*100000)
// plot(50000,color=color.red)

// plot(con_win*1000,color=color.green)
// plot(con_lose*1000,color=color.red)


var float[] dat=array.new_float(10,-1)
var dati=0
var float datp=0
if miss>miss[1]
    for cd=0 to ((miss-miss[1])-1)
        array.set(dat,dati,0)
        dati:=(dati+1)%10
if (lhit+shit)>(lhit[1]+shit[1])
    for cd=0 to (  ((lhit+shit)-(lhit[1]+shit[1]))  -1)
        array.set(dat,dati,1)
        dati:=(dati+1)%10

if array.get(dat,9)!=-1
    for cd=0 to 9
        datp:=datp+array.get(dat,cd)

plot((datp/10)*10000)
plot(5000,color = color.red)
datp:=0