Trendfolgestrategie für mehrere Zeitrahmen basierend auf Unterstützungs-, Widerstands- und Momentumindikatoren
Strategieübersicht
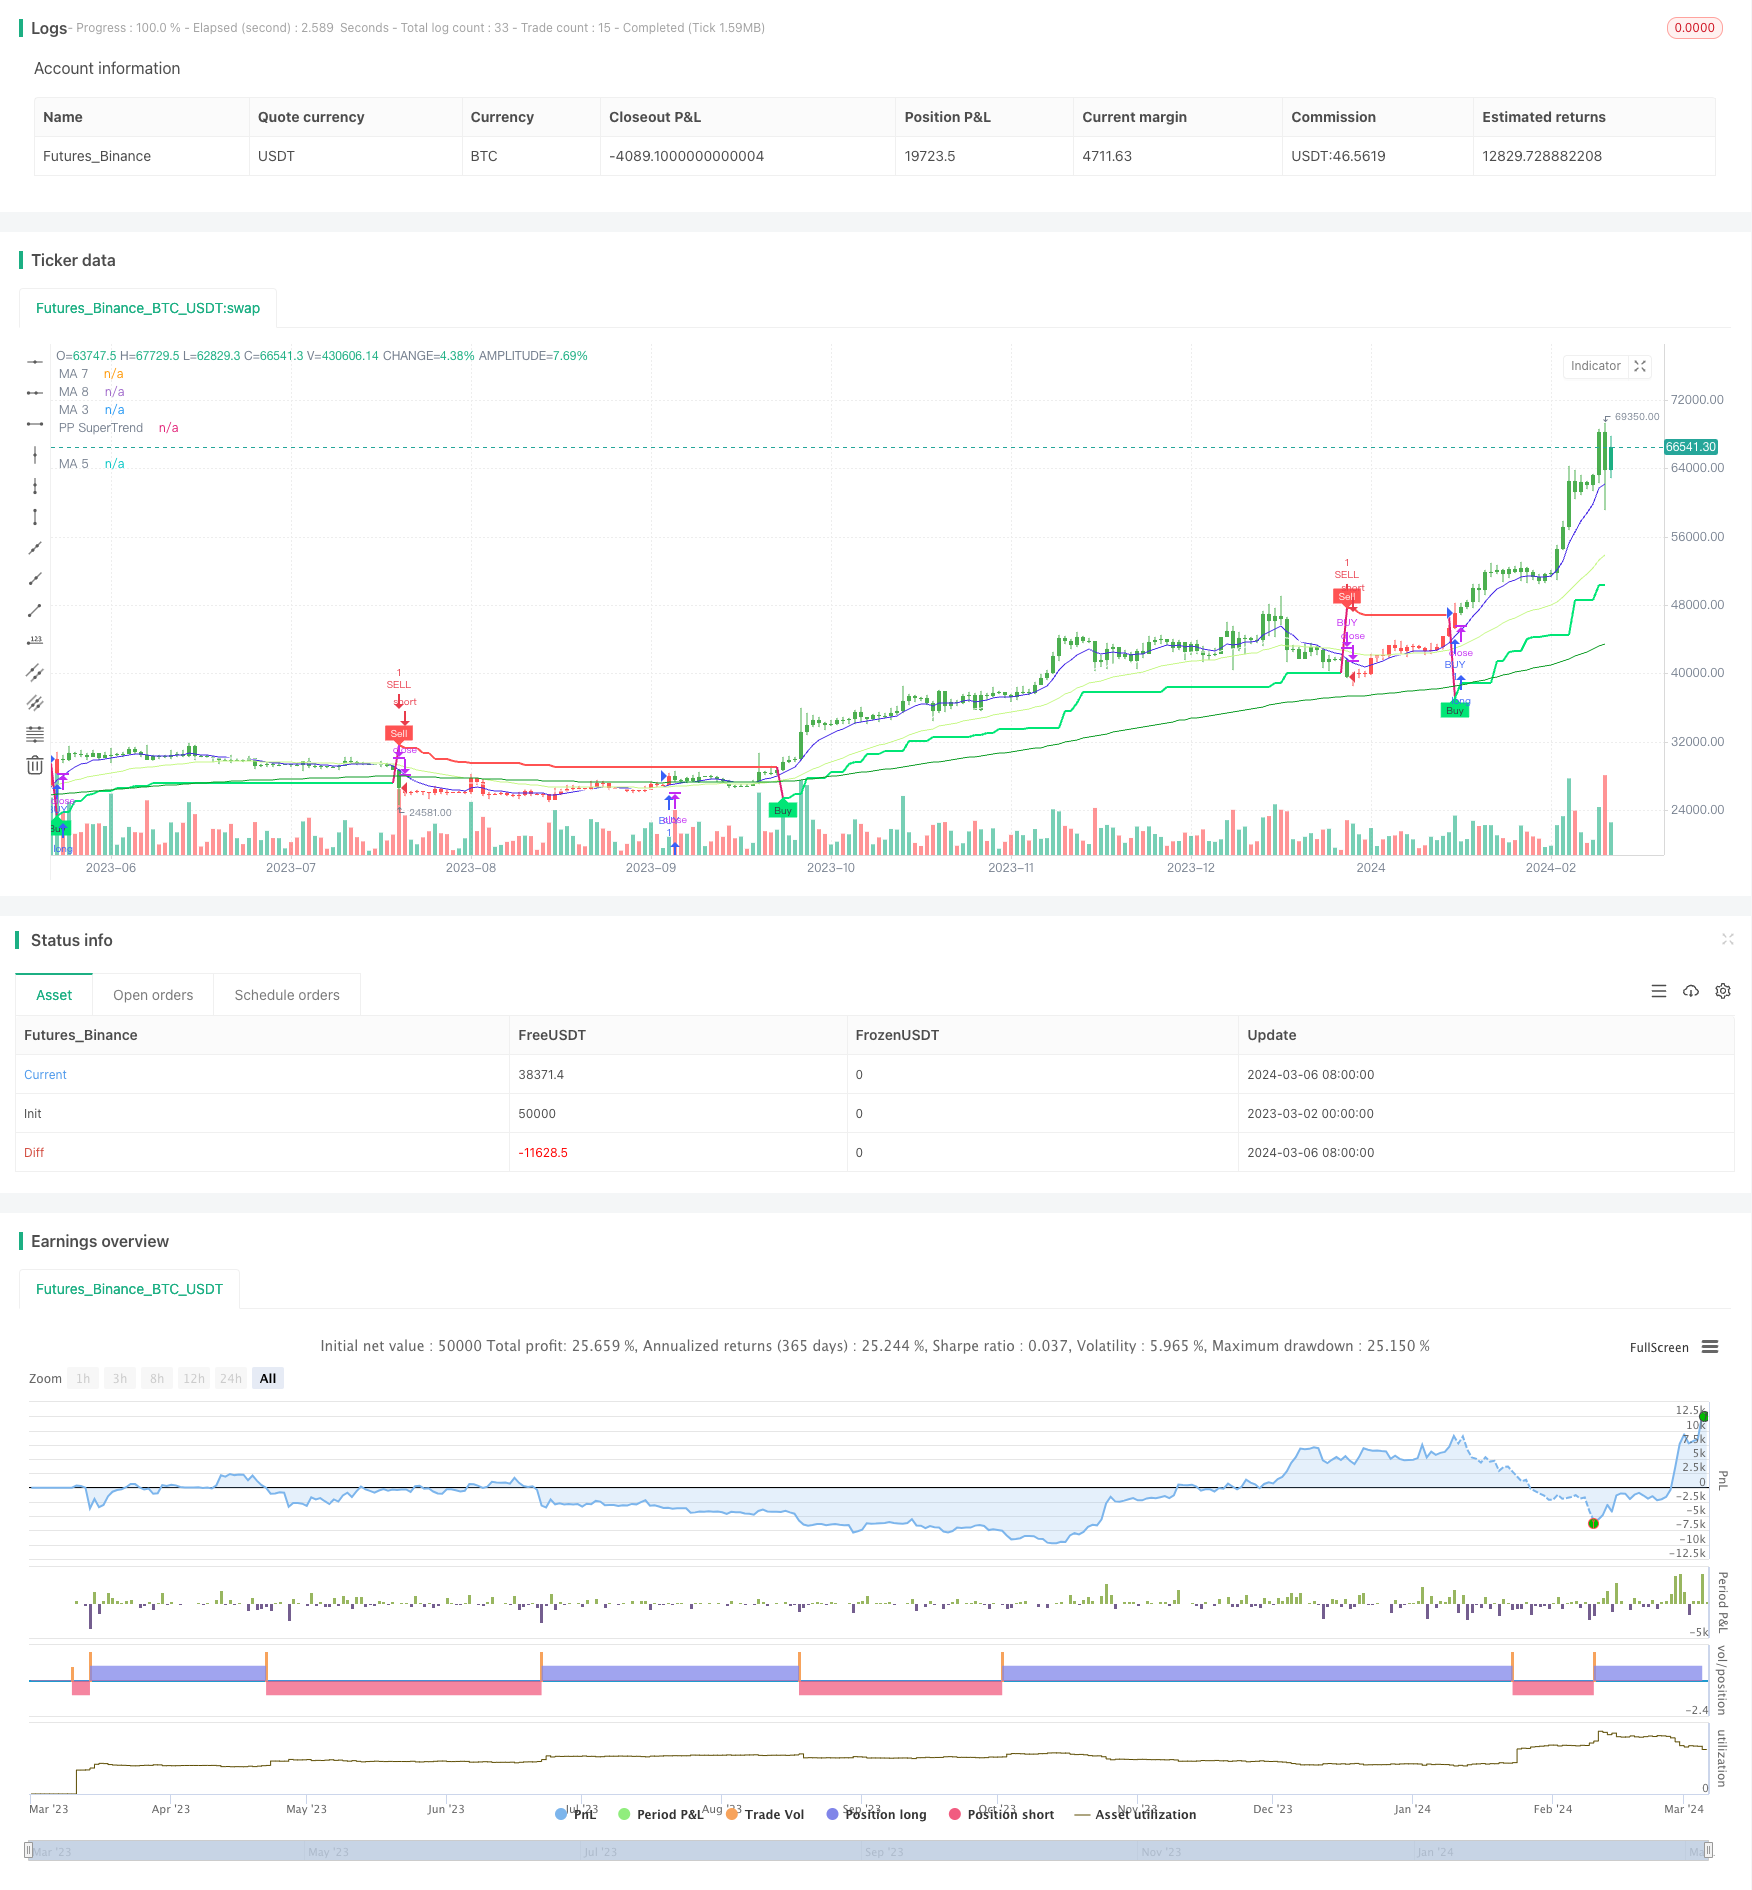
Die Strategie nutzt mehrere technische Indikatoren wie die Unterstützung von Widerstand, Supertrend-Indikatoren und Moving Averages, um die Richtung der Tendenz auf mehreren Zeiträumen zu beurteilen. Die Hauptidee der Strategie besteht darin, zuerst die Achsenpunkte zu verwenden, um die Position des aktuellen Preises zu beurteilen, dann die Unterstützung von Widerstand zu verwenden, um die aktuelle Trendrichtung zu beurteilen, und schließlich den Moving Average zu verwenden, um den Trend abzufiltern. Die Strategie unterstützt auch die Risikokontrolle, z. B. die Einrichtung von Handelszeitfenstern und die Begrenzung der maximalen Position.
Strategieprinzip
- Zunächst berechnen Sie die Pivot-Punkte nach dem höchsten oder niedrigsten Preis in einem bestimmten Zeitraum und erhalten Sie die Widerstandsstufe für den aktuellen Preis.
- Der Supertrend wird berechnet durch die Resistenz der dynamischen Unterstützung.
- Die Strategie verwendet den ATR-Stop als Stop-Loss auf der Grundlage des ursprünglichen Supertrends.
- Der Trend wird mit einem beweglichen Durchschnitt gefiltert. Es wird nur ausgefiltert, wenn der Trend nach oben geht und der Preis über dem Durchschnitt liegt, und nur wenn der Trend nach unten geht und der Preis unter dem Durchschnitt liegt.
- Setzen Sie eine Zeitfenster für den Handel. Eröffnen Sie nur Positionen in bestimmten Zeitabschnitten, um den Handel an wichtigen Zeitpunkten zu vermeiden.
- Multiple Positions werden separat verwaltet. Die Multiple- und Leerpositionssignale lösen jeweils ihre eigene Platzierungslogik aus.
Insgesamt kann man sagen, dass die Strategie eine Position eröffnet, wenn die drei Bedingungen Resistance, Supertrend-Richtung und Gleichgewichts-Richtung in den Kernpunkten unterstützen. Wenn eine der drei Bedingungen ausfällt, ist die Position ausgeglichen. Dies hilft, den Trend effektiv zu erfassen und gleichzeitig das Risiko zu kontrollieren.
Analyse der Stärken
- Der Vorteil des Handels auf Basis von Resistenzpositionen besteht darin, dass die Marktbilanz in Übereinstimmung mit den Gesetzen der Marktversorgung und -nachfrage und der dynamischen Reaktionsfähigkeit des Pivot Points ist.
- Der Supertrend kann Trends effektiv erfassen und zeitnah ein Stop setzen. Der ATR-Stop hält das Risiko weiter im Griff.
- Durch die Einheitsfilterung wird ein Rückschlaggeschäft vermieden. Eintritt bei Resonanz zwischen Trend und Einheitslinie hat eine höhere Gewinnrate.
- Das benutzerdefinierte Zeitfenster verhindert zu einem gewissen Grad den Handel an wichtigen Zeitpunkten wie vor dem Börsenöffnung und -schluss.
- Mehrkopf- und Leerkopfsignale funktionieren unabhängig voneinander und können gleichzeitig mehrere freie Positionen besitzen, um die Marktchancen besser zu nutzen.
Risikoanalyse
- Die Strategie kann dazu führen, dass die Börse häufig in unruhigen Märkten platziert, was zu hohen Handelskosten führt.
- Der Trend kann immer noch rückläufig sein. Obwohl die Strategie mit einer Durchschnittsfilterung ausgestattet ist, kann der Trend rückläufig sein, wenn die Durchschnittslinie selbst gegen den Trend geht.
- Optimierung der Parameter. Die Strategie enthält viele Parameter, wie z. B. die Periodizität und Multiplikation der Supertrends, die Durchschnittsperiode usw. Verschiedene Parameter werden unterschiedliche Ergebnisse erzielen, und es ist eine Herausforderung, die optimale Kombination der Parameter zu wählen.
- In extremen Situationen, wie beispielsweise bei einem Sturm, einem Einbruch oder einer Liquiditätskrise, kann die Strategie möglicherweise nicht rechtzeitig eingestellt werden.
Optimierungsrichtung
- Die Einführung von mehr mittleren und langen Durchschnittskurven, eine höhere Zuverlässigkeit bei der Trendbeurteilung und weniger häufige Transaktionen.
- Einführung von Volatilitätsindikatoren wie Bollinger Bands kann in Erwägung gezogen werden, um den Handel in den hochvolatilen Märkten zu reduzieren.
- Optimierung der Parameter, um die optimale Kombination von Parametern zu finden und die Strategie zu stabilisieren.
- Es kann auch in Betracht gezogen werden, unregelmäßige Marktschwankungen zu berücksichtigen, wie z. B. Preissprung, Anstieg des Umsatzes usw., um den Handel bei Unregelmäßigkeiten zu reduzieren oder zu beenden.
Zusammenfassen
Die Strategie integriert mehrere technische Analysemethoden wie Stützungswiderstand, Trendverfolgung und Dynamikfilter, die in der Lage sind, in Trendsituationen effektiv zu profitieren, während die Rücktrittsrisiken kontrolliert werden. Ihr Vorteil besteht darin, dass die Signale klar und präzise sind, logisch klar sind und für den Einsatz in mittelfristigen Zyklen geeignet sind. Allerdings gibt es auch häufige Probleme mit dem Handel, der Schwierigkeit der Parameteroptimierung und der unzureichenden Risikokontrolle in extremen Situationen.
/*backtest
start: 2023-03-02 00:00:00
end: 2024-03-07 00:00:00
period: 1d
basePeriod: 1h
exchanges: [{"eid":"Futures_Binance","currency":"BTC_USDT"}]
*/

//@rpcoelho
// Based on © Julien_Eche "Pivot Point Supertrend" with optional EMAs ploted
//@version=4

strategy("PPS w/ EMAs", overlay=true)

prd = input(defval = 1, title="Pivot Point Period", minval = 1, maxval = 50)
Factor=input(defval = 4, title = "ATR Factor", minval = 1, step = 0.1)
Pd=input(defval = 72, title = "ATR Period", minval=1)
showpivot = input(defval = false, title="Show Pivot Points")
showlabel = input(defval = true, title="Show Buy/Sell Labels")
showcl = input(defval = false, title="Show PP Center Line")
showsr = input(defval = false, title="Show Support/Resistance")

/////////////////////////////////////////////////////////////////////////
// Switch Board
////////////////////////////////////////////////////////////////////////
// Define the switch board title as a label (since grouping is not available)
//switchboard_group = "████ Switch Board (Turn On/Off Overlay Indicators) ████"
//label.new(bar_index, high, switchboard_group, color=color.red)
// Create input controls for EMA and VWAP switches
switch_ema = input(true, title="EMA")

/////////////////////////////////////////////////////////////////////////
// EMA Selection
////////////////////////////////////////////////////////////////////////

ma_function(source, length, type) =>
    float ma = na
    if type == 'RMA'
        ma := rma(source, length)
    else if type == 'SMA'
        ma := sma(source, length)
    else if type == 'EMA'
        ma := ema(source, length)
    else if type == 'WMA'
        ma := wma(source, length)
    else if type == 'HMA'
        ma := length < 2 ? hma(source, 2) : hma(source, length)
    else
        ma := vwma(source, length)
    ma

// Moving Averages Line Title
//ma_group = "██████████ MAs Line ██████████"

// Inputs for MA 1
len1bool = input(false, title="Show MA 1")
len1 = input(13, title="Length MA 1")
ma_1_type = input("EMA", title="Type MA 1", options=["RMA", "SMA", "EMA", "WMA", "HMA", "VWMA"])
src_ma1 = input(title="MA1 Source", type=input.source, defval=close)
ma_1_colour = input(color.rgb(235, 159, 238), title="Color MA 1")

// Inputs for MA 2
len2bool = input(false, title="Show MA 2")
len2 = input(17, title="Length MA 2")
ma_2_type = input("EMA", title="Type MA 2", options=["RMA", "SMA", "EMA", "WMA", "HMA", "VWMA"])
src_ma2 = input(title="MA2 Source", type=input.source, defval=close)
ma_2_colour = input(color.rgb(230, 241, 65), title="Color MA 2")

// Inputs for MA 3
len3bool = input(true, title="Show MA 3")
len3 = input(34, title="Length MA 3")
ma_3_type = input("EMA", title="Type MA 3", options=["RMA", "SMA", "EMA", "WMA", "HMA", "VWMA"])
src_ma3 = input(title="MA3 Source", type=input.source, defval=close)
ma_3_colour = input(#c7f887, title="Color MA 3")

// Inputs for MA 4
len4bool = input(false, title="Show MA 4")
len4 = input(72, title="Length MA 4")
ma_4_type = input("EMA", title="Type MA 4", options=["RMA", "SMA", "EMA", "WMA", "HMA", "VWMA"])
src_ma4 = input(title="MA4 Source", type=input.source, defval=close)
ma_4_colour = input(#2f6999, title="Color MA 4")

// Inputs for MA 5
len5bool = input(true, title="Show MA 5")
len5 = input(144, title="Length MA 5")
ma_5_type = input("EMA", title="Type MA 5", options=["RMA", "SMA", "EMA", "WMA", "HMA", "VWMA"])
src_ma5 = input(title="MA5 Source", type=input.source, defval=close)
ma_5_colour = input(color.rgb(13, 156, 37), title="Color MA 5")

// Inputs for MA 6
len6bool = input(true, title="Show MA 6")
len6 = input(610, title="Length MA 6")
ma_6_type = input("EMA", title="Type MA 6", options=["RMA", "SMA", "EMA", "WMA", "HMA", "VWMA"])
src_ma6 = input(title="MA6 Source", type=input.source, defval=close)
ma_6_colour = input(color.rgb(173, 161, 152), title="Color MA 6")

// Inputs for MA 7
len7bool = input(true, title="Show MA 7")
len7 = input(8, title="Length MA 7")
ma_7_type = input("EMA", title="Type MA 7", options=["RMA", "SMA", "EMA", "WMA", "HMA", "VWMA"])
src_ma7 = input(title="MA7 Source", type=input.source, defval=close)
ma_7_colour = input(color.rgb(68, 39, 231), title="Color MA 7")

// Inputs for MA 8
len8bool = input(true, title="Show MA 8")
len8 = input(21, title="Length MA 8")
ma_8_type = input("EMA", title="Type MA 8", options=["RMA", "SMA", "EMA", "WMA", "HMA", "VWMA"])
src_ma8 = input(title="MA8 Source", type=input.source, defval=close)
ma_8_colour = input(color.white, title="Color MA 8")

ema1 = security(syminfo.tickerid, timeframe.period, ma_function(src_ma1, len1, ma_1_type))
ema2 = security(syminfo.tickerid, timeframe.period, ma_function(src_ma2, len2, ma_2_type))
ema3 = security(syminfo.tickerid, timeframe.period, ma_function(src_ma3, len3, ma_3_type))
ema4 = security(syminfo.tickerid, timeframe.period, ma_function(src_ma4, len4, ma_4_type))
ema5 = security(syminfo.tickerid, timeframe.period, ma_function(src_ma5, len5, ma_5_type))
ema6 = security(syminfo.tickerid, timeframe.period, ma_function(src_ma6, len6, ma_6_type))
ema7 = security(syminfo.tickerid, timeframe.period, ma_function(src_ma7, len7, ma_7_type))
ema8 = security(syminfo.tickerid, timeframe.period, ma_function(src_ma8, len8, ma_8_type))

plot(len1bool and switch_ema ? ema1:na, color=ma_1_colour, linewidth=1, title='MA 1')
plot(len2bool and switch_ema? ema2:na, color=ma_2_colour, linewidth=1, title='MA 2')
plot(len3bool and switch_ema? ema3:na, color=ma_3_colour, linewidth=1, title='MA 3')
plot(len4bool and switch_ema? ema4:na, color=ma_4_colour, linewidth=1, title='MA 4')
plot(len5bool and switch_ema? ema5:na, color=ma_5_colour, linewidth=1, title='MA 5')
plot(len6bool and switch_ema? ema6:na, color=ma_6_colour, linewidth=2, title='MA 6')
plot(len7bool and switch_ema? ema7:na, color=ma_7_colour, linewidth=1, title='MA 7')
plot(len8bool and switch_ema? ema8:na, color=ma_8_colour, linewidth=1, title='MA 8')


// get Pivot High/Low
float ph = pivothigh(prd, prd)
float pl = pivotlow(prd, prd)

// drawl Pivot Points if "showpivot" is enabled
plotshape(ph and showpivot, text="H",  style=shape.labeldown, color=na, textcolor=color.red, location=location.abovebar, transp=0, offset = -prd)
plotshape(pl and showpivot, text="L",  style=shape.labeldown, color=na, textcolor=color.lime, location=location.belowbar, transp=0, offset = -prd)

// calculate the Center line using pivot points
var float center = na
float lastpp = ph ? ph : pl ? pl : na
if lastpp
    if na(center)
        center := lastpp
    else
        //weighted calculation
        center := (center * 2 + lastpp) / 3

// upper/lower bands calculation
Up = center - (Factor * atr(Pd))
Dn = center + (Factor * atr(Pd))

// get the trend
float TUp = na
float TDown = na
Trend = 0
TUp := close[1] > TUp[1] ? max(Up, TUp[1]) : Up
TDown := close[1] < TDown[1] ? min(Dn, TDown[1]) : Dn
Trend := close > TDown[1] ? 1: close < TUp[1]? -1: nz(Trend[1], 1)
Trailingsl = Trend == 1 ? TUp : TDown

// plot the trend
linecolor = Trend == 1 and nz(Trend[1]) == 1 ? color.lime : Trend == -1 and nz(Trend[1]) == -1 ? color.red : na
plot(Trailingsl, color = linecolor ,  linewidth = 2, title = "PP SuperTrend")

plot(showcl ? center : na, color = showcl ? center < hl2 ? color.blue : color.red : na)

// check and plot the signals
bsignal = Trend == 1 and Trend[1] == -1
ssignal = Trend == -1 and Trend[1] == 1
plotshape(bsignal and showlabel ? Trailingsl : na, title="Buy", text="Buy", location = location.absolute, style = shape.labelup, size = size.tiny, color = color.lime, textcolor = color.black, transp = 0)
plotshape(ssignal and showlabel ? Trailingsl : na, title="Sell", text="Sell", location = location.absolute, style = shape.labeldown, size = size.tiny, color = color.red, textcolor = color.white, transp = 0)

//get S/R levels using Pivot Points
float resistance = na
float support = na
support := pl ? pl : support[1]
resistance := ph ? ph : resistance[1]

// if enabled then show S/R levels
plot(showsr and support ? support : na, color = showsr and support ? color.lime : na, style = plot.style_circles, offset = -prd)
plot(showsr and resistance ? resistance : na, color = showsr and resistance ? color.red : na, style = plot.style_circles, offset = -prd)

// Trend Filter from SuperTrend Long Strategy
Periods = input(title="ATR Period", type=input.integer, defval=3)
src = input(hlc3, title="Source")
Multiplier = input(title="ATR Multiplier", type=input.float, step=0.1, defval=4.0)
changeATR = input(title="Change ATR Calculation Method ?", type=input.bool, defval=true)

// Combine the SuperTrend calculations
atr2 = sma(tr, Periods)
atr = changeATR ? atr(Periods) : atr2

up = src - (Multiplier * atr)
up1 = nz(up[1], up)
up := close[1] > up1 ? max(up, up1) : up

dn = src + (Multiplier * atr)
dn1 = nz(dn[1], dn)
dn := close[1] < dn1 ? min(dn, dn1) : dn

trend = 1
trend := nz(trend[1], trend)
trend := trend == -1 and close > dn1 ? 1 : trend == 1 and close < up1 ? -1 : trend

// Moving Average as Trend Filter
periodes_ma = input(title="Moving Average Period", type=input.integer, defval=20)
src_ma = input(title="Moving Average Source", type=input.source, defval=close)
ma = sma(src_ma, periodes_ma)

// Strategy Entry Conditions
FromMonth = input(defval = 1, title = "From Month", minval = 1, maxval = 12)
FromDay   = input(defval = 1, title = "From Day", minval = 1, maxval = 31)
FromYear  = input(defval = 2017, title = "From Year", minval = 999)
ToMonth   = input(defval = 1, title = "To Month", minval = 1, maxval = 12)
ToDay     = input(defval = 1, title = "To Day", minval = 1, maxval = 31)
ToYear    = input(defval = 9999, title = "To Year", minval = 999)

start     = timestamp(FromYear, FromMonth, FromDay, 00, 00)
finish    = timestamp(ToYear, ToMonth, ToDay, 23, 59)

window()  => true

// Combined entry conditions
longCondition = (trend == 1 and trend[1] == -1 and close > ma) or (bsignal and window())
shortCondition = (trend == -1 and trend[1] == 1 and close < ma) or (ssignal and window())

if (longCondition)
    strategy.entry("BUY", strategy.long)

if (shortCondition)
    strategy.close("BUY")
    strategy.entry("SELL", strategy.short)

buy1 = barssince((trend == 1 and trend[1] == -1 and close > ma) or (bsignal and window()))
sell1 = barssince((trend == -1 and trend[1] == 1 and close < ma) or (ssignal and window()))
color1 = buy1[1] < sell1[1] ? color.green : buy1[1] > sell1[1] ? color.red : na
barcolor(color1)