Modifizierte Relative Strength Index Trendfolgestrategie
Erstellungsdatum:
2024-03-29 16:16:37
zuletzt geändert:
2024-03-29 16:16:37
Kopie:
10
Klicks:
729
1
konzentrieren Sie sich auf
1751
Anhänger
Überblick
Die Strategie basiert auf einem modifizierten, relativ starken Index (Modified RSI), um Markttrends zu erfassen. Die Hauptidee der Strategie ist es, die Kreuz- und Vertikale-Signale des Modified RSI-Indikators zu nutzen, um Markttrends zu beurteilen und entsprechend der Trendrichtung zu handeln.
Strategieprinzip
- Die EMA, die den Preis berechnet, als Eingabe für den modifizierten RSI
- Berechnung des modifizierten RSI
- Berechnen von Modified RSI EMA als Signallinie
- Berechnung der Differenz zwischen dem modifizierten RSI und der Signallinie als Quadratur
- Ein Kaufsignal wird erzeugt, wenn der Modified RSI über eine Signallinie fährt und der Quadratogramm größer als 0 ist
- Verkäufersignale werden erzeugt, wenn der Modified RSI unter der Signallinie durchläuft und die Vertikale kleiner als 0 ist
Strategische Vorteile
- Der modifizierte RSI zeigt Trends besser als der herkömmliche RSI
- Die Kombination von Modified RSI-Kreuzsignal und Rectangram-Signal filtert effektiv Falschsignale
- Anpassbar für verschiedene Märkte und Zeiten
- Einfache Prozedur, hohe Rechenleistung
Strategisches Risiko
- Der Modified RSI ist anfällig für falsche Signale in schwankenden Märkten.
- Der Trendwechsel könnte zurückbleiben
- Der einzelne Indikator wird von Preisklären gestört.
Richtung der Strategieoptimierung
- Kann mit anderen Trendindikatoren, wie beispielsweise Moving Averages, kombiniert werden, um die Signalsicherheit zu erhöhen
- Ein Stop-Loss-Stopp-Module kann hinzugefügt werden, um das Risiko eines einzelnen Handels zu kontrollieren.
- Optimierbare Parameter für unterschiedliche Marktmerkmale
- Positionsverwaltungsmodule können hinzugefügt werden, um Positionen dynamisch anzupassen
Zusammenfassen
Die Strategie nutzt die Eigenschaften des Modified RSI-Indikators, um ein Handelssystem aus der Sicht des Trendverfolgens zu bauen. Der Modified RSI-Indikator überwindet einige der Mängel des herkömmlichen RSI-Indikators und hat eine relativ starke Trendfangfähigkeit. Die Strategie für einen einzelnen Indikator weist jedoch oft Grenzen auf und muss in Kombination mit anderen technischen Mitteln verbessert werden.
Strategiequellcode
/*backtest
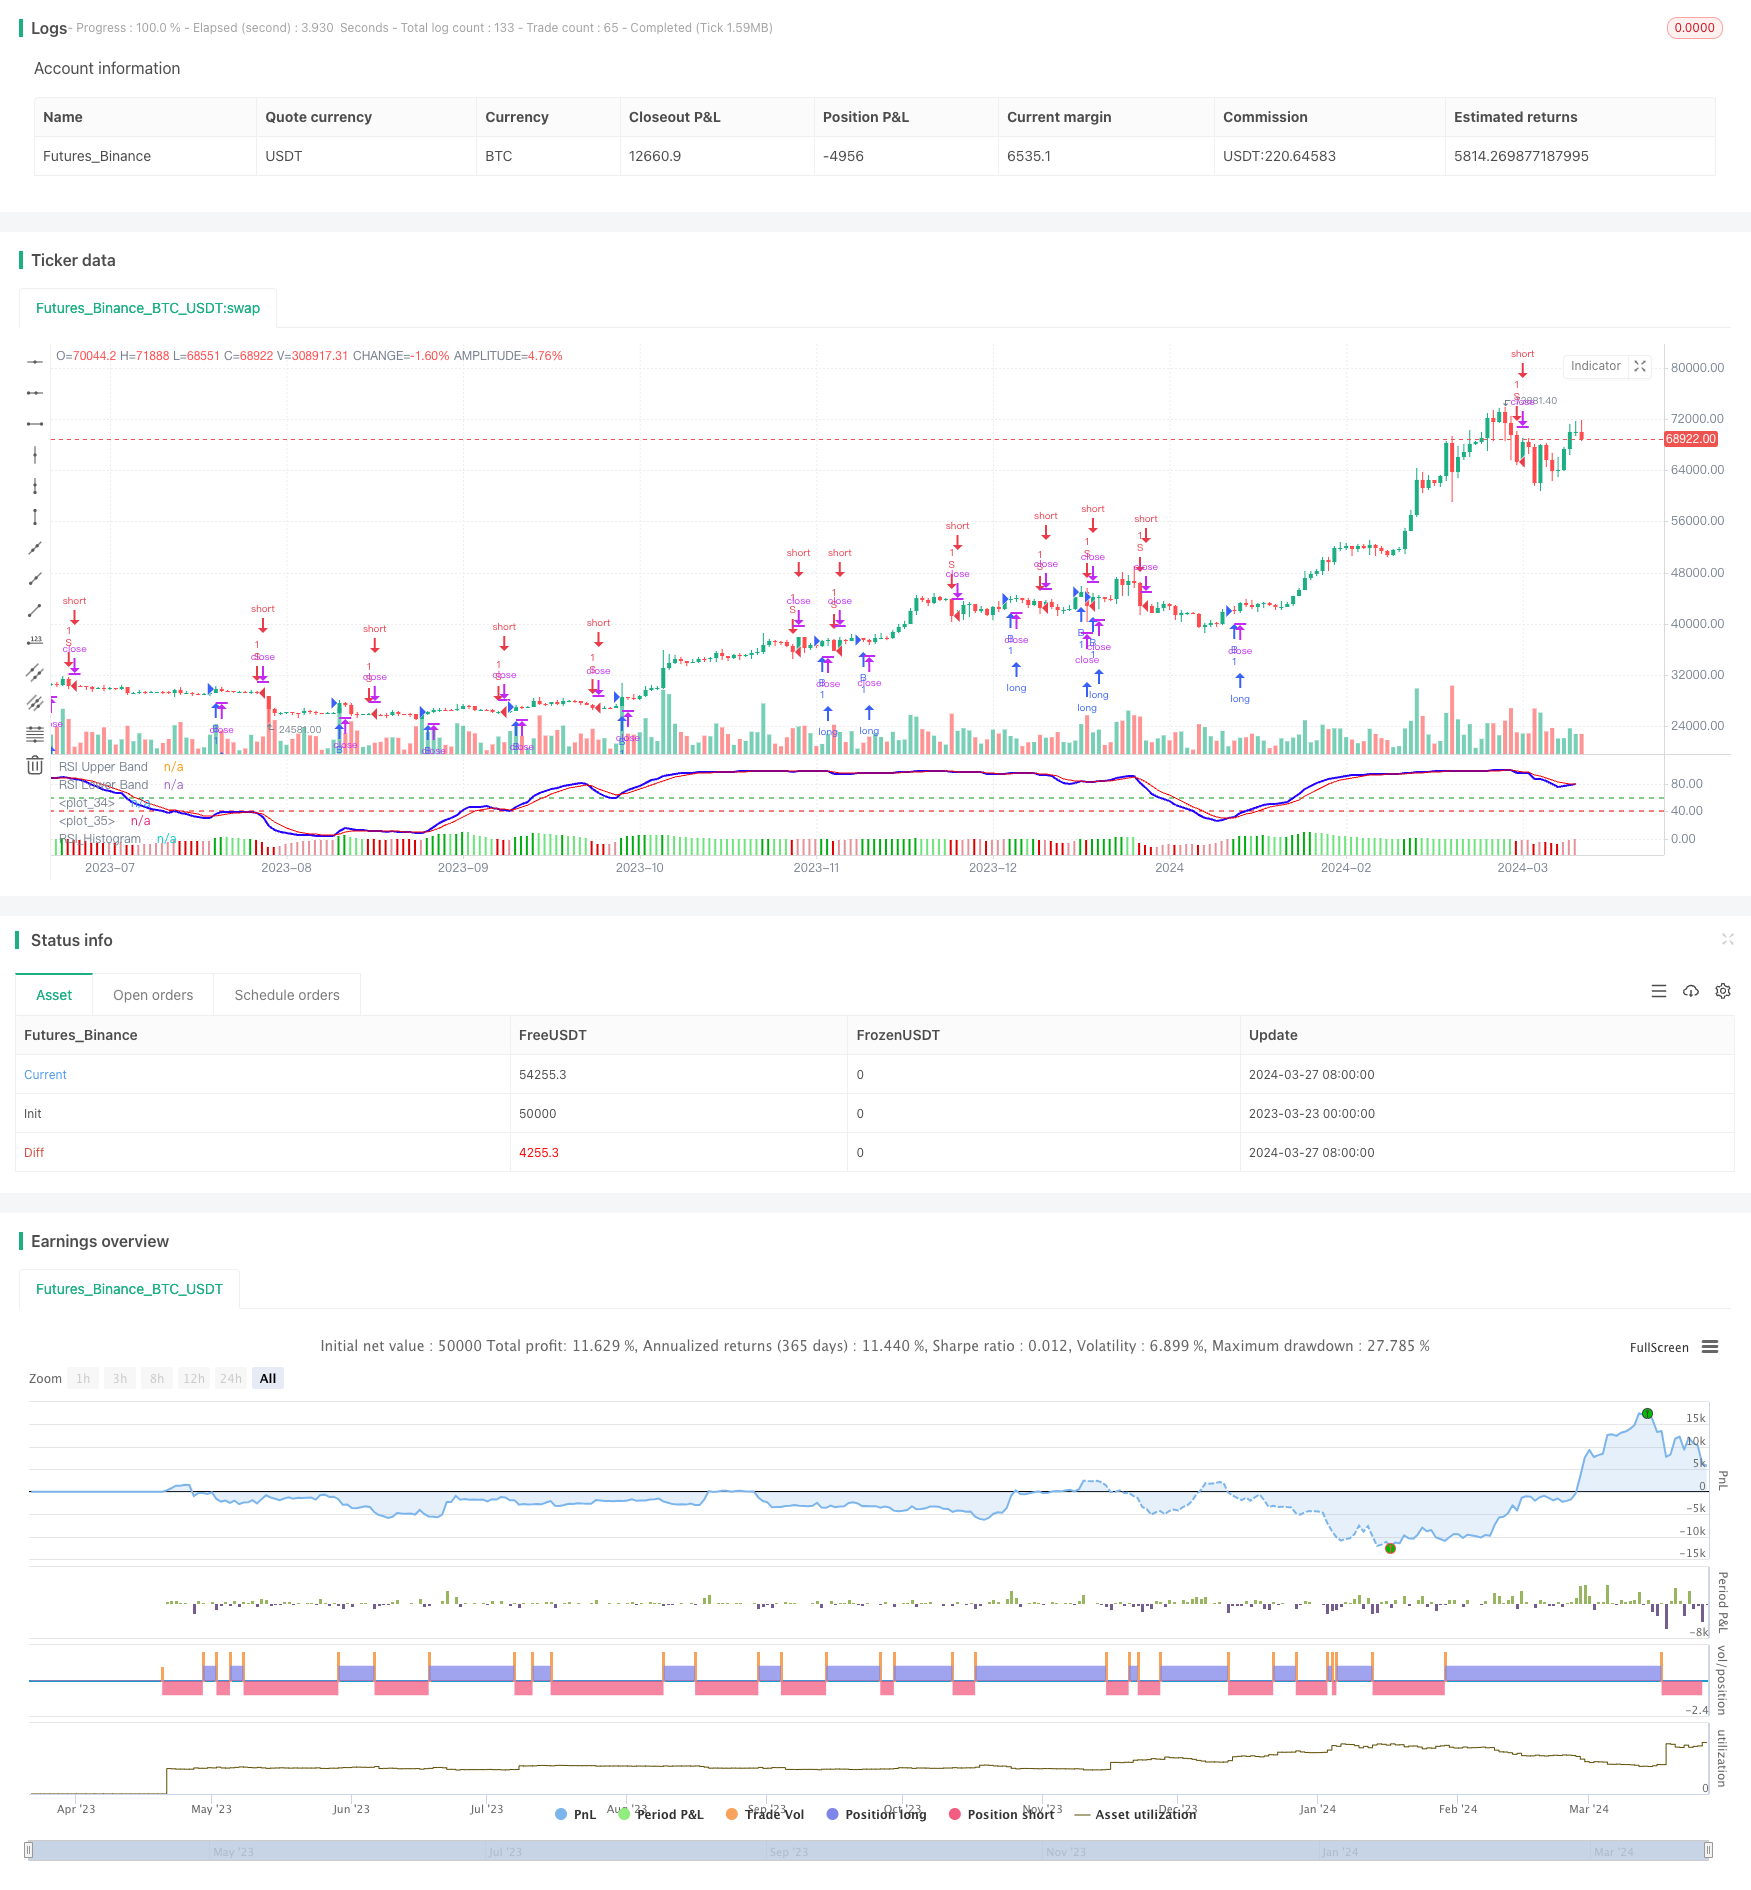
start: 2023-03-23 00:00:00
end: 2024-03-28 00:00:00
period: 1d
basePeriod: 1h
exchanges: [{"eid":"Futures_Binance","currency":"BTC_USDT"}]
*/
// This source code is subject to the terms of the Mozilla Public License 2.0 at https://mozilla.org/MPL/2.0/
// © YogirajDange
//@version=5
// Verical lines
// // Define the times
// t1 = timestamp(year, month, dayofmonth, 09, 15) // 9:15
// t2 = timestamp(year, month, dayofmonth, 11, 15) // 11:15
// t3 = timestamp(year, month, dayofmonth, 13, 15) // 1:15
// t4 = timestamp(year, month, dayofmonth, 15, 25) // 3:25
// // Check if the current bar is on the current day
// is_today = (year(time) == year(timenow)) and (month(time) == month(timenow)) and (dayofmonth(time) == dayofmonth(timenow))
// // Draw a vertical line at each time
// if is_today and (time == t1 or time == t2 or time == t3 or time == t4)
// line.new(x1 = bar_index, y1 = low, x2 = bar_index, y2 = high, extend = extend.both, color=color.red, width = 1)
strategy('Modified RSI')
col_grow_above = input(#02ac11, "Above Grow", group="Histogram", inline="Above")
col_fall_above = input(#6ee47d, "Fall", group="Histogram", inline="Above")
col_grow_below = input(#e5939b, "Below Grow", group="Histogram", inline="Below")
col_fall_below = input(#dd0000, "Fall", group="Histogram", inline="Below")
EMA_length = input.int(13, 'Price_EMA', minval=1)
RSI_length = input.int(14, 'RSI_Period', minval=1)
Avg_length = input.int(5, 'RSI_Avg_EMA', minval=1)
fastMA = ta.ema(close, EMA_length)
modrsi = ta.rsi(fastMA, RSI_length)
RSIAVG = ta.ema(modrsi, Avg_length)
plot(modrsi, color=color.rgb(38, 0, 255), linewidth=2)
plot(RSIAVG, color=color.rgb(247, 0, 0))
rsiUpperBand = hline(60, 'RSI Upper Band', color=#099b0e)
//hline(50, "RSI Middle Band", color=color.new(#787B86, 50))
rsiLowerBand = hline(40, 'RSI Lower Band', color=#e90101)
RSI_hist = modrsi - RSIAVG
//plot(RSI_hist,"RSI_Histogram", color = #c201e9, style = plot.style_columns,linewidth= 5)
plot(RSI_hist, title="RSI_Histogram", style=plot.style_columns, color=(RSI_hist>=0 ? (RSI_hist[1] < RSI_hist ? col_grow_above : col_fall_above) : (RSI_hist[1] < RSI_hist ? col_grow_below : col_fall_below)))
/////// Moving Averages 20 50 EMA
fast_ma = input.int(20, minval=2, title="Fast_EMA")
slow_ma = input.int(50, minval=2, title="Slow_EMA")
src = input.source(close, title="Source")
out = ta.ema(src, fast_ma)
out1 = ta.ema(src, slow_ma)
//plot(out, title="20 EMA", color=color.rgb(117, 71, 247), linewidth = 2)
//plot(out1, title="50 EMA", color=color.rgb(0, 0, 0), linewidth = 2)
longCondition = ((ta.crossover(modrsi, RSIAVG)) and (RSI_hist > 0))
if longCondition
strategy.entry('B', strategy.long)
shortCondition = ((ta.crossunder(modrsi, RSIAVG)) and (RSI_hist < 0))
if shortCondition
strategy.entry('S', strategy.short)